PPC / SEM Analytics: 5 Actionable Tips To Improve ROI
 A very wise friend, ok Craig, once said this to me: "Paid Search is like playing chess with a Supercomputer."
At that moment I think my reaction was something like "meh!". Of course Craig was right.
Search Engine Marketing (Organic + PPC) continues to be a huge part of any company's acquisition strategy on the web. Like other online channels it is targeted, it is effective and it is accountable. Perhaps its most unique asset being the ability to hyper-target relevant customer intent.
It would be fair to say that Paid Search it has also gotten very complex (Search Long Tail anyone?).
Your campaigns and ads are impacted by the many shiny buttons and pretty dials provided by search engines, complex algorithms that determine if your ad shows up (or not), and a bunch of cool things that search engines are doing (like Universal Search).
Given that context measuring impressions and clicks and click thru rates (CTR) and cost per click (CPC) and conversions are now merely price of entry, in fact you focus on those in the first couple days and then very quickly have to elevate your game.
Yet with our tools like Omniture or WebTrends or Google Analytics etc that is kind of all we end up focusing on as Analytics Professionals. Partly because of the limitations of the data available in the tools, partly because most Web Analysts don't have the required deep understanding of what Paid Search is all about.
In this post I wanted to share five cool, "non-normal", analyses that you can do to get a much better understanding of your Paid Search performance. The reports are all inspired from analytical principles I have advocated for quite some time on this blog.
All the analyses been created using the ClickEquations PPC Platform's ability to do impressive deep analysis with its ClickEquations Analyst tool. [Disclosure: I am on the ClickEquations board of advisers.]
Here's how I think of CQ Analyst: Take one part data from all search engines, one part unique custom metrics, one part custom database front end integrated into excel and the resulting ménage à trois combines to produce incredibly powerful insights.
Here are five that we'll cover here:
#1: Identify Keyword "Arbitrage" Opportunities.
#2: Rock Your World, Focus on "What's Changed".
#3: Analyze Visual Impression Share, Compute Lost Revenue.
#4: Embrace the ROI Distribution Report [Identify: Lovers, Friends, Losers].
#5: Zero in on the Actual User Search Query (and Match Type).
Let's go rock it!
#1: Identify Keyword "Arbitrage" Opportunities.
Most web analytics tools dutifully report on search engine data, which ones sending how many visits and what not. They also have a report for keywords. And surely by now you know that you can drill down from the search engine report to look at keywords for that search engine.
Now here is the reality : The ranking of search engines by traffic to your site is fairly well settled. Has been for a long time. It does not change month over month, or changes very little.
What does exist in your data is a different how one keyword performs across search engines! Thanks to the difference in algorithms for both organic and paid search in each engine.
Lookie here, my ClickTracks report….
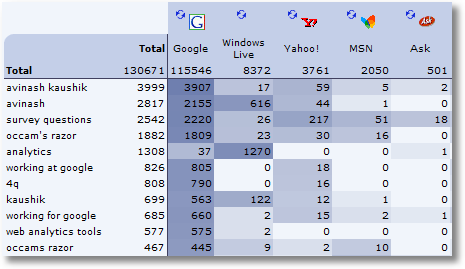
See what I mean? The heatmap shows you how even my humble blog is optimized for different keywords in different engines. This allows me to look for "arbitrage" opportunities (focus on selective keywords for each search engine).
You can do this exactly same thing for your paid search keywords with ClickEquations Analyst, i.e. look at side-by-side performance rankings by clicks or conversions.
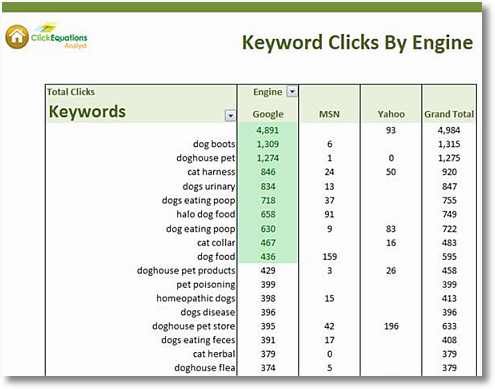
In this example, we see that the keyword dog boots is generating huge traffic on Google (1,309 clicks) but almost nothing on MSN or Yahoo. Why? Are we not buying this delightful keyword on those engines? Is our bid too low or our ad copy ineffective?
Questions you want to answer quickly before your once a year annual huge sale is over and you are left with tons of extra dog boots (heaven forbid!).
Sorting by clicks-per-keyword in another engine, Yahoo in this case, we see that our top traffic terms there are ones where Google is under-performing.
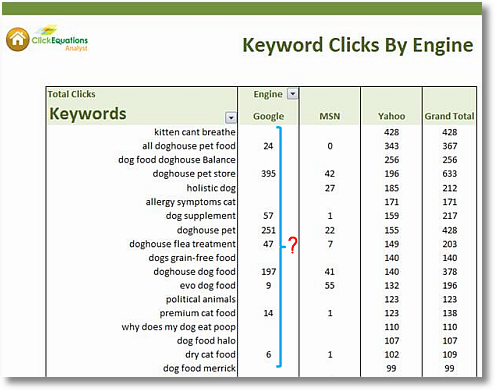
More opportunity!
Let's bring this puppy home, switch to conversions for the same keywords across different search engines. . . .
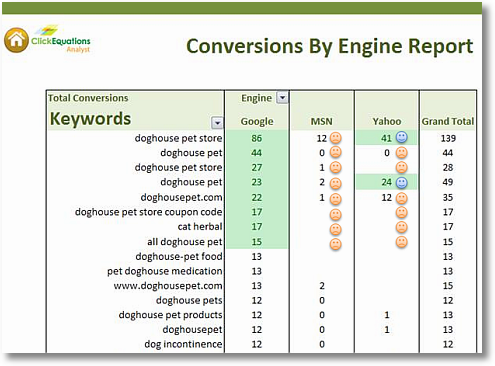
It is pretty clear now where immediate opportunities exist (in case you did not notice, the frowny faces : ) and where you are doing ok.
In our case the keyword that is our second highest performer in terms of bringing home the bacon (conversions!) is doing great on Google but is we are getting eggs on AdCenter (or is it Bing now?) and YSM.
It highlights a possible Sales / Revenue opportunity and gives you marching orders to investigate. Remember you already know that this is working on Google, why not on the other engines?
#2: Rock Your World, Focus on "What's Changed".
While we obsess about our brand terms and our top ten key phrases the reality is that the long tail of search means that our organic and search campaigns focus on tens of thousands or hundreds of thousands of keywords.
One effective strategy to deal with this purely data problem is to focus on what's changed.
No more data pukes. Just looking at things that need attention.
[imagine whip being cracked, politely]
You must do this to stand a decent chance of making ROI on your Search Campaigns.
[/imagine whip being cracked, politely]
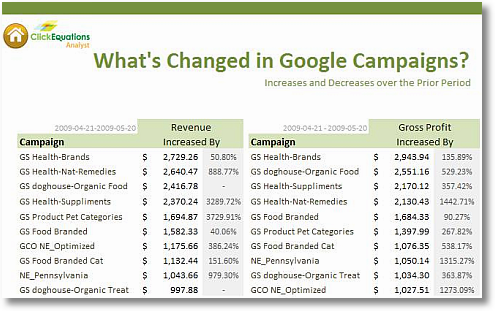
The focus of your What's Changed reports is to show campaigns, ad groups, keywords that are gaining more impressions, getting more clicks, producing more revenue (or not!) compared to a prior relevant time period.
Here's the report:
[Click on the image for a higher resolution version.]
Here's your schedule: Wake up. Take shower. Review major "rises" and "drops" in Gross Profit. Press buttons. Take action. Get coffee. Drive to work to receive praise for a job well done!
Notice the focus is not on Clicks or Visits (not that there's anything wrong with that), its on money baby!
Here's one more very useful example, focusing on Avg CPC's, as you figure out what dials to move. . .
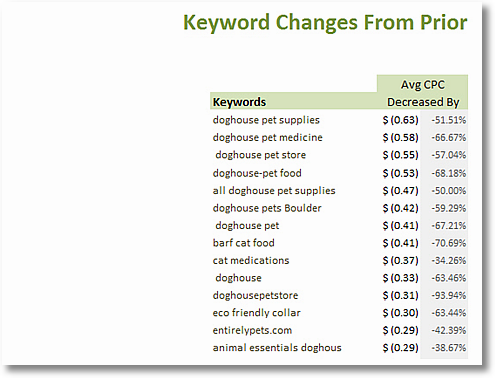
Every line in these reports begs a simple question: Why?
What is causing that ad-group's revenue to soar 498% above what it did last month?
How come that keyword is down 74% in the number of impressions yesterday vs the day before?
Why did the cost per click for doghouse pets boulder suddenly shift that much?
The biggest problem with paid search, or web, analytics is that you don't have starting points. These reports, and metrics, give you that. You can then go investigate the hot leads. Perhaps your competitors have sprung into action. Maybe your quality score has taken a dive. Who knows, the boys in the warehouse may have run out of stock.
The nice thing about the ClickEquations Analyst is that you can easily use the delta feature to set the am out of change between two time periods for any paid search metric.
You can create customized Top X modules of what's changed and literally you have a living breathing dashboard that highlights the most important, and it never gets auto deleted by the HiPPO's!
#3: Analyze Visual Impression Share, Compute Lost Revenue.
Did you read my post about Google's Search Based Keyword Tool ?
One of the really cool things that SbKT offers is Ad/Search Share (8th picture in that post). It tells you how often your ad shows up when someone searches using a specific search query (for both paid and organic).
It is very useful in understanding what share of shelf you have (think shampoos in walmart). It is surprising that only the most hard core PPC folks seem to focus on this metric.
You can also get Impression share for your own keywords portfolio from the Adwords Campaign reports. You want to know how many people who are searching for a keyword that you are bidding on are not seeing your text ads (no see = no click = no honey!).
The CQ Analyst helps you visualize the impression share metric very efficiently, even your HiPPO will understand the story!
The impression share, Exact, report showing "share of voice" for queries matching your keywords. . . .
[Click on the image for a higher resolution version.]
Orange = Yea! Green = Ouch!
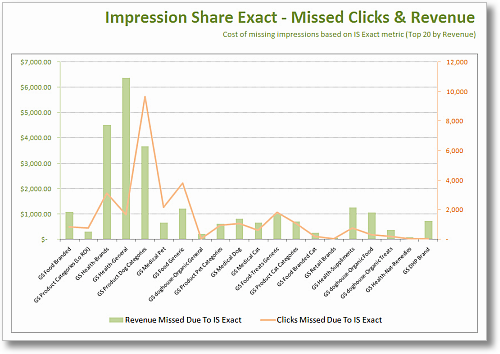
Need more motivation to work harder to improve your impression share? Here you go, missed clicks and revenue. . .
[Click on the image for a higher resolution version.]
Orange: Cause (ouch!). Green: Effect (ouch! ouch!).
The ClickEquations Analyst report is showing above the lost revenue in green, and the orange line shows why that is lost revenue (lost impressions).
It takes the average revenue per click from the impressions you are getting from your campaigns (so the real conversion data from your site) and extrapolating it out to show how much revenue the lost impressions represent.
In the above real customer example the lost impressions alone (without doing anything else) represents revenue growth opportunity of 30%.
Remember this is using your actual current clicks from ads when you do show up (impressions) and your actual current conversions.
Winning those missing impressions would require either a budget increase, or more likely some significant improvement in bids or quality score – but knowing that potential exists offers a clearer view of specific expansion opportunity than paid searcher usually see.
This is a superior understanding of the opportunity then what you'll get out of standard web analytics reports. Superior because you are truly bringing deep AdWords data together with your site's outcomes data.
#4: Embrace the ROI Distribution Report [Identify: Lovers, Friends, Losers].
If you are a Analysis Ninja prepare yourself for a minor orgasm. This is so cool.
Remember the 80/20 rule?
80% of ROI comes from 20% of your Campaigns. Replace ROI with revenue, profit, your favorite metric.
Step One: Specify your ROI goal and your minimum acceptable ROI.
Step Two: Run Report. :)
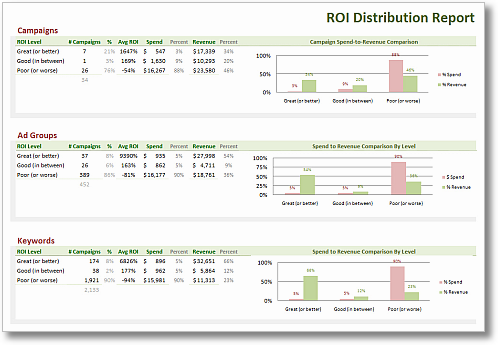
The report tells you how many of your campaigns, adgroups and keywords fall into three performance bands: Great (exceeds expectations), Good (meets expectations), Poor (sucks!). Or: Lovers, Friends, Losers.
[Click on the image for a higher resolution version.]
You'll see the raw numbers, the cost vs revenue breakdowns, and the comparative percentage contributions.

So what's happening here?
8% of the AdGroups are responsible for 54% of the revenue (!). Checkout the Avg ROI contrast.
Or more visual. . .

Its not even 80/20, more like 90/10!
It's a ruthless way to determine which elements are hurting you, and which are actually helping.
This type of analysis allows you to take a very close / critical look at exactly how many of your keywords are really profitable, and which ones are sucking wind.
It should lead to a complete reevaluation of your keyword selections, match type settings, bid choices, ad copy, and campaign organization. Or in other words, the baby and the bath water.
This analysis is super cool because you end up with a prioritized to-do list of campaigns or keywords that require your full attention.
#5: Zero in on the Actual User Search Query (and Match Type).
While the entire business of Paid Search revolves around keywords, often there is not enough attention being paid to the role Match Types play in determining which search queries (the words the search engine user actually types) trigger your paid search ad.
We sadly make far too many decisions based on keywords we bid on.
In our campaigns we use Broad, Phrase and Exact match types to ensure we are showing up for relevant user searches. Hence most of our campaigns include key words which use all or some of these Match Types.
One of the simplest report you can create using the ClickEquations analytics platform helps you analyze the impact of these different match types on performance. . . search query by key word by match type. . . .
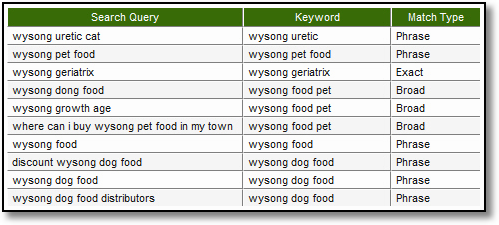
Column 1 is what was typed into the search engine. Column 2 is the keyword that was in your paid search campaign. Column 3 was the Match Type used.
And here is a report that will really solidify the Match Type concept in your mind: The match type report is for the keyword wellness cat food and the actual user search query. . . .
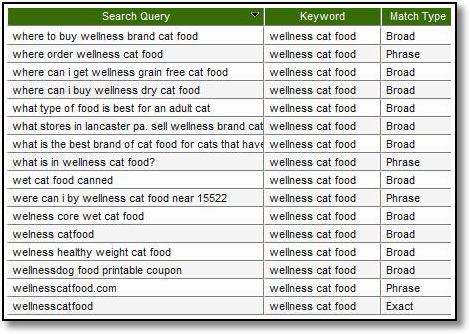
Impressed at the creativity of users who search?
The analysis you should do right away is to understand the performance of individual match types with the user search query for a clump of specific keywords you have bid on.
This analysis will instantly spark ideas for:
1. Match Type promotions (keywords and search queries that you are now buying in Phrase or Broad Match but could and should be in Exact Match)
2. Search queries that are matching your Broad Match keywords but should themselves by Phrase Match keywords
3. (of course) A list of negative keywords that you should add to efficiently stop buying unqualified traffic
If you pause and think about it for a moment this search query report is perhaps the ultimate keyword research tool you could get your hands on. And it is free! Use it!!
The Analysis Ninjas amongst you won't stop there.
No sirree, bob!
You will want to understand performance of various Match Types across your entire account! You'll take three steps up and try to understand the forest view first.
A typical expectation would be that Exact Match keywords, which are very precise targets carefully chosen, will perform better than Precise and certainly Broad Match.
So is it?
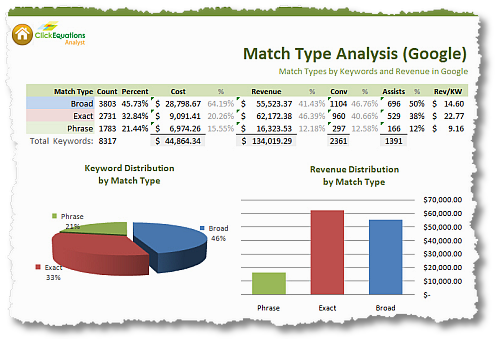
The first report in ClickEquations Reporting gives you the top level analysis of your Match Type distributions.
It answers fundamental questions such as: What is the result of all your hard work in finding and promoting keywords to Exact Match? What about your plan to conquer the earth and moon and pluto to increase the % of revenue you get through Broad Match?
Here you go. . . . Happy Fathers Day. . . .
[Click on the image for a higher resolution version.]
In one nice view (come on you can't argue with a pie and a bar chart on the same page!) the information you need at a glance to understand performance, all the way down to Revenue / KW.
Let's drill down on that to look at it more clearly. . . .
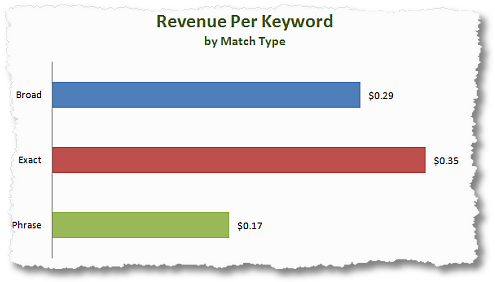
Revenue Per Keyword from Exact Match is much higher than Broad and much much higher than Phrase. That validates our hypothesis and it provides nice support for all the effort we have put into creating highly targeted Exact Match keywords
Do even more of that, while you shift to leveraging Phrase and Broad more strategically.
My favorite view is perhaps to look at the bang for the buck of keywords based on match type. Outcomes sweetie, outcomes!!
The complete picture, Cost -> Revenue -> Gross Profit -> Net Profit by each match type. . . .
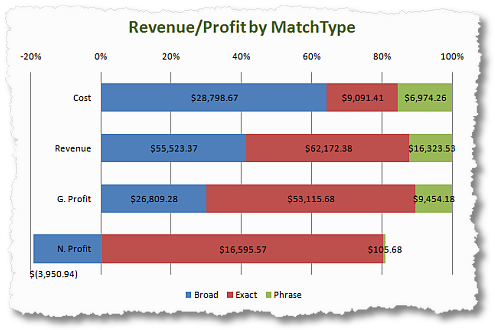
Niiiice?
For this specific client it turns out that every dollar spent on Broad Match is yielding a much lower return when compared to Phrase or Exact Match types.
Immediate work needs to be done on negative keyword expansions to further optimize spend.
Each company is unique, your picture might look like this. . . .
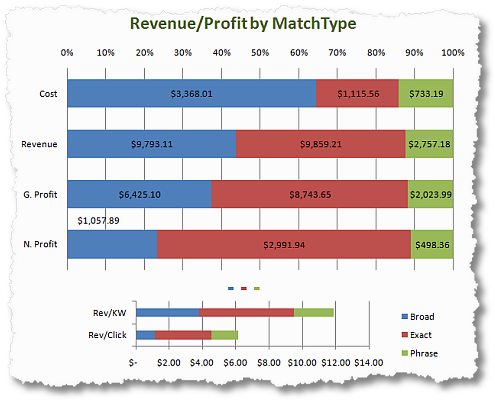
By focusing on Cost in addition to the four layers of Outcomes (revenue, gross profit, net profit) you are able to see a multi dimensional picture.
Digging deeper, as in the first part of recommendation #5, will help you then make changes to your match types and campaigns to optimally utilize the opportunity in front of you.
Happy?
Five sweet recommendations you can follow tomorrow, or today!
Paid Search has changed dramatically over the last few years. Yet we tend to report and analyze like we did during the days when hotmail was cool (!).
The stories we have shared today show that taking a different approach to the data already available gives you super awesome insights that lead to immediate cost savings / revenue improvements.
And it is not that hard is it? You need a bid management software like ClickEquations with built in advanced analytical capabilities, you need some awareness of AdWords / YSM / AdCenter and you are on your way.
Ok now your turn.
What do you think overall of this approach? Have you done any of the above five types of analyses? Got any other favorites that you would care to share? What do you use to do your Paid Search Campaigns analysis? Any tips or horror stories you want to share?
I would love to hear from you. Thanks.
PS:
Couple other related posts you might find interesting:



June 15th, 2009 at 03:30
Fantastic post!
I'm sure all Paid Search analysts will refer to it.
I'm very impressed by missed Clicks/Revenue and Revenue/Profit by MatchType analysis.
One of my other favourites is comparison between Organic and PPC for every phrases searched: it tells me when I pay for something (PPC) that I can have for free (Organic).
June 15th, 2009 at 04:45
Thanks Avinash for showing your loyal readers some of the cool stuff that ClickEquations Analyst can do. Readers should know that all of these reports are included, but they can be freely customized or any kind of new reports defined too. These just scratch the surface of what's possible!
Anyone who wants to learn more in general or about these specific ClickEquations Analyst reports can join our Free Webinar tomorrow (June 16 1pm EST). Sign-up here: http://bit.ly/F5j6g
We'll walk through each of the templates in this post in detail and answer questions.
(We do these every other Tuesday if you read this too late. Visit http://www.clickequations.com/webinars for details)
June 15th, 2009 at 05:50
Hi Avinash,
I love reading your posts, you give amazing examples to explain things.
I have started working on web trends recently and have worked on Google analytics in past. I was searching basic knowledge about web trends,, can you suggest me some thing or any of your post where basics of web trends have been defined. basics like how to set up web trends, what code we can use, how to check whether site has web trends tracking installed or not etc…..
i'll appreciate your help in this matter.
Regards,
Ruchira
June 15th, 2009 at 06:05
Hey – What's wrong with Hotmail! It's still cool…right? :)
Just a quick comment to another really great post that exposes something like Click Equations to a wider / different audience (like me, who's never used it!). MSN AdCenter has in my experience always provided good quality visitors who convert at a high rate, and whose average order value is usually the highest in comparison to the other engines' AOV. The problem is that there is just SO little volume there, that it's very very tough to spend more there and find ways to spend – it's like it's capped out at what you can spend…maybe this has changed in very recent times but it has always been a big challenge to find ways to spend more in MSN AdCenter. So Avinash your fourth image (Conversions by Engine Report) is a report that we have at our agency for our PPC clients, and the picture is pretty much exactly like our picture – a lot of Google Conversions, a bit Yahoo conversions and only 1 or 2 in MSN (maybe Bing.com is going to help that out).
Sometimes it's also a monthly / quarterly budget thing. Google eats up a lot of it and we only have a few bucks left for the other guys, and it doesn't make sense to spend in a place that won't get as many conversions as Google will (and not even taking trying to explain a move like that to a client).
Can you talk a little bit more about the issue of volume – and maybe even a tip or two about what to do with limited funds / limited search inventory?
Thank You! :)
June 15th, 2009 at 06:25
Avinash,
What a cool tool and wonderful tips for SEM analyses! One thing that I struggle with is the share of shelf space concept.
You mention the 80/20 rule many times in your work. 80% of the benefit comes from 20% of the effort. Where does securing shelf space fall?
I suppose you'll say it depends on what your analysis shows. But if you're just starting with PPC, will your branded keywords be more effective or keywords related to your core product or services?
Especially as an acquisition technique, I just can't grasp how my branded keywords are a strong bang for my buck as opposed to the low-hanging fruit of my niche's keywords.
I'd love to hear your thoughts on this one. When do you start worrying about shelf space? And for that matter, how can you measure ROI on securing shelf space when it's very possible that your just cannabalizing your organic efforts?
PS I got an email from my most important HiPPO this weekend. He wants to talk and share ideas for our web strategy. Thanks for all the great advice!
June 15th, 2009 at 06:38
Another great post Avinash!
I also liked the Missed clicks & Revenue report. We can also calculate another actionable metric. Given the lost impression, conversion rate, impressions and CTR the question is how much I can increase CPC in order marginal profit to exceed marginal cost.
Missed clicks and Revenue can show you one side of the coin. However if you have an already optimized PPC campaign and you have to increase CPC to improve the impression share you must think first if the marginal cost will be less that your marginal profit. The other side of the coin is if it is worth spending more. Most companies choose to spend more, when the market is vey competitive we can test it and see the results.
I think Missed Revenue and ROI distribution are the most interesting reports.
Christos
June 15th, 2009 at 07:48
Love the analyses, all of them are terrific views of the data that all search marketers should be looking at. Only concern I might have is with #4, where you're prioritizing campaigns based on ROI. Clearly the branded and more specific product campaigns are going to have the best ROI, but does this mean campaigns should then instantly drop the longer-tail, more general keywords?
Maybe.
The question which should be asked is "how is the revenue being attributed?" Assume that a visitor searches and visits your site five times on five different keywords before converting. Let's assume that the first three visits are from general, longer-tail terms while the last two are branded.
In this scenario I would argue that at least *some* of the revenue credit should be awarded to the three nonbranded searches, as they potentially introduced your visitor to a site he or she never would have discovered otherwise. Without the unbranded searches the branded searches wouldn't have followed.
Likewise if you're a site that sells lawnmowers and you run both the keywords "lawnmower" and "John Deere LX176 Riding Mower". You may find the latter, more specific term converts far better, but that's only because the visitors first found your site by searching on "lawnmower" and then later came back when they were ready to buy.
As long as you're able to properly attribute credit for the entire visit history of each visitor back to all the keywords (paid and natural) which drove the final conversion, then yes, the ROI-by-campaign or ROI-by-keyword analysis makes sense. If, however, you're still only using everything-goes-to-the-last-click attribution, you should be very careful when doing this analysis lest you refuse to build a driveway to make for a bigger garage.
June 15th, 2009 at 07:48
It's a shame that Click Equations isn't available for less than $1,000 per month. Does it work across multiple MCC levels, as we have stacked accounts?
June 15th, 2009 at 07:58
A great reference for those looking for guidance in Search/PPC analytics. Love your illustrations and 'how-to's on making your search more effective.
Once again – a great post.
June 15th, 2009 at 09:10
Excellent and timely post!
June 15th, 2009 at 09:54
Hey Charlie,
First a disclosure: I'm the Marketing Manager at ClickEquations and an Avinash groupie.
Your dead-on about attribution. ClickEquations supports 4 types of attribution: first click, last click, linear and weighted. We calculate all 4 simultaneously while retaining historical data and you can switch any time to see how your results would be different.
You can also see how keywords would get different credit under all 4 types side by side using ClickEquations Analyst, as we discussed here: http://www.clickequations.com/blog/2009/05/revenue-allocation-attribution-models-in-clickequations/
We're of the opinion that different companies have different attribution needs and our tool should accomodate that. Personally, I favor linear or weighted.
I'd love to hear your thoughts: acohen@clickequations.com
Cheers,
-Alex
June 15th, 2009 at 11:22
Anthony – Yes we can support multiple accounts across MCCs, and you can roll-up your spend to hit or surpass our minimum fees. Please email and we can discuss your specific situation – info-at-clickequations.com
June 15th, 2009 at 11:36
Great new tool!
Looks like they have done a great job in bringing adwords data up front.
June 15th, 2009 at 15:23
Avinash:
Very interesting concepts.
I'd like to offer an alternate theory here…
I won't suggest that "research can be a waste of time," but I'm hinting at that… Controversial, maybe, but predictions and forecasting *take a lot of time*, are usually grounded in guesses/estimates, and often cloud your mind and can keep you from *implementation.*
Just like in "landing page testing" – there are best practices, but every combination of site/ad/keyword is different… you have to test to know. "Test, test, test."
I'd make the simple recommendation that thoughtful SEM planning/testing/optimization will drive more value than "laboratory speculation" about results. Planning allows you to capture whatever comes in and optimize that process. Predicting – about share of voice or anything else – sets expectations that are often not tied to the actual performance of your site, your ads, your offers, your KWs.
Cheers – and thanks!
[G
(Avinash – I'm on page 75 of your book, and loving it… learning a lot… very good use of my time! Thank you again!)
June 15th, 2009 at 16:26
Great post. Interesting insight into Match Type Analysis. Good to think about your "share of the shelf" in paid and organic as well to identify potential oportunities.
June 15th, 2009 at 22:52
Joe: In the scenario you describe for me I start with kw (or search engine) where conversions are the sweetest. That will be my first priority in terms of maxing out volume (even if small).
So if it is bing then bing goes first and I get all the 200 people I can get there. Then goes Google to capture its 1,000 and then Yahoo to get its 12,000.
It does require some pretty deft bidding and budgeting but you have to maximize against Outcomes and not which search engine is popular or will get most clicks.
Jlbraaten: It is no different in terms of what you want for your listing on any search engine.
If you don't show up, it does not mean the customers stop looking for "shampoo".
Once you show up, you use analytics to determine if you are getting value for that listing. If yes, do more. If no, stop.
In terms of Brand keywords it is a complex issue I'll never do justice in a comment. But it depends on the life cycle of customer consideration cycle and using the right metric. Here is a post that goes deeper into that:
Paid Search Analytics: Measuring Value of “Upper Funnel” Keywords
Hope this helps a bit.
Christos: You are right. There will be a natural point at which you'll reach diminishing margins of return. The 30% gap in the report might indicate there is some ways to go before you reach it :), but the heavy stress in this post on Outcomes hopefully help you find that point efficiently.
Charlie: For my perspective on branded / long tail terms please see the link above.
With regards to attribution. . . .
I believe that pretty much all tools, Omniture, Google Analytics, Xiti etc, have the ability to do first or last click attribution. I don't think either is perfect. Linear or weighted come with their own set of challenges (just consider for a second the marketing thinking that is going behind each).
I think there are new methodologies, as yet not main stream, that will solve the core answer required. Until then I think we will muddle along. Use what you have access to. :)
Ruchira: You should reach out to WebTrends directly, for the price they charge they also include support and professional services directly from WebTrends. I am positive they will be able to help you.
They also have a very nice blog that might be of help: http://blog.webtrends.com/
-Avinash.
June 15th, 2009 at 22:55
Guy: You almost had me. Then not!
I concur with you that it is incredibly hard to forecast these things out. The web is a terrible at that.
But in this case there is no forecasting. Ok, maybe a little.
Here's what's happening.
100 user queries were done.
50 times you showed up.
10 clicks from those impressions.
2 conversions from those clicks/visits.
50% share of shelf. Possibility of showing up another 50 times for actual user searches. Hold the click-thrus and conversions constant. Computed missed opportunity.
Not too much forecasting right? Simply computing what was actually missed.
Now it is possible there won't be another 100 queries.
It is possible you have to pay more to get the other 50.
It is possible you have to improve your copy / ad / landing pages, at a cost.
They play a role. But your data is sound? Maybe you can't get all the other 50 impressions (and hence all 10 clicks and two more conversions) but maybe you'll get 40?
In this specific case, just in this case, I would push back that this is not laboratory speculation.
Planning you do before. I am asking you to do a postmortem, use that to make changes and mop up conversions. : )
-Avinash.
June 16th, 2009 at 05:02
[...] PPC / SEM Analytics: 5 Actionable Tips To Improve ROI (Occam's Razor by Avinash Kaushik) [...]
June 16th, 2009 at 10:29
Great post and insight as usual. Always enjoy reading your blog and always learn something.
Is the report "match types by keywords and revenue in Google" correct? (ex. broad match cost $55,523.37 and revenue $1104.00)
June 16th, 2009 at 11:31
[...]
I just came across a post by one of the leading thinkers in the Analytic World, Avinash Kaushik. The post was on his blog Occam's Razor and is an excellent summary one should focus on for PPC and Organic Search ROI improvement.
ppc-sem-analytics-5-actionable-tips-improve-roi
[...]
June 16th, 2009 at 17:49
Howard: Good catch. The report was incorrect due to operator error!
Conversions and Revenue were showing the same number. I have fixed the report in the post now.
For the sake of posterity (and also to ensure people will understand your comment) here's the wrong version:
Thanks for letting me know.
-Avinash.
June 17th, 2009 at 02:56
Hi Avinash,
Another great post, thanks. Have been following your blog since i began getting involved with online marketting at my work Your post have been indispensible when it coems to working out where to start attacking the mammoth beast of web analysis.
Have just bought your book and was pleasantly surpirsed to see that you donate some of the profits to MSF / Doctors Without Borders.
I work for MSF UK and so you are helping us not only with donations but also great advice!
Cheers
Sam
June 17th, 2009 at 11:35
[...] PPC / SEM Analytics: 5 Actionable Tips To Improve ROI – Avinash Kaushik [...]
June 17th, 2009 at 14:10
Hi Avinash, another well written and unique post. Your first point is great, there is a huge difference in how visitors from various search engines interact with your site, and what keywords and phrases your site ranks high for on different search engines.
It's a mistake to benchmark all your efforts against say, Google alone, when there are still over 25% of traffic generated by other search engines.
The different behavior from search engines really comes down to the type of user searching. Different search engines have different demographics which affects their interaction.
People are also missing out if they only optimize for Google, because getting ranked highly in Yahoo and MSN can also pay dividends. I'm happy to see Bing has come out, and appears pretty good (unlike cuil), it should strengthen the competitiveness of the search engine market.
I also like your advice on focusing on what's changed. As we all know, you can analyze the hordes of data coming out of these tools forever, and only cause more and more confusion.
By looking at trends, and what's changed, it brings the breadth of analysis down to a manageable level. Web analytics data is not absolute, it is all relative, and as a result I think so should the analysis.
I know you've talked about it before, but I think an A/B testing tool like Google Website Optimizer is a GREAT way of taking this a step further. Once you have identified what's changed and why, TEST out the hypothesis using an A/B testing tool. After all, we're trying to come up with actions to drive the business forward, not just summarize what happened.
Regards,
Omar
June 20th, 2009 at 02:38
So are you arguing that the "out of the box" analytics reporting capabilities in clickequations are superior to its competitors?
Or do all the bid management systems offer something similar?
June 20th, 2009 at 08:22
Eric: This post used ClickEquations to illustrate examples of the most insightful paid search analysis you can perform.
But there was no overt or covert implication that ClickEquations is better than others or not.
ClickEquations is a part of two other tools that are generally called "third generation bid management and analytics platforms". The analytics you get with CQ are probably industry leading. This post though is an unfair place to illustrate that as it is not a features review (in fact the coolest part of their platform, the bid management algorithms and multivariate ad testing, I did not even cover!).
Hopefully in the post you have learned about the analytics part of paid search, and now you know what kinds of out of the box (and ad-hoc) capabilities to look for in any platform.
-Avinash.
June 22nd, 2009 at 07:42
[...]
In the post Avinash looks at five different advanced PPC analysis ideas, and provides his spin on why they’re important and how you can benefit from them.
[...]
June 23rd, 2009 at 07:53
[...]
PPC / SEM Analytics: 5 Actionable Tips To Improve ROI (via kaushik.net) – Long post, but some amazing actionable tips to improve your ROI.
[...]
June 23rd, 2009 at 15:13
Pretty good post. I just came across your site and wanted to say
that I have really enjoyed reading your blog posts. In any case
I'll be subscribing to your feed and I hope you post again soon!
June 24th, 2009 at 08:13
[...] "Have you checked out the data reporting behind the algorithm? What actionable insights does your ppc automation vendor provide you?" [...]
June 24th, 2009 at 08:38
Hi Avinash<
Great stuffs,very impressive,I had never seen anything like this.The statistics are very clear and easy to understand.
Thanks
David Koh
June 26th, 2009 at 06:30
There is a big fat underwater SEM iceberg and I'm just getting to grips with the visible parts. This is a(nother) great post, if a little scary, on how quickly subtle nuances in search results across different engines can influence ROI.
June 28th, 2009 at 19:40
[...]
Avinash Kaushik wrote a blog post in which he used ClickEquations Analyst to showcase a number of advanced analyses for paid search. Each of these used a report or dashboard which is provided to all ClickEquations customers.
In this and the next few posts we’ll dig a little deeper into these reports, sharing some background about how they were created, how they can be customized and used, and how they can help you to improve your paid search campaigns using ClickEquations.
Keywords By Engine
[...]
June 30th, 2009 at 08:26
[...]
La semana pasada estuve de reuniones, en una de ellas me encontré con un caso que considero importante compartir y tener en cuenta.
Es el efecto SearchWiki en el posicionamiento SEO, una entrevista con mi amigo, la definición del nuevo factor y mis sugerencias.
En los proyectos web existen 1000 tareas que realizar, pero sólo un 1% son efectivas en tu negocio online.
[...]
July 2nd, 2009 at 09:34
[...]
Last week in Occam’s Razor, Avinash Kaushik discussed our ‘What’s Changed’ reports, which make it easy to see which campaigns, ad groups, or keywords are doing better or worse than they were previously.
[...]
July 5th, 2009 at 21:39
I already read many tropics for similar PPC / SEM Analytics: 5 Actionable Tips To Improve ROI. But this is really unit=q and real in work place, So I would say that might be better one.
Thanks
JoomlaSoftware
July 6th, 2009 at 09:36
[...] PPC / SEM Analytics: 5 Actionable Tips To Improve ROI [Kaushik.net] [...]
July 7th, 2009 at 00:51
Great article, although almost too much info for one sitting. I am going to have to sleep on that and come back to reread it again tomorrow. I especially like the shampoo analogy. Thanks
July 9th, 2009 at 00:13
Thank you for your arcticle. I learn a lot from you.
July 10th, 2009 at 06:15
[...]
It’s a sad truth, but “most dashboards are on auto-delete” as our friend and Advisor Avinash Kaushik says.
Earlier this year, Craig had a chance to sit down with Avinash, Author of Web Analytics An Hour A Day, to get his tips for actionable paid search analysis and reporting.
Watch our first Paid Search Pros Video to learn:
[...]
July 15th, 2009 at 21:20
[...] PPC / SEM Analytics: 5 Actionable Tips To Improve ROI | Occam's Razor by Avinash Kaushik — 11:56am via [...]
July 18th, 2009 at 00:51
[...]
PPC / SEM Analytics: 5 Actionable Tips To Improve ROI — The title speaks for itself, but in this post, analytics pro Avinash Kaushik shares five “non-normal" analyses that you can apply to boost your ad revenue.
[...]
July 25th, 2009 at 20:35
I am struck dumb! Absolutely speechless at the insights you have provided. I am a beginner at all this, and it would take me a lifetime just to understand and apply all that is written in this one post.
Thanks Avinash!
July 26th, 2009 at 04:10
[...]
Mistake #1 – You Get Involved in SEO Drama
Be very wary of getting dragged into the trap. There are some SEOs who @ people all day long in lengthy back and forths. Every minute you spend chiming in and reading their banter is one less minute you spent on scouring delicious for links or digging though analytics to improve your ROI. Just can’t stay out of twitter SEO banter? DON’T follow people who get in public disagreements, and also install leechblock a great firefox plugin which you can limit your twitter, facebook, youtube, etc, time. It’ll cut off your access to those sites immediately.
[...]
August 4th, 2009 at 05:19
[...]
The third ClickEquations Analyst report featured in Avinash Kaushik’s recent blog post is our ROI Distribution report, which enables you to analyze the performance of your campaigns and ad groups against high and low boundary conditions that you set. This helps you to know what percentage of your campaigns are achieving targets or falling below minimum goals.
[...]
August 24th, 2009 at 17:25
[...] Craig Danuloff on August 24, 2009 The fifth ClickEquations report featured in Avinash Kaushik's recent blog post concerned the ability of ClickEquations to show actual search queries matched to each keyword. This [...]
September 2nd, 2009 at 19:52
[...]
Avanish Kaushik of Occams Razor and Web Analytics an Hour a Day has arguably the most comprehensive blog on analytics, metrics and ROI. Here are a few of the articles I have pulled and bookmarked:
Measuring your Success PPC / SEM Analytics: 5 Actionable Tips To Improve ROI
[...]
October 21st, 2009 at 23:41
How do you come about calculating N.Profit by match type?
October 23rd, 2009 at 20:32
Sai: By merging data from the online analytics system with data from the offline financial systems.
Avinash.
November 14th, 2009 at 10:08
[...] PPC / SEM Analytics: 5 Actionable Tips To Improve ROI – Occam’s Razor – Jun ‘09 [...]
November 21st, 2009 at 13:21
The ratio of broad match to exact match depends on the industry. Even a well maintained campaign can have a high % of broad matched terms because of the shear breadth of queries in that industry. E.g. e-commerce with a bunch of modifiers to describe a product like colors, sizes, styles, etc.
December 4th, 2009 at 07:01
[...] PPC / SEM Analytics: 5 Actionable Tips To Improve ROI – Occam’s Razor – Jun ‘09 [...]
February 1st, 2010 at 14:56
[...] PPC / SEM Analytics: 5 Actionable Tips To Improve ROI | Occam's Razor by Avinash Kaushik [...]
February 5th, 2010 at 09:23
[...]
Additionally, marketers can use multiple media in an ad campaign. As a result, it’s hard to attribute conversions directly to online search advertising.
Due to the sophistication of search algorithms, paid search is complex to begin with, and understanding analytics data is difficult as well. Kaushik has an excellent post on Occam’s Razor about conversion attribution that can give you a better understanding of your SEM campaign performance. He covers the following five points in this post:
[...]
April 26th, 2010 at 19:53
Absolutely a brilliant and comprehensive piece. Your graphics are awesome too. Really well done. I am a self-confessed SERPaholic so when I stumbled onto this post (ironically through a query 'search engine reports', then IMAGES, in Google). It's weird how people find you but I'm glad I found this piece. Cheers.
Garry
July 7th, 2010 at 16:30
[...]
It’s hard to improve what you don’t measure. Top PPC managers tend to have excellent analytics skills. It’s not just about crunching numbers, either. It’s about spotting profitable patterns that other people don’t see.
Recommended Analytics blog: Occam’s Razor
[...]
September 23rd, 2010 at 07:16
[...] losers..3. What’s Changed? As Search Engine Strategies New York keynote speaker Avinash Kaushik said:“While we obsess about our brand terms and our top ten key phrases the reality is that the long [...]
January 6th, 2011 at 00:17
Never used these Excel plugins, but they look great! Have developed my own set for my clients based on the older SEOMoz versions, but I'll give these a go.