 Make love? Direct Traffic? Really?
I am not kidding. Direct traffic contains visitors that proactively seek you out, everyone else you have to "beg" to show up on your site!
Yet this question seems to bedevil a lot of people:
What the heck is Direct Traffic?
As if that was not sad enough, even people who do know what the definition of Direct traffic is rarely focus on it or work hard to tease out the opportunity that exists in Direct traffic.
I love analyzing Direct traffic because it contains a valuable set of visitors who deserve more love than we currently give them.
I want you to be just as excited.
So let's look at the definition, to make sure we understand, at least on paper, what this traffic is supposed to be. We'll also look at the challenges that exist in ensuring we are looking at the real unpolluted Direct traffic.
Definition.
Here is the simplest and cleanest definition:
Direct traffic contains all Visits to your website where in people arrived at your site directly (by typing the url) or via a bookmark.
Direct traffic is hence not traffic that results from people clicking on links on other sites to your site (that's referring urls traffic), it is not traffic that comes to your site by clicking on ads (that's Other in Google Analytics or Campaigns in other tools), it is not people who come from search engines (that is Search or Organic or PPC traffic).
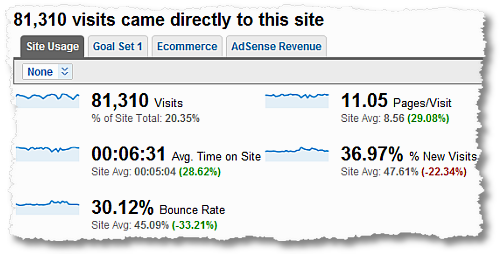
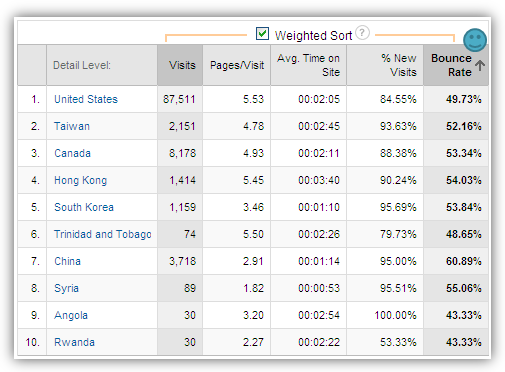
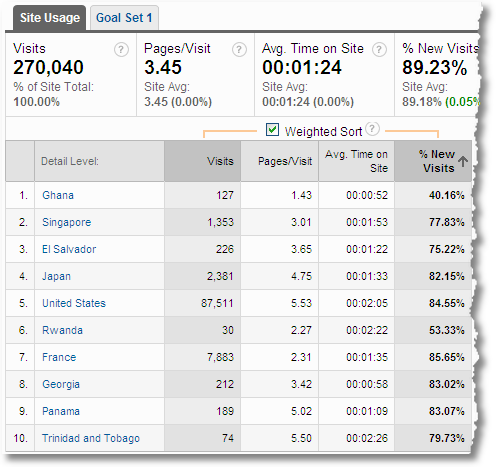
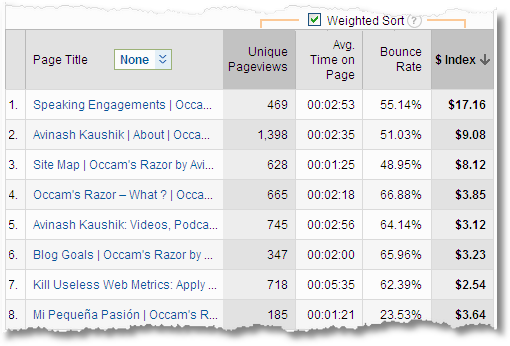
The reason Direct traffic is a beloved of mine is that it represents (checkout the sweet contextual – red and green – numbers above):
1. People who are your existing customers / past purchasers, they'll type url and come to the site or via bookmarks.
2. People familiar with your brand. They need a solution and your name pops up into their head and they type.
3. People driven by word of mouth. Someone recommends your business / solution to someone else and boom they show up at the site. Uninvited, but we love them!
4. People driven by your offline campaigns. Saw an ad on TV, heard one on radio, saw a billboard and were motivated enough to typed the url and show up.
[If you were really smart you would use campaign tagged vanity url so you can segment them!]
5. [Remember the part below, but.] Free, non-campaign, traffic.
In a nutshell these are people show up without invitation (email, display, social campaigns) or they are people who already know you. There is an extra motivation connected to their visit which causes them to type your url of find the bookmark they made.
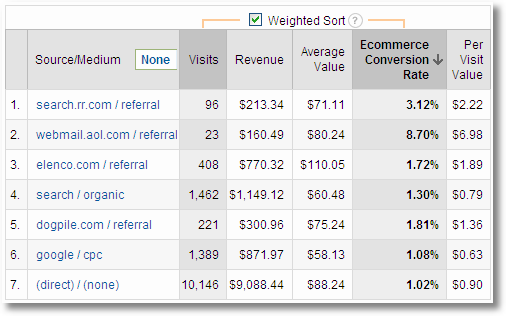
That little bit of extra intent, when compared to other visitor segments, is the reason that conversion numbers (on ecommerce or non-ecommerce sites) for clean direct traffic usually look like these. . . .
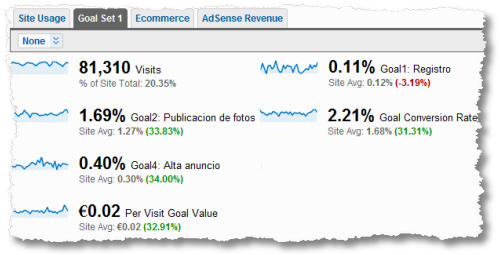 The only goal that is red is supposed to be red (fewer registrations from people who already know you is not unusual right?).
Now you'll agree when I say your job is to be extra sweet to them?
Segment them in your data, the delightful numbers you see in your KPI's will show you why.
So if Direct traffic is so important and often the metrics show very positive results then why don't we all obsess about it a lot more?

The Problem: Unfortunately. . . You!
Most website tag and campaign tracking implementations are poor (to put it charitably). This is always disappointing but it is particularly harmful to Direct traffic.
You see if you don't implement your links properly the person shows up to your site without any tracking parameters and thus fail to help your web analytics tool to put that visitor in the right source bucket.
Typically Direct traffic also contains all the Visits that originated from improperly tagged campaigns, untagged campaigns and problems with your JavaScript tag. I am sitting in a puddle of tears as I write this, that is how often Direct traffic is polluted and that is how painful (and profoundly sad) this is.
Here is a simple example:
You are the Acquisition manager for a company called Omniture.
You have purchased banner ads in various Android applications using AdMob to target high value analytics decision makers. You goal is to get people to buy your Discover data warehouse product.
You are using Google Analytics to track all you display campaigns.
The proper way to link your banner to your Discover2 website is:
omniture.com/discover2awesoemness/?utm_source=nytimes_mobile_homepage&utm_medium=masthead_banner
&utm_content=188_92&utm_campaign=affluent_readers
You actually use this url:
omniture.com/discover2awesoemness/
Guess where this category will be categorized?
Direct.
:(
You see mobile applications don't send a referrer and it will look like all of a sudden you got very high converting Direct traffic.
With a simple stone you've killed two beautiful birds:
> The direct traffic is polluted and you'll never be able to focus on finding real insights for actual valuable lovely people who are seeking you out directly.
> Google Analytics will show that your mobile campaigns with AdMob stink. Of course that's not true, but you'll have no way of knowing that.
Not a great situation right?
Oh and what do you think is happening to the trackability of all your shortened urls in Social Media that you are not tagging with campaign parameters? 78% of people consume Facebook and Twitter content via applications and unless you use campaign parameters all that traffic is sitting in Direct. So sad.
Result?
Direct traffic is a fantastic segment to analyze because it contains desirable Visitors and yet because it is often polluted (due to our own inability to implement web analytics tools correctly).
Let's aim to fix this because it is too important not to.

. Why Does Direct Traffic Get Polluted / Mistakes You Should Avoid:
The good and the bad are all mixed in, and it is your job to ensure that that is not happening inside your web analytics data.
Here are the main reasons traffic that should not be Direct ends up there, try, please please pretty please, to ensure this is not happening to you:
1. Missing web analytics tag from landing pages
Perhaps the most common source of traffic being miscategorized.
Your urls are all tagged correctly with campaign parameters, or maybe people are just coming to from sites that link to you.
They land on a page that is missing the web analytics tag.
They click on a link on the landing page to go deeper into the site.
Guess what's the traffic source for this traffic?
Direct.
So sad.
You worked so hard to get that referring link / execute the campaign. Now not only do you not get rewarded for that work. you actually messed up your direct traffic.
Don't be that person.
Go purchase WASP from iPerceptions or an account with ObservePoint and address the cheapest problem to fix in Web Analytics. If you are a little bit tech savvy then go get REL Software's Web Link Validator, it's pretty good.
2. Untagged campaigns (search, email, display, social media etc)
This is perhaps the second biggest reason data in web analytics ends up in wrong places.
In case of untagged emails (to people who are using Outlook, Thunderbird etc) and mobile ads and mobile application links (think of all those Twitter / Facebook apps) and Adobe AIR applications (like my beloved NY Times Reader) and in rare cases where people are clicking on links in PDF documents etc, the data ends up in Direct (no referrer).
In case of untagged display campaigns usually there is a referrer so it will end up there rather than in Campaigns were you want it.
In case of untagged paid search campaigns it usually ends up in organic search data.
On behalf of your company you are spending precious budget on acquisition, not ensuring your campaigns are tagged properly is near criminal behavior. Don't be that person. Tag.
Oh one more thing.. if you are practicing bigamy and have two tools, say Google Analytics and Adobe's Site Catalyst you better remember to have campaign parameters for both GA and SC because they use different parameters for campaigns. Whichever one you forget to tag for will show your campaign traffic as Direct!
If you want to track the campaign in the first part of this post with both Google Analytics AND Omniture the url would look like this, as an example:
omniture.com/discover2awesoemness/?utm_source=nytimes_mobile_homepage&utm_medium=masthead_banner
&utm_content=188_92&utm_campaign=affluent_readers
&s_scid=TC-10013-3159426121-e-361634984
See both set's of campaign parameters? You don't do that one of them is wrong. Not so shiny to practice bigamy is it?
3. Improperly tagged campaign parameters / site tags
- Excellent Analytics Tip: Unsuspected Correlations Are Sweet!
- Excellent Analytics Tip: The Adorable Site Abandonment Rate Metric
- Excellent Analytics Tip: Measure the Real Conversion Rate & "Opportunity Pie"?
- Seven Steps to Creating a Data Driven Decision Making Culture
- Analyze This: Five Rules For Awesome Impromptu Web Analysis
- Analysis Ninjas: Leverage Custom Reports For Better Insights!
This one is probably not that hard to understand.
Instead of utm_source and s_scid you use utm-source or s-scid and you are. how to say this politely. screwed.
In both cases your two (or one) web analytics tool will most likely ignore the improper parameters and throw the traffic where it does not belong and mess up your ROI analysis.
Auditing your campaign tracking before they go live is a great idea. Do this at the very minimum for the 20% of the campaign that are responsible for 80% of your traffic / revenue.
If you use Google Analytics grab the Google Analytics Tracking Code Debugger. See this blog post for troubleshooting guide & detailed instructions: Debug Your Tracking Code.
Omniture, WebTrends, CoreMetrics, Unica all come with such debuggers. I can't link to them as location are not public (or you need to pay first!). Please reach out to your Account Managers to get access, just in case you don't already have them. Debug!
[Update:]
Ben Gaines from Adobe/Omniture was kind enough to share that a free debugger is available to Omniture clients. Log into the Knowledge Base and look for KB ID 534 and you are set! But here's something cooler. The debugger is actually a bookmarklet and here it is:
Create a bookmark in your browser. Copy the code in the above text file. Click edit on your bookmark. Paste the code where the Link is. Go to any page on your site with Site Catalyst. Click on the bookmarklet and bathe in bugs! :)
[/Update]
4. Improperly coded redirects / vanity urls etc
Another silly issue that causes problems with direct traffic.
When you get a email or a mobile campaign, and keep a close eye on the url window, you'll notice the click goes to your campaign solution provider and is then redirected to your site.
That's one example of a redirect. We use redirects / vanity urls in our multi-channel campaigns, in our display or search campaigns or even just for the heck of it.
That is not an issue.
Make sure they are permanent, 301, redirects. The delicious type of redirects that dutifully pass the referrer string to the landing page telling your web analytics provider where the person originally came from.
You use temporary, 302, redirects and the referrer never gets passed on. Depending on how the redirect server is configured either the click looks like it came from the redirect server or with a blank referrer (direct!).
5. Really heavy tag at the bottom of the page (switch to Async!)
A smaller problem for normal sites with just text and some images, but a huge problem for fat ugly flash heavy websites (especially the, still annoying, ones with flash intros).
It takes such a long time to load the flash file itself that person might have clicked skip intro or some other link on the page well before the fat flash file loads or before the web analytics JavaScript tag loads.
The data tracking behavior is exactly as if issue #1 above existed, no tracking code on the landing page.
I would recommend putting the tag in the header, except that is the selfish lover strategy and no one likes a selfish lover.
Make your pages as lean as you can, especially campaign landing pages. Keep the tag in the footer, you don't want the page to hang because of issues at your analytics provider.
If you use Google Analytics you are in a little bit of luck. Switch to the magical GA Async Code. It goes in the header, captures data without ever hampering your page loading and as if that were not enough is leaner and meaner.
One of these days all web analytics vendors will migrate to the Asynchronous making the Internet a faster place to live in.
6. Corner cases causing traffic to end up in Direct.
Here are some reasons that don't happen a lot but you should be aware of:
~ Links encoded in JavaScript clicked in some browsers will send a null referrer (i.e put traffic into Direct). Often times you can't help his because you don't have control over people linking to you can do whatever they want. But do check that your campaigns in Facebook or Yahoo or other places are not using this method.
~ [Update, via Alec Cochrane:] https to http and vice a versa also won't have referrers passed due to (good) security reasons. So if possible make sure you put campaign tracking codes in links from https pages to ensure those visits don't end up in direct. For this you would have to know this is happening and then be able to find the person who will oblige you by changing the link. Tough to do but when you can do it!
~ Some smart folks will make changes to their browser configurations that cause referrers not to be passed. Happens in a tiny minority of cases.
~ This might impact only some tools but check with your vendor how this scenario is credited. . .
First visit: From a campaign (search, referring url, social, display, whatever).
Second visit: Direct to the site.
If you are using Google Analytics then that second visit will still be "credited" to the campaign (non-direct) because the _utmz cookie will be present in the browser.
In your web analytics tool that might not be the cause. Please check with your vendor.
~ Multi-domain / sub-domain "unique" web analytics implementations across many websites. With any tool these are really hard to do right, and really easy to do wrong. If you have one of these polka dotted puppies then get your expensive Consultant to triple check the code and cookie customizations with a special eye on Direct traffic.
~ [Update, via Pritesh Patel:] You could also have polluted Direct traffic if your entire company (hopefully of a good size!) has their home pages in browsers set as your company's website. This will clearly skew your direct traffic (and your bounce rates, after all they don't actually care about your site :)). You can easily use your tools admin settings to filter out all your internal IP's which would solve this issue.
~ [Update, via Deric Loh:] #1. iFrame: Whenever someone links to your site via an iFrame it is possible for them to code it in such a way that it does not pass referral data and the visit will look like Direct. We can do much about this but in case there are sources where you can avoid this issue or get it done properly then it is worth the effort.
#2. Company Gateways: Some companies might have a security gateway which has been set up to strip the referrers from request calls. This of course is not great for your clean Direct traffic. It won't happen a lot of times and then limited to just one source. But it is something you certainly should be aware of as a cause.
That's it. Six simple problems for you to take care of. : )
All kidding aside know that you'll accomplish a major clean-up if you address the first three issues and then YMMV.
Also know that it is totally worth it to get this data clean, the orange line below is Direct traffic conversion rate and the blue is overall conversion rate. . . .

Not bad eh?
You want to know who these people are.
You want to know what you can learn from analyzing their geographic locations.
You want to know their Visitor Loyalty and Visitor Recency profiles.
You want to know what content they are consuming.
You want to know what products they are purchasing.
You want to know what the differences between their behavior on your site is from your other campaign traffic.
You want to know if any of the spikes are correlated to you offline campaigns or catalogs you have sent out (and then establish causality between offline campaign calls to action and behavior by these people).
You want to establish the value of these visitors and then pay special attention to them if they are of value to you.
For the New York Times website I'll always be Direct traffic. I use a bookmark, I go to the site at least once a day, I click on Ads (I have nytimes.com on my adblock white-list!), I subscribe to the Times Reader, I am a big evangelist of their brand.
But only if they care to ensure their Direct traffic is clean, and then analyze that traffic will they ever know that.
If they are like every other company that obsesses with PPC and Yahoo! Banners and Facebook Display ads and Email campaigns etc etc then they'll never know that some of their best customers they should make happy are right under their nose.
I know that the NY Times web analysis team is super sharp. Are you?
In the small chance that you were not before I hope I have convinced you to truly bring the "make love" type of passion to this valuable, and usually large, segment of traffic to your site.
Good luck!
UPDATE: A clarification specific to Google Analytics:
Every tool uses delightful sets of attribution rules when it comes to assigning visits or conversion to campaigns. To share with you how Google Analytics will attribute these things here are a couple of scenarios….
Scenario 1:
Visit 1: Came from SEO click on keyword "ASOS Fashion"
A few days later…
Visit 2: Came direct to the website
In Google Analytics you will see this in your reports:
Keyword "ASOS Fashion": Visits: 2
Direct: Visits: 0
In effect Google Analytics will "understate" direct visits. It is difficult to have a perfect scenario here, some people will vehemently make the case that GA is doing it right and that the Visit did come via the organic click first so second visit should be attributed to it. I am personally in the camp that that is sub-optimal and that because we can't read too much into anything (we just don't know what is influencing what) we should report keyword visits = 1 and direct visits =1. But at least you know what GA is reporting.
Scenario 2:
Visit 1: Direct to the site.
Visit 2: Came from Affiliate Campaign click.
Visit 3: Came direct to the site.
In GA it will show:
Direct: Visits: 1
Affiliate Campaign: Visits: 2
See how that works? Regardless of how you think it should be you now know how it is. : ) Make sure you keep this in mind as you analyze the GA reports.
[My heartfelt thanks to David Williams for his help with a test for above cases.]
This stuff is complicated right? Remember none of this takes anything away from the importance of direct traffic or how hard you have to work to make sure your reporting of it is clean (tips above) or that it is worth focusing on. Whatever tool you have, do all of the above!
Ok your turn now.
Do you obsess about Direct traffic just as much as I do? What insights have you found from you analysis? What methods have you deployed to ensure that your Direct traffic segment is as clean as possible? Do you also look at any "Direct" traffic to really long complicated url's on your site and instantly doubt that could be direct?
Please share your experience / feedback / tips / critique via comments.
Thanks.
PS:
Couple other related posts you might find interesting:

 Arthur C. Clarke said:



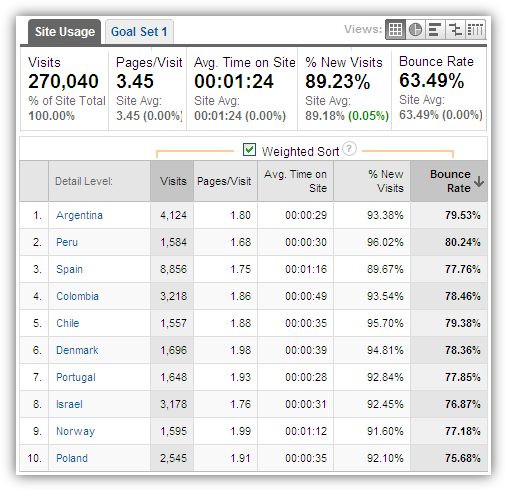 Sorted by "interestingness"!