Six Web Metrics / Key Performance Indicators To Die For
 The term KPI is one that I hear far more than any other in this nascent field we call Web Analytics. Key Performance Indicators!
This is a KPI and that is a KPI and "you don't have a KPI, oh my!" and "look at my KPI it is awesomer than yours!" and. . . . well you've been there. You can empathize.
Simple talk in this blog post:
Highlight a definition. Give you five KPI's that I like, ones that I think, IMHO, live up to the moniker KPI. Explain why, hopefully you'll have rules you can apply and check if your Web Metrics are indeed KPI's!
Oh and at the end a summary of eight rules you should follow, and if you do you'll charm the pants off your Key Decision Makers! : )
Let's go.
What's a Key Performance Indicator?
Let's check the big gorilla: Key Performance Indicators (KPI) are financial and non-financial metrics used to help an organization define and measure progress toward organizational goals. [Wikipedia of course!]
Ain't that wonderful?
Never the one to let sleeping dogs lie, I wanted to simplify the definition a bit more. So here's my definition, a bit more simple, a bit more English, a bit less jargon. . . .
Measures that help you understand how you are doing against your objectives.
In my mind it is as simple as that. KPI's are measures. Their entire purpose in life is to highlight success, or failures, for the objectives you have created for your organization.

Far too often we slap KPI on any web metric without pausing to think what our business is solving for. Hence my stress on the bookends of that definition. Measures – Objectives.
If you are impressed with the number of web metrics you are reporting (or your web analytics tool is spewing out) and yet utterly frustrated that you can't find actionable insights then your culprit without a doubt is an insufficient understanding of business objectives.
Do that.
Examples of Awesome Key Performance Indicators.
Before you get too deep a couple of thoughts.
I am not going to mention first-to-mind "KPI's" like Visitors and Time on Page etc because I really think they are terrible places to start – even if they are most easy to access.
 They are terrible because it is really hard to go to your Senior Management (people who are funding your salaries and budgets and campaigns) and start by telling them you acquired traffic. Recalling the stress on Objectives above, I'll try to start with Outcomes (see Trinity Strategy).
None of these Metrics (which are great KPI's) is a shocker, I would love for you to focus on why the choices were made – it is my hope that that will help you with ideas of your own to identify awesome KPI's for yourself.
On that last note, it is important to remember that what works for Jane might not work for June. If anyone tells you that they give you a list of KPI's and that's all you need then they are misleading you. Even if you and I are in the same sector (ecommerce) or the same business (social networking) it is important to know that we will usually drive different objectives, and hence different KPI's.
This post is a bit heavy on ecommerce, my apologies for that, purely a function of time pressures, had to write this week.
With that out of the way. . . .
#1: Conversion Rate.
Bet that surprised you!
After all I am constantly telling people to stop obsessing about conversion rate. : )
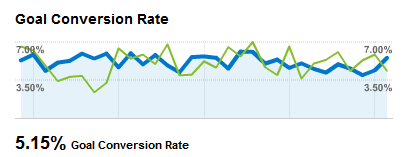
Why is Conversion Rate a great KPI?
When all is said and done Conversion Rate is a great place to start because of two reasons:
1] You are hard core focusing on Outcomes, that's pretty serious.
2] You are going to force the conversation about Objectives, without that you don't have conversion rate!
It is simple, it is effective and it will start you off on the right side with your boss. Have the tough conversation about why the site exists (and don't directly pop open CoreMetrics or GA and start impressing people with data).
(Tips +) What should you be careful about?
Remember that the average website conversion rate usually is around 2%. So this is the fastest way to the heart of why your website mostly exists, but there is a lot more you should plan on worrying about in the future.
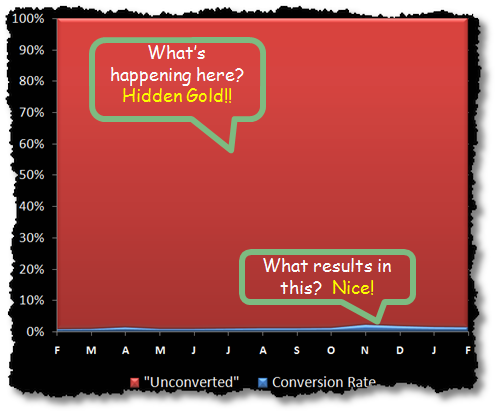
The most fun is in identifying that happens to the 98% that don't convert.
[More tips at: Is Conversion Rate Enough? It’s A Good Start, Now Do More!]
Most of the time Conversion Rate is indeed thought of in terms of ecommerce websites. But increasingly tools are making it ever more easy for you to track conversions of any kind. Form submissions (leads). Trial signups. Content consumption. Download Software. View support FAQ. And more. No matter what your website, you can start measuring "conversion rate".
[More tips at: Measure Macro AND Micro Conversions.]
#2: Average Order Value.
One of the problems with a obsession with conversion rate (no, no, no, I am not talking about you, you'll never obsess!) is that it can hide a lot of interesting things.
That's why I used Average Order Value (or for Mel and Ian: Average Basket Size :)).
Why is Average Order Value a great KPI?
Conversion Rate could be through the roof and yet revenue could be down, your first clues for this will be in understand AOV.
Vice versa conversion rate could be down but if you have done a good job of acquisition (relevant traffic) then AOV will save your butt when your boss yells at you ("Please Mr. Brent stop freaking out, look the average basket size went up 75%!")
For most companies there is a lot of effort spent in the area of onsite merchandizing (working on cross-sells and up-sells and what not). Awesomeness of all that work can be detected in by measuring AOV. That makes it a very good measure of success for site effectiveness.
(Tips +) What should you be careful about?
By itself the Average Order Value will not be most productive as a KPI. Always seek context, as in the picture below.

Better still compare time periods (this month and last etc) and you'll get even more.
Where AOV will shine is when you'll click on those links under orange stars. Which campaigns are higher AOV and which are the losers. Ditto for traffic sources / keywords.
Another awesome analysis is "basket analysis". Which products go with that. What promotions work with what products. What recommended items work and which don't. Now you are getting into the "bonus credit" section, but then again you are a Overachiever so go for it!!
#3: Days & Visits To "Purchase".
I love this metric, or these two sexy metrics twins. [Hmmmm. . . . twins. . . . :)]
Most web analytics is single session focused (Visits, Average Time on Site, whatever else you can think of). Most Marketers treat Visitors (you and me) on their site like one night stands. Come, night cap buy, bye.
Life rarely is about one night stands. People don't behave that way. We like to take our time.
Hence I am a fan of metrics (and KPI's) that force us to do pan-session analysis.
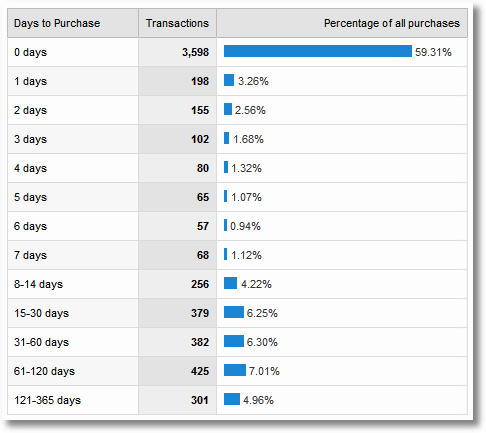
This picture is from my book Web Analytics: An Hour A Day. . . .
Why is Days & Visits to Purchase a great KPI?
They measure the true customer behavior on your website, how long it takes someone to complete an Outcome on your website.
They can be deeply insightful in terms of perfecting the marketing messaging on your website.
Help you measure success correctly. Many users simply measure conversion in the same session as success. But if multiple sessions lead to conversions you might not be attributing right campaign / acquisition drivers. Measuring Days & Visits to Purchase is a great way to start that process.
It is available in pretty much all the tools. Also did you note the quotes I have on "Purchase"? That's because this can be a non ecommerce metric. "Purchase" can be any outcome if you are a non-ecommerce website. So awesome!
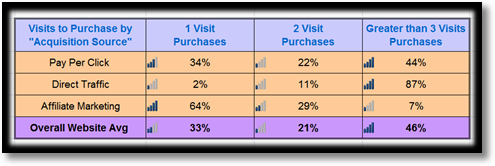
Justin has a post on exactly how to track any kind of outcome in this report using GA: Google Analytics E-Commerce Tracking Pt. 3: Why EVERYONE Should Use It.
Perhaps we can request Adam to whip up a quick post and tell us how to access and use this report in Omniture (where it surely exists) for non-ecommerce purposes.
(Tips +) What should you be careful about?
I think I have said this three different ways above, but the max power of this report can be achieved with segmentation.
In the above screenshot I have segmented Pay Per Click, Direct and Affiliate Marketing (my core acquisition strategies) and customers who originally come from each of those channels show a dramatically different propensity to "convert" (remember conversion can be non-ecommerce).
Do this, you will love it!
Also for this metric more than any other it is important to look at distribution and not averages (they lie!).
Finally, when you start to apply segmentation etc be prepared for some tough work – you are crunching a lot of data over a lot of time. Use data sampling if you have to. Remember the reward is well worth it.
#4: Visitor Loyalty & Visitor Recency.
Guess why I like these two?
Yes! Pan session analysis again!!
You have a social networking application. You own Twitter. You are creating the next YouTube killer. You are building a engaging website that will change the life of your University students. You are. . . . well other things like that.
How do you measure success?
Two possibly lovely Key Performance Indicators for you are ones that allow you to measure if people visit your site repeatedly AND if they do it more frequently.
Sounds good?
Meet Mr. Loyalty and Ms. Recency!
This view is from the wonderful Microsoft AdCenter Analytics tool. . . .
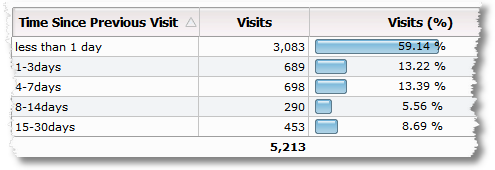
Why is Visitor Loyalty and Recency a great KPI?
Great KPI's for non-ecommerce website. Everyone who wants people to visit their site again and again.
Next time someone wants you to measure the impact of "branding which creates a engaging experience" – throw this at them. Watch them weep (or jump for joy :)).
It usually impresses your boss to know that you can measure things like Loyalty, try it and email me if they don't give you a kiss. They will!
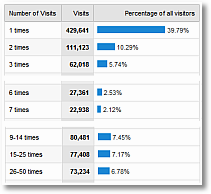 Loyalty can also be a great way to understand effectiveness of marketing campaigns – deep analysis to know if you are driving behavior beyond the sign up (do people come back and "friend" others or just "nudge" or "super poke" :)).
(Tips +) What should you be careful about?
One thing to be very careful of for reporting Visitor Recency. Most web analytics tools will automatically put New Visitors into those counts. These New Visitors will show up in "less one day" or "0 days ago" bucket. That's wrong. So be sure to filter out New Visitors.
Only look at distributions (look at that screenshot on the right, amazing, just as many people visited the site just one as did between 9 and 50 times a month!).
Segment out "most recent" visitors and "most loyal" visitors from those that are not. Gold awaits you, actionable gold!
#5: Task Completion Rate.
This would not be the home of Web Analytics 2.0 with a mention of VOC? No sirrie bob!
My one metric on a desert island, if allowed to choose from Web Analytics 2.0, would be Task Completion Rate.
It is measured using Surveys, in session interrupted or via on exit surveys (like the free 4Q). It is essentially a reply to the question "were you able to complete your task" – whatever the customer came to the site for.
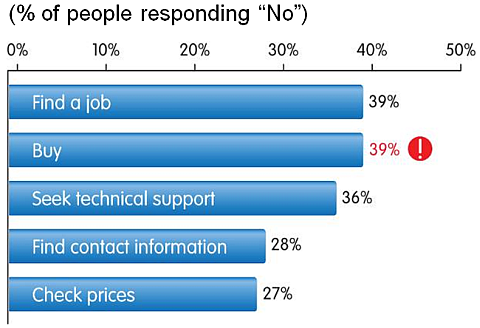
Why is Task Completion Rate a great KPI?
Only 2% of your website visitors (for most websites) will ever convert on your website. How do you know why the other 98% visited your site and find ways in which your site is letting them down.
Most people who visit your website are there for purposes you did not create it, this is how you find out.
Web Analytics tools will only tell you what content I wanted if the content was there (by reporting page views to you). But how would you know what content I wanted that you did not have? This is how.
Company employees bitch and moan and complain about how much their websites stink. Then they make changes to stop the bitching an moaning. Stunningly, to them, none of the KPI's improve. Guess what? They made changes they wanted to make, not ones that the customers wanted them to make.
Get Task Completion Rate (using any survey instrument you want, using any usability study you want). But get it. Or go home.
(Tips +) What should you be careful about?
This goes with all surveys: Ensure you are sampling enough visitors (and get atleast 300 responses a month for a aggregate measure and 1200 responses a month for a segmented view).
Surveys data, like Web Analytics data, can't live in a silo. Correlate the two sets of data and validate one against the other, always a best practice.
#6: Share of Search.
No matter how desperately you desire it, your competitors won't roll over and play dead. So you have to compete.
The web is the most frictionless environment in the universe and you compete the the fortune 500 company, you compete with the SMB and you compete with your neighbour's dog who has started his own facebook clone.
A key measure of success is how you are doing against your competition as as much you should have Key Performance Indicators that show how you are doing in the web ecosystem.
One KPI that I am quite fond of is measuring Share of Search, it is inspired from the traditional supermarket metric "share of shelf". Google, Microsoft, Yahoo are the virtual "supermarket" now given how much they influence users. So measure Share of Search.
For example I am using Compete to measure how much "share of shelf" I have for diapers (and I am pampers). . . .
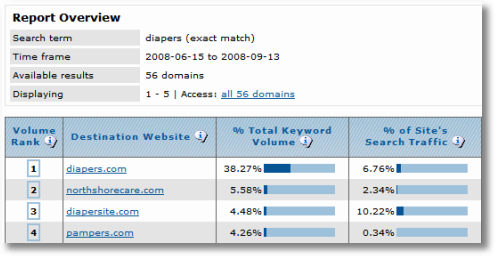
Clearly not enough!
Of course trends are better, how am I, Cingular (old name), doing against Verizon, when it comes to % of traffic from www.google.com? Here's Hitwise. . .
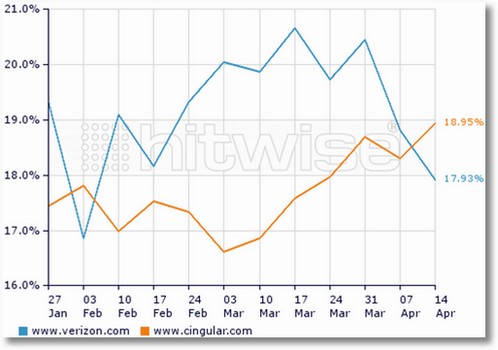
If indeed they were using Share of Search as a Key Performance Indicator at one company the Search Marketer is going to get fired and at the other She is getting a bonus. : )
Why is Share of Search a great KPI?
It gives you external validation of your success (or lack thereof).
It also stops you from being blind sided.
For example, using a example from our Google Insights for Search post, Lenovo's web analytics tool could be showing a nice 3% increase in traffic from the keyword "Thinkpad" to www.Lenovo.com. But what might be completely hidden is that Thinkpad as a search query has been gradually declining over the last four years (Lenovo could just be getting more visits from the reduced traffic at the search engine because their competitors have become more incompetent).
For traditional Marketers this is a KPI that they can wrap their heads around (so if you are in a big company or a traditional retail business then listen up!).
It is a great metric to start teaching your senior management the value of Competitive Intelligence data.
(Tips +) What should you be careful about?
For heaven's sake please do not compare the number to the web analytics tools on your site. Let me give you the punch line, they don't tie. And its ok.
Pick the methodology with the largest sample size, with the least amount of sample bias and one that does not still use a method developed to measure TV ratings. Yes I am biased.
Hurray, we are done!!! Here are the rules I promised. . . .
The Eight Avinash Rules for Entering KPI Heaven:
#1: Start simple, start direct, and please start with Outcomes!
#2: Leverage metrics that identify success for areas where you spend the largest efforts.
#3: Wean your Marketers off the "one night stand" mentality, do pan session analysis.
#4: If you can't segment a Key Performance Indicator, you have picked the wrong one.
#5: Even "brand" and "site usage" can be measured, Loyalty rocks!
#6: If your short list of KPI's don't include a couple that report customer voice directly then you will Never be as successful as you should be.
#7: Using KPI's that can tie back to the "old world" and "traditional metrics" and help you bring people to the current age.
#8: Not using Competitive Intelligence KPI's can be considered a crime against humanity!
I wish you all the very best!!
As always its your turn now.
What is your absolutely favorite Key Performance Indicator? Which one was the one that most over promised and under delivered? Have you used any of the above? Love 'em? Hate 'em? Do you have a rule of your own that you tend to follow?
Please share your feedback, ideas, and critique.
Thanks.





September 16th, 2008 at 05:39
Good refresher, Avinash. I agree that KPIs are used too synonymously with other terms and boiling it down to the simple statement "Measures that help you understand how you are doing against your objectives" is helpful.
I am sure this is elementary, but I run into the issue of conversion being too binary as well (hence the need to look at AOV), and as a result I like to combine them into Sales per Session (SPS). That way I am seeing the average value of the sessions to my site. I end up with a metric that folds value into conversion. Again, no big revelation as most if not all analytics packages include the sales/session metric. But it's a way to quickly monitor the value of sessions (Why is SPS down this week? Oh, right, we mailed a sale e-mail which pushed conversion up and dropped AOV down…" at a given time which can be drilled into when necessary through AOV and conversion analysis.
Just a thought to add. Thanks again.
Patrick
September 16th, 2008 at 05:41
Hey AK, great post as always! (I know people hate comments that start like this but oh well :)
It's funny that you ask what our favorite KPI is – It's ~8:30AM EST right now. At 9:00 AM, it could be something else. Tomorrow I could give you a great explanation for a third favorite KPI, and over the weekend as I'm running or riding the stationary bike at the gym I could give you something else entirely! It depends on what mood I am in, but it also depends on the situation (client) that I am working on.
Recently, I've been into Conversion Rate and Revenue from Site Search. I'm a pretty big believer that everyone should have a smooth, great working search function on their website that produces fast, relevant results. I've seen for most of our clients that 15-20% of website visitors use a site's internal search function – that's 1 out of every 5 people that is going to be exposed to your search function, and 1 out of every 5 people isn't a mere drop in the bucket.
Not necessarily a KPI per definition, but % Search Exits is a biggie for me, too. This to me is basically Bounce Rate of your search results page. I would "take a leap of faith" :) and say that the lower this figure, the better your search function is performing – and the higher chance those 1 out of 5 site search users will convert. So maybe instead of the acronym KPI we can call % Search Exits a SPI (Search Performance Indicator).
As far as your five KPIs, I like and have used and abused them all. I don't have any personal rules or anything like that when it comes to KPIs that I follow, but I do want to say that any Goal (Task Completion) should have some kind of value attached to it – even if it's not Ecommerce. It just makes life so much easier to attach a numerical value to something.
Thanks again!
September 16th, 2008 at 06:34
[...] Page views, visits, uniques, bounce rate, etc. These are all good statistics to help you understand how your website is performing. However, more importantly is measuring how your website is obtaining your business goals. To do this you first need to come up with goals for your site. Occam’s Razor has a good post on key performance indicators (KPIs) to help measure the success of your website in terms of your business goals. [...]
September 16th, 2008 at 08:33
Hi Avinash,
your posts, videos,…book has been a great deal of knowledge for me.
I have a non-ecommerce site which I really love for its potentials. I personally find "Visitor Loyalty and Visitor Recency" the best for my site.
What would you suggest as the best KPI for a non-ecommerce site? Lets make it very simple! What KPI/KPIs do you think would best describes the success of your blog?
September 16th, 2008 at 08:33
Avinash, I need you to talk more about B2B! We don't have shopping carts and we don't have AOV! Our customers take weeks or years from discovery to deal.
We're moving toward recognizing and nourishing repeat visitors, recording all their activity so we can discover what they like, and identifying mid-sales-cycle conversions. We already segment traffic and pipeline by keyword (and by lead source, vertical, and horizontal application).
For our current makeover project we're considering the different needs of different roleplayers in the customer buying cycle, and thinking about distinctive content and pathways for them. (The IT researcher has different concrete and emotional needs of the high-level executive who guides strategy and approves big sales in the same organization.)
I always learn something from every one of your posts but I hunger for more advice on mid-cycle metrics for situations like ours. More B2B, greedy greedy!
September 16th, 2008 at 13:28
Hey Avinash,
I could not agree more. And since you invited comments, I would like to share my two cents on the subject of defining the difference between a KPI and a Metric
1. a KPI echoes organizational goals
2. a KPI is decided by management
3. a KPI provides context
4. a KPI creates meaning on all organizational levels
5. a KPI is based on legitimate data
6. a KPI is easy to understand
7. a KPI leads to action!
I actually went as far as to create a presentation. See that’s commitment to a subject matter. :-)
http://www.slideshare.net/dennis.mortensen/the-difference-between-a-kpi-and-a-metric
In regards to my favorite KPI. I believe that in any adventure, one should try not thinking too much about metrics or whatever – Think about MONEY. That said, I always (at least when I am personally involved) work with KPI’s that have a money part to it. So one of my loved ones are:
KPI: Gross Margin / Visit
Cheers
d. :-)
Dennis R. Mortensen, Director of Data Insights at Yahoo!
Visit my Web Analytics blog or read about my Yahoo! Web Analytics book
September 16th, 2008 at 13:32
Couldn't agree more… there are way too many KPIs out there that are not directly aligned to stated outcomes/objectives and the real world/customer's perspective.
The challenge in the company I work for (the retail arm of a bank) is getting out of the mindset of numerous departments producing endless reports from different databases(just because they always have), and instead concentrating on having a set of shared KPIs (with both online and offline components) based on the customer lifecycle that reflect a sustainable business performance vs. the organisational structure.
There will always be silos and all the problems that they bring in a company, however, good shared KPIs are the basis for collaboration across teams/departments that is essential if we want to deliver a good customer experience.
September 16th, 2008 at 19:56
Hi Avinash,
I am writing this whilst in an Omniture course :). We worked out a solution for the time to convert for event based conversion for a non-product events. You would first need to drop a cookie with a timestamp for the visitor if they didn't already have this cookie. Later when you fire the conversion event you then set an s.eVar which has the calculated value of number of days since the original timestamp. You can then see this under the number of instances column for that eVar.
Time permitting I will write this up and place an article in our next newsletter.
Best
Rod
September 16th, 2008 at 20:49
Avinash- A very timely blog as I was just refreshing myself on this for an initiative. Isn't it ironic that sometimes we forget about the "Key" in Key Performance Indicators and generate KPIs by the bushels :-).
I like Recency and the related RF(M) way of thinking but my personal preference is more towards latency (time between purchase, days to purchase etc.) models customized to a very specific segment and then using these as a sort of a trip-wire/trigger flag. Like you said, the KPIs should be tied to an objective and the sooner you find out if and when you deviate from that goal, the better your chances are in terms of steering the ship back on course.
The other one I like is of course the Task Completion Rate (or something similar) — especially the value it can provide during redesigns (and with the newer technologies,we are slowly moving away from a 'set' release cycle to a continuous 'dynamic' site improvements and that is where a metric like this shines). I will readily admit I am biased here — being a firm disciple of the Q-square school (You can't have perfection with just Qualitative or Quantitative data — got to have both).
As always a great post.
"I don't know the key to success, but the key to failure is trying to please everybody." – Cosby
September 16th, 2008 at 22:45
hey avinash!
awesome post!
Elaborating on "If you can’t segment a Key Performance Indicator, you have picked the wrong one."
This is undoubtedly something which needs a special mention, too often web analyst are stumped when management asks for a segmented view of KPI's and i've learnt it's always good to ensure that your ready to segment any of the KPI's chosen for business.
cheers
Anil
September 17th, 2008 at 04:45
Hi Avinash,
I liked the responses you got for this post. I would like to say heartily thanks to those who responded here and added more stuff.
-Bhagawat.
September 17th, 2008 at 05:05
Of course measurement is vital but only measuring from the data can be deceptive so the KPI's should as you sugeest be set on outcomes. But if we are aiming to be as succesful in MARKETING as we are in web site performance then the KPI's must include how the BRAND is being translated and used online. Brands are about values and the KPI's may therefore have to be value judgements but they are judgements to be made! Because KPI's not only lead to objectives and measurement but judgement as to how to improve performance.
September 17th, 2008 at 07:39
Hello Avinash. Great post. How about Cross Session Conversion Rate? In the individual health insurance business we have a lengthy enrollment process that forces a percentage of our consumers to start, save, and return to complete their online application so tracking conversion rate across sessions is critical.
September 17th, 2008 at 09:09
Avinash,
As you point out, your list is very e-commerce site centric. I'd probably like a more generic list of top 10 KPIs. I agree with Conversions (Macro & Micro Conversions). I also agree with Task Completion Rate and Share of Search. These are very important metrics. I think an arguement could be made for Visits and Visitors from the standpoint that some business models are dependent on having large numbers of visitors in order to base ad pricing on. So, there is a financial tie to those metrics although I think that they are good to know regardless. I guess if that financial tie is there..you can consider them KPIs….if it's just to gauge traffic levels…it's just a metric. I'd also like to see what percentage of your conversions are coming from organic versus paid efforts. You'd need to marry this with campaign tag data to get at.
Great post. It's amazing the discussions that come out of some of the most elementary topics.
A.C.S.
September 18th, 2008 at 04:31
Avinash:
I liked this post a lot. KPI is the base of analytics and still come out a lot of things that make me think and reconsider my own ones :)
But I agree with Anil, if you can't segment it's not as important as you thought at first. I've found out context is king and segmenting is prince :)
abrazos
September 18th, 2008 at 10:49
[...]
It’s critical to do something. And by that, I mean write down what it is you think your customers want out of the community, marketing plan, strategy you plan to adopt. But then, be prepared to innovate away from that.
Incidentally, another session yesterday with Avinash Kaushik, author of the blog Occam’s Razor, he talked about how analytics can help you to determine what it is that people want. But one has to look a little deeper into the analytics in order to determine the results.
[...]
September 18th, 2008 at 15:01
Here is how you would do the Days/Visits to Purchase in Omniture SiteCatalyst:
For Days to Purchase, SiteCatalyst has built-in conversion reports (underneath Visitor Retention – Sales Cycle) named "Days Before First Purchase" and "Days Since Last Purchase." If the Success Event in question is a custom Success Event (such as Lead Form Completed), then you would need to work with Omniture Consulting to implement a quick plug-in to replicate these reports (or use the Purchase Event if it is not being used!)
To see the number of Visits taking place prior to Purchase in SiteCatalyst, you would simply use the conversion Visit Number report and add the appropriate metric (Revenue, Orders or any other custom Success Event). If you then want to group Visit Numbers as shown in this post, you could either download the data to Excel and use a pivot table or pass the Visit Number to a custom Conversion Variable (eVar) and classify it using SAINT. Hope that helps!
Adam
September 18th, 2008 at 16:12
A favorite KPI I've been using on internal portals and business applications is "Adoption Rate" Which is the number of users who have performed X amount of tasks on a portal/application divided buy the entire business population who has access to that tool.
There is a whole world of analytics happening "inside the firewall" Business people and Technology folks are just as interested these days about their business tool investments as eCommerce folks are about their conversion rates.
September 19th, 2008 at 07:18
[...] Eight Rules for Choosing Web Analytics Key Performance Indicators – The Eight Avinash Rules for Entering KPI Heaven. Is there really any need to explain it any farther? [...]
September 19th, 2008 at 10:12
Great post :-)
September 19th, 2008 at 23:08
Joe: You are very right about stressing that each goal should have a value associated with it. I have been recommending that if you don't know what the goal is just put $1, psychologically it makes such a difference with Decision Makers review results.
Something about money that gets people to pay attention! They'll ask questions, they'll help you to figure out what the right number should be.
Dave: Each site should have very clear top level metrics (the "critical few") that define and measure success. These will go to Sr. Management. After that we might have other "drill down metrics" but my constant stress is that these metrics should have a very clear "line of sight" to the critical few. If not then you are working on things that are either not deemed to be important or ones that won't yield business insights.
Shankar: I have covered non-ecommerce metrics before (for support websites or other kinds of websites or even for ecommerce websites how to track "micro conversions" which will typically be non-ecommerce).
Ditto for blogging. Here's that post: Blog Metrics: Six Recommendations For Measuring Your Success.
But a quick summary of that one: I use Feed Subscribers (my most important metric, currently at 12,268 for this blog), Conversation Rate (approx 30 per post recently) and Ripple Index (745 recently – down a bit because I am not blogging enough!).
Dennis: Your beloved metric is very nice! A very good friend (CMO of blinds.com) had shared it with me a long time ago as something his company uses to measure their overall success. Since then I am also a fan of Gross Margin Per Visitor.
In general, as stressed in this post, I almost always atleast start with one or two Outcome metrics, to get Management excited. I might put others later as required.
Seb: I think you have hit the nail on the head. The core reason for many websites (not just retail arms of banks!) stinking when it comes to measurement is: Closed minded approaches to success measurement created by a siloed mentality (typically a function of org structure).
We, online, needs to start to understand other channels a lot more and adapt our KPI's accordingly. They have to learn to do the same for us (after all the "interweb" is not a toy any more!).
Rod: My first thought on reading your comment (your very very good comment) is "oh my that sounds hard!". But of course for Magician Rod it is all in a days work. [Note to Blog Readers in Australia: Hire Rod to do all your web analytics work!!]
Rob: You have pointed to a great metric! In the past I have recommended measuring Days to "Purchase" and Visits to "Purchase" (Purchase does not have to be ecommerce, it can be a form submission or a download or anything really). This is very important in understanding pan session behaviour of our customers.
If you segment those metrics then it is so awesome for understanding performance of your Paid Search or Affiliate or Email or whatever campaigns.
Rick: Let me hasten to stress that I am not saying Visits and Visitors should not be there. I wanted to stress that I'll always see them as subservient to other metrics, and certainly not ones I would put up first.
For example even if I am squatting on a domain (boo!) and have adsense on it (boo! boo!) then my success is really tied to the number of Visits to that site. But perhaps what I'll measure first are click thru's on the ads, then Visits, then see if there is any correlation, and perhaps segment by sources.
So just a matter of hierarchy.
Adam: Thanks for being such a sweetheart and adding your valuable comments. I am positive the readers of the blog who use Omniture will find it to be of value. You have provided a ton of guidance in two short paragraphs!
Mark: Your comment highlights another very important facet of the KPI "business", not only can KPI's be unique to each business but in many cases you might have to get out of the accepted norm and create new metrics that are relevant for the business outcomes relevant to you.
Sometimes people just randomly add subtract and multiply metrics, but Adoption Rate is a great example of creating a "new" metric that makes a ton of sense. Thank you.
-Avinash.
September 20th, 2008 at 06:48
Avinash..does this mean you think internet users are generally like women? They might say one thing e.g. in a survey ("I want a nice and caring guy"), but then they end up with a bad boy?lol
Actually, I'm not kidding about this. I've thought about this before..that people often say they want something, but the mass isn't smart enough to really understand what they want. So if you tracked what they say they want and what they end up doing, the outcome might be very different..
Is this what you mean by correlating survey data (what they say) and web analytics data (what they actually do)?
September 21st, 2008 at 16:26
Patrick: Let me rush to add that I was not even remotely referring to "saying one thing and meaning another" (and certainly was not referring to even remotely to Male / Female behavior – though IMHO both sexs are just as prone to that!).
Each method has its own unique bias.
For example the clickstream data (Omniture, Google Analytics, ClickTracks etc) is biased because it relies on page views – how would you know things your Visitors wanted, but which you did not have listed on your site (there would not be any page views!). So that data is biased towards reporting what you have.
Survey data (4Q, iPerceptions, CRMMETRIX etc) could be biased because you'll survey only a fraction of your website Visitors (which is ok).
So when you look at your survey data correlate it with your clickstream data (or vice a versa). When 40% of the people in a survey say they are there to research and 90% were able to complete their task then check if that math corresponds with the % of page view to your product pages on the site. Just as an example.
-Avinash.
September 21st, 2008 at 23:37
Great tips Avinash. Thanks!
This will definitely come in handy when the next customer asks us: What's a good KPI?
September 22nd, 2008 at 06:23
[...] Key Performance Indicators. There’s a lot of talk about them, but few truly understand them beyond the basics. Yet it’s vital, in many cases, to develop custom KPIs so you can make the most out of the data you’ve collected. Where to begin? Avinash Kaushik has eight good rules over at his blog. I like this one the best: “Using KPI’s that can tie back to the ‘old world’ and ‘traditional metrics’ and help you bring people to the current age.” I like it because it helps many who may be unfamiliar with web metrics get a better grasp on the concept. And that’s an admirable goal in a Web world, isn’t it? [...]
September 22nd, 2008 at 12:21
Hi Avinash,
Great post. It got me thinking about how we often hear pushback on web analytics because of the disconnect between them and the rest of the sales cycle.
Sometimes a web-based KPI is only understood in the context of the larger business cycle. Your article inspired me to think about feedback we've gotten from a number of clients about the relationship between LEADS on a site and what happens once they're vetted (i.e., opportunities). I wrote about it here:
http://blog.purevisibility.com/2008/09/the-key-performance-indicator-for-lead-generation-websites/
So the next step of the discussion is to ask: once you've determined how to move the needle on downstream metrics, what web-based KPI do you look at?
September 22nd, 2008 at 12:21
[...] (KPI) there are. Shouldn't there be as few as possible? Even when a company carefully selects web-based KPI, the problem often lies in what happens AFTER a lead comes in to a website. And, in truth, the [...]
September 24th, 2008 at 18:36
Very educational, insightful, and fun – which makes your blog!
There's a wonderful hidden value in bounces; can I sell them what they were looking for?
September 25th, 2008 at 01:29
The analytics happening “inside the firewall” Business people and Technology folks are just as interested these days about their business tool investments as eCommerce folks are about their conversion rates. I feel it’s amazing the discussions that come out of some of the most elementary topics. I always learn something from every one of your posts but I hunger for more advice on mid-cycle metrics for situations like ours. More B2B, greedy greedy! I have a ecommerce site which I really love for its potentials. I personally find “Visitor Loyalty and Visitor Recency” the best for my site.
What would you suggest as the best words for a ecommerce site? I wanna more…
September 25th, 2008 at 15:46
[...] Those are just some of KPI measures that were found across a number of different articles and websites. One blog in perticular located at http://www.kaushik.net/avinash/2008/09/rules-choosing-web-analytics-key-performance-indicators.html, is a great read concerning KPI’s. In this blog Avanish (the blog writer), posts what he thinks are the most effective KPI’s to use and eight tips to use KPI’s effectively, accompanying his opinions and reasons with great graphs and charts. Avanish states that one of his favourite KPI’s is “Days & Visits to ‘Purchase’”. He comically compares consumer shopping habits to there dating habits. He states, whilst referring to people’s shopping habbits, that, “Life rarely is about one night stands. People don’t behave that way. We like to take our time”. The Day’s and Visits to Purchase meausre basically counts how long it takes for a person to complete and outcome on your website, with that outcome most commonly being a purchase. [...]
September 26th, 2008 at 04:50
[...] If Avinash Kaushik was stranded on a desert island and could only track 8 KPI (key performance indicator) metrics, which would they be? Check out Eight Rules for Choosing Web Analytics Key Performance Indicators to find out. [...]
September 26th, 2008 at 09:21
[...] Eight Rules for Choosing Web Analytics Key Performance Indicators [...]
September 26th, 2008 at 10:42
Hi Avinash,
Your blog has been very helpful to me. I am learning things I have not seen elsewhere on the web.
I also personally find “Visitor Loyalty and Visitor Recency” the best for my site.
Thanks much for your labors!
Cheryl
September 28th, 2008 at 09:06
[...] Eight Rules for Choosing Web Analytics Key Performance Indicators (Avinash Kaushik) [...]
September 29th, 2008 at 00:57
Nice article. I agree in many points.
September 29th, 2008 at 11:16
Many thanks to everyone for the continued contributions to this post. I think KPIs are one of the most important discussions we can have, and the insights here have been great!
This fact got my thinking. For a blog, something I would want to know/calculate is "days of activity per post". For a conservative answer 'activity' could be defined as a new comment, a generous answer would come from pageviews or visits. Being able to engage your audience for an extended period of time, and creating timeless content, is quite an achievement and deserves to celebrated!
September 29th, 2008 at 14:33
[...]
Avinash has a great post on key performance idicators (KPIs) over at his web analytics blog. Not only does he mention some of the most useful ones (depending on your business that is), he also puts up 8 simple rules on how to do it right:
[...]
October 17th, 2008 at 11:52
[...] Are you using your analytics (i.e. website stats) effectively? Have you defined Key Performance Indicators that provide you with quantifiable data about the effectiveness of your website? Check out web analytics superstar Avinash Kaushik's post, "Eight Rules for Choosing Web Analytics Key Performance Indicators." [...]
October 31st, 2008 at 00:09
[...]
was gibt’s zu beachten?
Der Autor von “Web Analytics an hour a day”, Avinash Kaushik, hat mit seinen 8 “Avinash-Regeln” aufgestellt, um in den “KPI Himmel” zu kommen, eine interessante Ideensammlung aufgestellt:
[...]
December 10th, 2008 at 23:16
I would say this is probably the most valuable blog ever posted on here, not just from Avinash's contributions, but from the comments as well. Daniel O'Neil's blog on the Purevisibility site is definitely recommended reading, forcing you to think beyond the lead conversion to a broader strategic sales approach.
Kudos to everyone for their contributions.
December 22nd, 2008 at 18:06
[...] Eight Rules for Choosing Web Analytics Key Performance Indicators by Avinash Kaushik [...]
December 23rd, 2008 at 15:16
[...] Eight Rules for Choosing Web Analytics Key Performance Indicators by Avinash Kaushik [...]
March 5th, 2009 at 02:37
I have to deal with 28 websites in 30 languages. So when advising the countries about KPI's, I always advise to think about different KPI's:
- Marketing
- Sales
- Finance
- Usability
- Product Management
March 5th, 2009 at 03:17
this is amazing and i have just bought your book and I really like it, as it is bringing my insight to analytic and metrics, So I want to know really , what are the web metrics for – Usability and website performance measurement?
March 5th, 2009 at 23:29
Abdullah: The Usability metrics would depend on what you are trying to accomplish with your website.
Sometimes something as simple as bounce rate will tell you if you meet primitive usability criteria.
Or measuring Search Exits (for internal site search) will tell you the quality of you internal search engine. And other such things.
But if you truly want "usability metrics" then you need to use usability methods. Lab Testing, Surveys, etc.
For example I think the single greatest usability metric is Task Completion Rate (as measured by something like 4Q), because that is your customers directly telling you, without you having to interpret clickstream.
Website performance is tricky to measure using web analytics tools (that is not why they were built). I would look into solutions like Coradiant and Maxamine.
-Avinash.
March 9th, 2009 at 00:37
@Abdulla: regarding usability metric I use KGI's. For example: if a goal is to lead % of visitors to download page of brochure, the KGI (usability metric) could be that these visitors should find their goal within 3 clicks.
March 21st, 2009 at 04:55
Thanks for your response Avinash. But tell me for a company which is into portals of Jobs, Property, Marriages etc ( other than e-commerce, i mean into internet business affecting an individual at various stages of life)and where the online marketing spend is about 50% of revenues, what can be few measurement criterias to check the effectiveness and accountability of people doing the online marketing. Is it only the metrics like CPA , CPC etc or is there more to it?
April 7th, 2009 at 17:31
[...]
In her case, the creative team was an outsourced agency, although this scenario can play out just as easily between inhouse departments. In either case, bringing all team members to a shared set of goals is the only way to ensure that everyone is pushing in the same direction. Clearly defined KPIs have a lot of value here.
[...]
May 5th, 2009 at 08:01
[...]
Metrics / Reporting – this is the foundation of using data effectively; it’s the way you assess whether you are meeting your objectives and achieving meaningful outcomes. Key Performance Indicators (KPIs) live squarely in the world of metrics (KPIs are a fancy way to say “meaningful metrics”). Avinash Kaushik defines KPIs brilliantly: “Measures that help you understand how you are doing against your objectives.” Metrics are backward-looking. They answer the question: “Did I achieve what I set out to do?” They are assessed against targets that were set long before the latest report was pulled. Without metrics, analysis is meaningless.
[...]
May 27th, 2009 at 04:00
[...]
Although every playing is unequalled and every website has assorted poetics that matter, the mass itemize is nearly coupler in appeal. Note that we're exclusive concealment those poetics grave to SEO – optimizing for the wager engines – and as such, more general, but ease primary poetics haw not be included. For a more comprehnesive countenance at scheme analytics overall, analyse discover Choosing Web Analytics attorney Performance Indicators from Avinash Kaushik's superior Web Analytics Blog.
[...]
June 11th, 2009 at 03:01
Thanks for the useful info. It's so interesting
October 20th, 2009 at 09:14
[...]
Web Analytics
Having a business model for monetization, you will then need to measure how your users are using your site and track the ROI.
Google Analytics is a free web analytics tool for this purpose.
[...]
November 4th, 2009 at 16:09
Mr. Kaushik –
I love your insights, they are truly awesome and well thought out. Question: For eCommerce at least, it seems like Total Revenue might be as good a KPI if not better than Conversion Rate. Especially in the realm of higher priced consumer products. Average Order Value when mixed with CR is very insightful, but what truly seems to matter is Total Revenue. What are your thoughts on when to emphasize Total Revenue over CR?
PS I received your new book in the mail last Friday. Maybe the answer lies within. Thanks again for posting and sharing your A+ ninja skills.
November 4th, 2009 at 18:09
Drew: Revenue of course is "god" for ecommerce sites. But just looking at it poses an issue: it might not be insightful enough.
Take this example.
You made $1 mil in Oct.
You made $1.2 mil in Nov.
Magnificent growth.
But in Oct you got 1,000 Visitors and in Nov you got 1,000,000 visitors.
Ouch!
Both Conversion Rate and Average Order Size try to get you to understand if you are being "efficient", something just looking at the aggregate revenue number might not reveal instantly.
Avinash.
November 5th, 2009 at 00:13
Avinash…my first post…
I'd just like to thank you for an absolute barnstomer of a post…I'll be making sure all of our team reads this.
Over the recent months you've inspired both me and our team.
BIG THANKS
Google Dave
PS…love the new book…it's like a bible in our place, everyone's fighting over it!
November 6th, 2009 at 01:32
Hi Avinash,
Thank you so much for these Insights. I have shared with colleagues who may find them interesting.
Much appreciates
Sibongiseni
May 5th, 2010 at 05:20
[...]
The quickest and probably most popular method to check on a blog’s success is to look it up on the internet. This gets us into the field of tracking blog success, including your own, and of analytics and KPI’s – Key Performance Indicators. These will be subject of separate posts. In the meantime, to get you started, you might want to visit Avniash Kaushik’s blog. Avinash is one of the leading “if you ain’t got no goals, you ain’t got nothin’” protagonists out there. Of his posts, I recommend these in particular:
Six Web Metrics / KPI’s To Die For
4 “Useless” KPI Measurement Techniques
Five Rules for High Impact Web Analytics Dashboards
[...]
June 16th, 2010 at 09:01
[...]
What is a KPI?
Not to be confused with SEO’s KEI (Keyword Effective Index), KPI stands for Key Performance Indicator. As Avinash Kaushik would say, KPIs are measures that help you understand how you are performing against your objectives. They can help you define and evaluate whether you’re making adequate, successful progress towards your long-term goals.
[...]
June 30th, 2010 at 19:24
[...]
In her case, the creative team was an outsourced agency, although this scenario can play out just as easily between inhouse departments. In either case, bringing all team members to a shared set of goals is the only way to ensure that everyone is pushing in the same direction. Clearly defined KPIs have a lot of value here.
[...]
September 5th, 2010 at 08:25
Thank you so much for this, nice to see someone else’s insight into marketing, and getting value from the numbers. Thanks LT
October 4th, 2010 at 07:50
[...] Kaushik, Avinash. “Six Web Metrics / Key Performance Indicators To Die For”. Occam's Razor by Avinash kaushik,16 septiembre, 2008. http://www.kaushik.net/avinash/2008/09/rules-choosing-web-analytics-key-performance-indicators.html [...]
October 25th, 2010 at 09:33
[...]
Measure twice, cut once – statistics and analytics.
Start to measure
Google Analytics
Piwik – Open source Web analytics
AWStats – Free log file analyzer for advanced statistics.
What to watch
Six Web Metrics / KPI’s To Die For | Occam’s Razor by Avinash Kaushik
Don’t forget to look for opportunity to improve upon success
[...]
November 11th, 2010 at 15:18
[...]
What to watch
Six Web Metrics / KPI’s To Die For | Occam’s Razor by Avinash Kaushik
Building Web Success: Optimizing Online Conversions, Part One: Goals and Tracking
Don’t forget to look for opportunity to improve upon success
[...]
February 14th, 2011 at 08:02
[...]
Although every business is unique and every website has different metrics that matter, the following list is nearly universal in appeal. Note that we’re only covering those metrics critical to SEO – optimizing for the search engines – and as such, more general but still important metrics may not be included. For a more comprehensive look at web analytics overall, check out Choosing Web Analytics Key Performance Indicators from Avinash Kaushik’s excellent Web Analytics Blog.
[...]
March 9th, 2011 at 09:03
[...]
And we were working 16 hour days and dirt poor because all our ideas to monetize it didn’t work until we burned-out and closed it down. Enough said.
Find out which metrics are important in relationship to your bottom line and which aren’t. Develop Key Performance Indicators revolving around your analytics.
[...]
May 3rd, 2011 at 23:29
[...]
Er bestaan binnen Google Analytics mogelijkheden om KPI’s in te zetten om jouw Google AdWords campagne te verbeteren. In deze blog zal ik de meerwaarde van de KPI’s maximale kosten/conversie en maximale kosten/klik bespreken.
[...]
May 4th, 2011 at 08:27
We are in Balanced Scorecard / KPI business and I must say that you did a great job in this article.
Two key KPIs rules are followed:
1. Each KPI is descriptive and easy to use (well, if you are in SEO business)
2. All the KPIs are balanced to each other, e.g. not repeat each other, but all together cover all the SEO process.
Great job!