In Web Analytics Context Is King Baby! Go Get Your Own.
 Common complaint: "Sure I have web analytics data, I have no idea what to do! I swear I have really tried hard and looked at all possible reports. I can't find anything interesting".
Does this sound like something you would say?
Know what the single most important missing ingredient?
Context.
Often numbers don't "speak" to you, or as loudly as they can about what you should do, because you are missing the context you can place around those numbers. Something that makes you want to take a pause and say: "ahhhh I get it now" or "ahhh that's interesting. . . I wonder if. . . ".
So what is this mysterious magic potion?
Its quite simple really, in its simplest form it is surrounding your Metrics, Key Performance Indicators, Reports, Dashboards etc with other information (quantitative, qualitative, tribal knowledge) that adds a pinch of color. Context.
Here's an example. . . . .
Undoubtedly you sent your Manager / Director / VP / Mom this month's "performance" / site statistics for this month. Perhaps it looked this this:
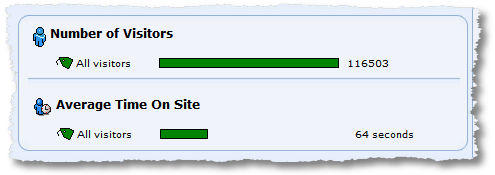
What can you infer from this? Almost nothing. Even less than nothing if you are a step removed from the daily existence of your site (or even months existence).
Now let's do what ClickTracks does best, add a touch of context. All I am going to do is add a couple of segments that might help add a color to the above web metrics.
Here it is:
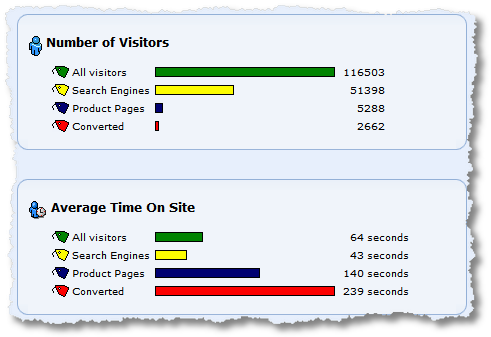
Now answer the same question again: Can you infer anything from this?
A lot I am sure.your site.
For your 116,503 Visitors you know some interesting things: Approximately half came from search engines, only a tiny fraction, 5,288, did what you wanted them to, look at product pages, and, perhaps more humblingly, a tiny tiny fraction converted.
From the second set of data for Average Time On Site you get a sense for the varied distributions in time each segment spends on your site. 64 seconds might have felt like a hurtfully low number for your beautiful engaging site. Now you know that atleast some people spend more time on the site (those that make it to product pages). You also know how long it takes for someone to convert, 239 seconds.
Now I'll admit the above picture might not quite be God's gift to you, but it raises the right questions that need being asked.
It will also help focus the initial analysis effort that you'll undertake. You'll ask why 51,398 Visitors to your site spent 43 seconds on average on your site. Where do they enter, what keywords, ppc or organic? What can we fix? is 239 seconds the right amount of time to conversion?
Well worth the nine seconds I spent on it right?
Simple context makes data a lot more interesting, helps you focus and find some actionable insights. Reporting rule #0 in my book: Never report data in aggregate, or by itself. Always always always test to see if you are including context!
Sold?
Here are other techniques that you can apply in your quest for insights when you look at your own web analytics tool. . . .
# 1: Compare trends over different time periods.
Cheapest trick in the book. Honestly.
The question we are trying to answer is: "does this dashboard communicate anything of value?"
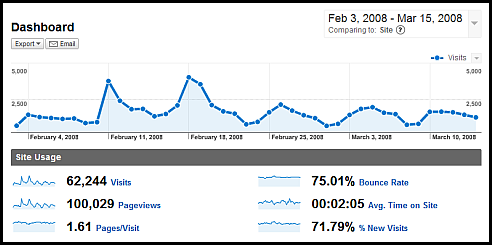
Its cute, I'll grant you that. But really when push comes to shove it is not saying a lot. Especially to people who might not be immersed in your data (except for you of course!).
Now try this: choose a comparable time period, the last month or same month last year or whatever makes sense in your case.
Boom!
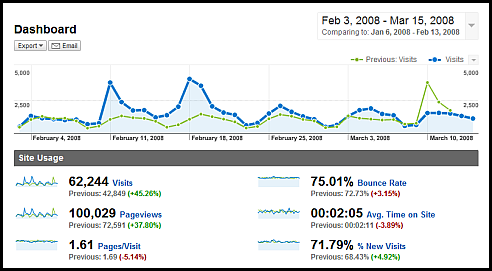
Ok so maybe I am getting excited about this. But look carefully insights, ideas, questions, are staring at you.
First you have had a awesome last 30 days (make sure your boss knows, she needs to look like a hero!).
Additionally for some the other metrics are coughing up insights. It is normally astounding that your traffic went up 45% and the bounce rate only went up by 3% – it is extremely rate to get that new traffic that is that qualified (quick find out what the Marketers did!).
Page views held steady as well, as did time on site, all good signs. And what's up with those three spikes, so unrelated to other time periods that match so closely? Dig please.
Quiz for you: What does that % of New Visits number (and delta over last month) indicate? I found it to be very surprising. Add your answer to the comments.
# 2: Compare key metrics and segments against site average.
Yes, yes, yes, averages can sometimes lie. Ok ok ok many times. :)
But they can also be your friend, especially when to comes to helping you get the initial set of context that you so sorely need to make your mass of web analytics clickstream data actionable.
You are really curious about your Direct traffic (also called, default, unknown source, bookmarks etc etc). In a couple of clicks this is what you are looking at:
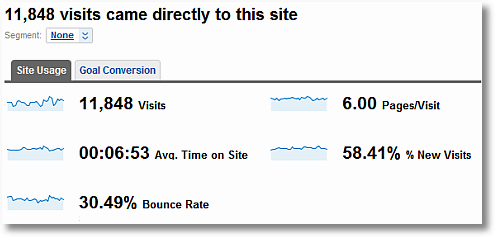
Hmmm….
Nice? Things are going well? Maybe? "Avinash is wrong, web analytics is hard!" Ok ok, try this… two mouse clicks in Google Analytics … choose compare to site average for this stream of traffic. . . .
Abacadabara!
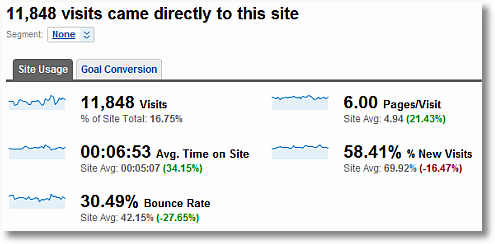
Sweet! See meaningful data, closer to you than you had imagined.
For "Direct" traffic now you have a at a glance knowledge of the vital stats. Smaller % of the traffic, but astoundingly valuable, by most measures you see above (time, bounce, pages etc).
See that is totally missing from the original picture. That second picture you can send to anyone in your company, or outside, and they won't ask you what the definition of Bounce Rate is or how Time on Site is computed. They'll understand performance. Because you gave them context.
This is how you get beyond the bickering about definitions are numbers, you get to have a discussion about what actions to take. Priceless.
# 3: Couples Rock!! :)
You need someone. I need someone. Everyone needs someone. Why not our metrics?
A very common mistake in reporting is to simply report on the important metric you care about by itself. I call these important but lonely metrics. I feel sad for them.
Why not pair your important metric with its husband / wife / "special friend" / partner / mistress? You'll understand performance of one and get actionable context from the other.
Its like sometimes you meet a person, and you are not sure what to make of them. Then you meet their significant other and you say "ahhhh everything makes sense now!" (Am I being a big mean here? :)
Let me explain, look at this common report, its important, I am sure you are sending it out to everyone:
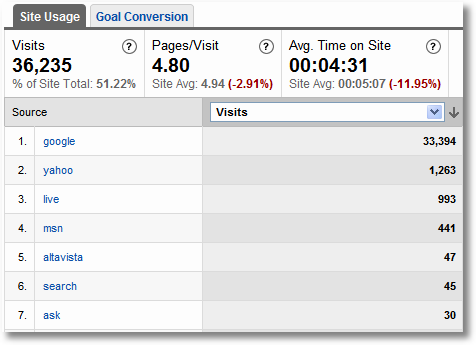
Ok so that's nice. What do I do? Buy more Google? Dump MSN?
What you see above is just data, nothing useful.
Try this simple thing, find it a friend. . .
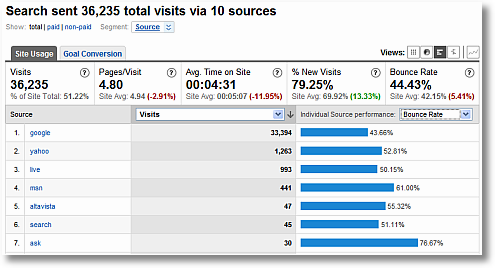
Oh la, la, now you are cooking!
The spouse metric (Bounce Rate) gives context to your core KPI (Visits) and suddenly this metric is a lot more useful. Any lay person, or a Analyst, can see instantly that some sources are good and others maybe not so much. Interesting actions can be taken about budget spend or why is something better than other things etc.
Of course you can do this with anything you want. Keywords, pages, referrers, campaigns, whatever is important to you, and whatever tool you are using, here I am using IndexTools and its custom report feature. . . .
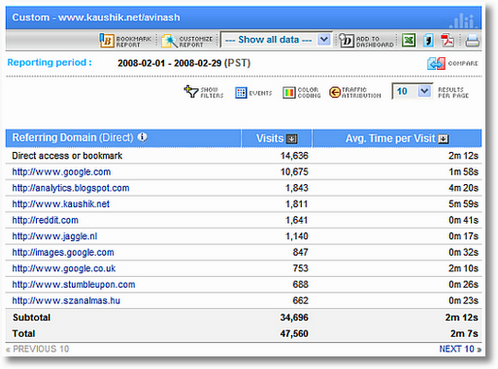
Nice!
One quick tip: As much as possible try to pick the spouse / mistress / friend metric to be a Outcome metric – something that helps measure success of you site.
Try it, you'll see what I mean, insights will practically scream out at you!
# 4: Industry Benchmarks.
These are astonishingly good at helping you get context to your performance.
Your conversion rate is 2% or your time onsite is 42 minutes or your share of search is 7% for a search engine (or a keyword) or . . . . How do you know if that is great, and you should rest, or really terrible and you need a Marshall Plan to fix things?
Use external context.
We have talked about the value of using the FireClick Index so many times in the past . . . .
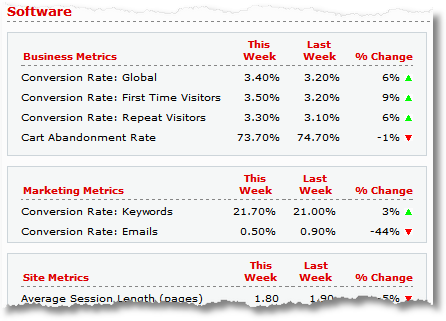
Put your metrics against these, or others on that site, and see get delightful amounts of context.
Now Google Analytics also has a feature where you can also get benchmarking data, and in this case quite deep into your very own industry segment so you can see increased relevance of these benchmarks. . . .
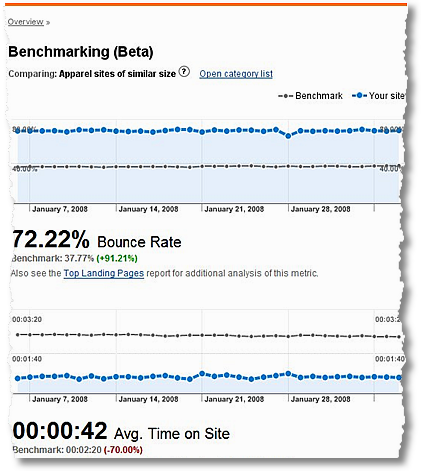
Sweet ain't it? This site above had much higher traffic than other Apparel sites, much much higher, but they also have a much higher bounce rate and much lower time on site. Without the context of the benchmarks they could be celebrating, with the benchmarks they can start to make intelligent decisions.
[To learn more about GA benchmarking and the new data sharing settings policy please see this blog post by Brett Crosby:
http://analytics.blogspot.com/2008/03/benchmarking-now-available-plus.html]
# 5: Tap into the tribal knowledge.
If there is a "killer app" for getting context to your web analytics data it is tribal knowledge. Information about initiatives, marketing programs, website updates, changes, management re-org's :), server outages, ppc, direct marketing and on and on and on: Things that have a impact on your website.
Web Analytics, and in turn Analysts, sit in a silo. This means that very often they have no idea about all the things that people are doing the site or to their acquisition strategies. So they look at all these numbers and metrics and trends and then like Tarot Card readers guess what the numbers mean!! A futile exercise.
There are lots of moving parts to a website and a lot of people involved in the holy exercise of creating something of value for your customers. It is a complex dance with many moving parts. . . .

The best way to get context is to seek out all the players and / or staying plugged into the various different processes to tease out vital context for your numbers.
"Ahhhh so you send out a big email blast five days ago!"
"You were running a multivariate test? Why did you not tell me in advance?"
"The shopping cart was down for nine hours! That explains so much, thank you. Kiss"
"We've adopted a new media mix model?"
"None of our last 6,000 campaigns were tagged! Pulling hair out!!!"
So on and so forth.
Step outside your cubicle, office, talk to people, take marketers out for dinner (if you do more than dinner please first refer to your company's HR policy!), create information loops that are closed (and include you!), etc etc.
Often all it takes to put a trend in context is to know everything different parts of your company are doing. Go get plugged in!
That's it, five simple easy to action recommendation.
Actually I have more that I could write about but I have six speeches in five days in NYC this week so I can't do as much justice to this post as I would like to. But one last quick tip, another great way to get context is to understand Primary Purpose, it is absolutely awesome. As to how to get Primary Purpose: Use the 4Q survey.
Thanks, hope this was just as much fun for you as it was for me. Please share your own ideas of how to get context, what works for you and what does not, please share your own battle scars using the form below.
Good luck!
PS:
Couple other related posts you might find interesting:





March 18th, 2008 at 04:19
Avinash, once again, great article! I stopped sending "great article" types of comments because I would, like many others, say it on every of your posts :)
Quiz: What does that % of New Visits number (and delta over last month) indicate? I found it to be very surprising.
It's the ratio of new to returning visitors. So in your example, about 72% of the visits were from visitors who were coming for the first time. What I would do with that: look at where they came from! The delta of 5% means there's even more new visitors than the previous period. Higher new visits ratio and higher visits (45% more!), good thing: you are acquiring new visitors!
March 18th, 2008 at 05:12
Hey Avinash great article! (Unfortunately i haven't learned to stop saying "great article" yet…maybe someday i'll learn)
As far as your % New Visits are concerned.. I'd like to just add on to what Stephen Hamel's comment already says. For some reason, my eyes always find themselves going back and looking at the trending graph, and there you can definitely see two distinct surges in traffic towards the first-half of the time-period and its comparison. Some kind of marketing / new blog post / announcement definitely happened on those two spots. There was really one 1 of those traffic surges, and that happened closer to the beginning of February…so I would bet that most of that 4.92% increase in New Visitors happened on those two days in late february or early march…I also like how on the second traffic boost, there was a two-day period of highly increased activity – i always like to see that kind of momentum to be carried on over a few days, before it "comes back down to reality", if you know what I mean.
Thanks AK!
March 18th, 2008 at 06:02
Avinash,
Great article as usual! All the tips perfectly make sense but I like your "tribal knowledge" tip most. It is adding real "context" on the sea of numbers. So I'm trying to get plugged in better out of my cube as you recommended. Keep up the good work Avinash!
Jonghee
March 18th, 2008 at 06:32
Hi Avinash,
I've just been playing around with the benchmarking feature on GA. It looks really interesting – dependent on enough sites in your industry having GA and agreeing to share the data, but interesting nonetheless. Great for blogs one would obviously think.
Do you reckon there will be a backlash from the privacy lobby? Is the checkbox already ticked when you sign up for the first time?
And great article, as per usual, of course.
Alec
March 18th, 2008 at 06:48
Avinash,
Thanks for the great inforamtion. I agree that the Tribal Knowledge tip is extremely beneficial. So many insights can be gathered by getting all of the key people in a single room at a single time to review the marketing activity, its objectives and the outcomes. My experiences in Fortune 500 companies is that marketing pushes forward lots and lots of initiatives to drive traffic to their site and accomplish a boat-load of goals. They rarely ever communicate what they are doing and trying to accomplish to the analytics team. If I knew what they were doing and what they wanted to accomplish, I could help them extract insights. Everybody is so busy 'doing' that they rarely take a time out to 'learn' in corporate america. So much can be improved upon by just taking a time out, sitting in a room, and learning. Even if you didn't do this for every campaign, but just took a look at 3 campaigns every quarter…the learnings from those pow-wow sessions could be applied to the following quarter's campaigns and so on. I think that this topic could be a blog post unto itself. Great post!
March 18th, 2008 at 06:58
I also like your Tribal section, but most of the time I'm the one who has to ask the questions. This is definitely not a job for those scared to be pro-active. As much as I'd love for everyone to come to me or include me on what's going on, they're just as busy as anyone else and they're not always remembering that this type of context really provides a lot of insight.
So I find myself luckily noticing things and saying "Hey, did the site go down on Feb 4?" or "What the heck happened on Feb 17" if there haven't been previous discussions about it. Sure, some things I'm aware of if I keep my ears open around the office, but if I expected to be kept in every loop I'm just setting myself up for disappointment.
So get out there people, don't trust anyone to tell you anything :)
March 18th, 2008 at 07:40
Bryan,
I agree with your comment about being proactive. Point taken. I have actually suggested getting together with my clients and they have indicated that they are too busy for that and don't feel that they are ready to do that…'maybe next quarter.' I have sent out emails to them regarding insights I've found with recommendations with positive response. Sometimes, the tribe gets together via email. Whatever method that gets the minds together, I guess…
March 18th, 2008 at 08:21
Quiz: With such a large spike in visits, I'm surprised the increase in new visits was so small. Was a new product or service added to the site?
March 18th, 2008 at 09:37
I love how you're setting context using other metrics. Typically people set context outside of other metrics, like your example of segmenting and looking at # of visits only.
Unfortunately, providing these services for other companies means I often experience the problems of not being able to tap into tribal knowledge. I make my clients aware that any marketing changes they push will impact my testing and tracking, and so they should let me know what is going on. However, it's tough to get them to always communicate everything going on. I find that once clients know how beneficial it is to them to let me know about upcoming marketing campaigns, they learn to tell me ASAP about any changes that might impact what I'm tracking.
March 18th, 2008 at 09:51
I too am interested in the concept of collecting critical information from the "Tribe." We've all seen this sort of unstructured information make the difference between correctly acting on a trend or shrugging your shoulders.
As Bryan suggests, the effectiveness of rooting out these sorts of drivers is directly proportional to the strength of the researching analyst's network. In other words, the stronger the network, the easier it is to find the missing link. What's more, with the increasing "tribal-ness" of the driver there is a corresponding increase in the dependency on the depth and breadth of the analyst's network (i.e. the more touch points the analysts have and the stronger those touch points are, the "better" the resulting conclusions are).
So… here's a question for the community. Are there any Web Analytics specific "tools" out there that you guys believe attempt to address this need in a somewhat useful fashion? Successfully?
March 18th, 2008 at 10:08
Great Article as always. You are so right about staying informed with your clients and company. Being proactive is the key to success as the old saying points out "knowledge is power".
Now you just inspired me to dig deeper into the metric and compare more often than not. I'll probably even spend 5% of my day stepping outside the office to see what is happening and use software to give me reporting on other things.
Thanks you much. I noticed the 1:30 am post of this blog and the 6 am response back will your full house presentation at SES.
March 18th, 2008 at 10:46
Those spikes look like weekly email blasts to me. Email blasts which have stopped happening, from the look of things!
I'd be asking "why did we stop the weekly emails"…
This would also go some way towards explaining teh shift towards "new" traffic, since the emails would tend to bring returning traffic.
So although we had a good last 30 days, if my hunch is correct we could have done even better and need to be asking questions amongst the tribe.
March 18th, 2008 at 11:38
Great post!
I would add that the product/service category is key… eCom Metrics are often normalized across categories – which is a very "context-challenged" POV
For example –
A product/service with, say a higher price point & longer decision cycle may lead to more online research. The "low" conversion rate may be a success if you know that shoppers tend to convert on say, the 3 or 4th visit.
Hope we can look forward a future post on same metrics that vary greatly depending on ecom category??
thanks, AK.
March 18th, 2008 at 12:37
Tribal knowledge
That is important and valuable. There are two easy things to help with this:
1. Get yourself into all mailing lists / customer list and you will see in your inbox what is happening in other areas.
2. I had a google calendar running with all involved agencies, freelancers etc. where major changes on the website where added by the one in charge. So we maintained a calendar just for analysing data – even month later!!
Andreas
March 18th, 2008 at 19:32
More tribal knowledge…
I've recently gained access to reports from the correspondence unit – they catalogue emails, including ones that are from the contact pages on our website, and produce a weekly report of common themes and whether they have approval or disapproval. They also note how many are from the websites – I've found this to be gold in explaining some of the more bizarre events and getting a feel for what's working and what isn't.
Also I keep an eye on media statements from the departments as they can have links or context which may drive traffic to our sites, and also news items (through Hitwise media alerts) a quick way of reviewing what's out there
As an aside, a classic cock up is getting a request for metrics for a print ad that had a vanity url running over the weekend. Slight annoyance at not being informed this was happening turned into apoplexy and amazement when it was discovered marketing hadn't bothered to inform anyone connected with the website. The url pointed at…nothing! they'd completely made it up. Governance and process were quickly reviewed…
March 18th, 2008 at 23:22
"Know what the single most important missing ingredient?"
I'm thinking the answer would be:
GRAMMAR
March 19th, 2008 at 05:53
I will call it a home run……
How can you be so perfect with these ones….I am your fan……now…
March 19th, 2008 at 08:57
Avinash -
Something occured to me while I was reading today – When there is a spike in your data because of a single day's activity – for example because of an email newsletter or something – well we can report on the month including that exceptional day, but what if you also wanted a baseline for the month excluding that day?
Is there an easy way to exclude one day from the data so that you could get a good measurement for the rest of the month without the effects of that one unusual day be taken into account?
March 19th, 2008 at 09:16
Is there a way to temporarily change the definition of bounce rate in my account? Or is there a way to set up a unique metric that will return the number of people that only viewed one page and spent less than x amount of time on that page?
March 19th, 2008 at 19:41
My sincerest apologies for the late reply, totally swamped schedule in NYC!!
Stephane: Great answer! I believe your hypothesis is correct.
I was initially thrown by that number (71.79%, delta of +4.92%) was becuase if traffic went up by 45% (!!) then how come the delta over prior month went up only 4.92%. I would have expected the % New Visits to be much much higher. Say 90% becuase of that surge of extra traffic.
But perhaps I got a surge of folks who last came in Dec.
Thanks for playing!
Joe: You are right, I love the sustained boost, that particular post, which also got on stumbleupon, delivered a slow but consistent surge of traffic. Sweet!
Jonghee: I met some of your peers at Alan's event yesterday, they are delightful!
Alec: I encourage you to checkout this post:
http://analytics.blogspot.com/2008/03/benchmarking-now-available-plus.html
More than anything you'll notice that the Users get complete control over the settings and you are in control. That's great progress (and a first in the industry, on the free side atleast, I believe).
There benchmarks will only available after a enough websites opt in and only like sized websites are compared and formulas are applied to ensure results you see have a measure of confidence.
Great question, please see the link above and it lists two other links that provide deep insights.
Bryan: Great call to arms: Trust no one, get out and earn your context karma! :)
Greg: Exactly the source of my confusion initially!! The data is for my blog, the two spikes are two popular posts on those dates.
Ken: In some cases tools that have built in annotation features (a la google trends) work great as the tribe takes on the responsibility to annotate the data (IndexTools is one of the tools that has this feature).
I have also seen wiki's work well in some cases. At one of my jobs we set up a online spreadsheet (a la Google Docs & Spreadsheet).
I don't know if this helps.
Beth: Great point! Yes on the future post. :)
Andreas / Jon: Excellent adds gentlemen! Thank you.
"Yourmom": Trying to be cute while rushing a post out has a price, I am sacrificing grammar. I'll try to be more careful. I appreciate the feedback.
Eric: I think some tools allow you to created computed metrics (define new metrics in the tools) but it is not possible to change the definition temporarily.
ClickTracks is a good example, it computes "Short Visits" (bounces) as visits that were shorter than five seconds. But you can create additional metrics with either ten seconds or just one page view or whatever you prefer.
Thanks everyone for the comments and feedback, your conversation truly makes the post valuable.
-Avinash.
March 20th, 2008 at 07:53
[...] Context Is King Baby! Go Get Your Own. – ?wietny post Avinasha Kaushika opisuj?cy proces analizowania danych i odnoszenia ich do ca?ego kontekstu danych serwisu internetowego i jego otoczenia [...]
March 20th, 2008 at 08:10
[...] Occam's Razor by Avinash Kaushik [...]
March 20th, 2008 at 13:44
Thanks Avinash. As many stated before me – this is a great post.
p.s: I found Tip #3 to be an eye opener, since I haven't noticed this option in analytics before – thanks again !
Tal.
March 23rd, 2008 at 09:03
Thanks for writing this nice and extensive article. You made some really good points! Keep up the good work!
March 24th, 2008 at 23:11
Good article to keep an eye on the business based on customer interests. Business forecasting can be made simple!
March 25th, 2008 at 00:36
[...] Context Is King Baby! Go Get Your Own. (Avinash Kaushik) [...]
March 26th, 2008 at 00:05
[...] Great article by Avinash of Occam's Razor on adding context to your audience metrics. [...]
March 26th, 2008 at 02:27
[...] This article reminded me exactly of what I was doing last week in Chicago and hosting workshops talking about the simple stuff that Avinash discusses brings you right back down to earth. I've been looking to the future of web analytics, debating the finer points of engagement and talking shop with some real indistry stars but it's easy to get caught up in all that and forget that most folks simply want to know how to use the tools to get some payback. [...]
March 28th, 2008 at 08:53
[...] Context Is King Baby! Go Get Your Own. [...]
April 29th, 2008 at 08:35
[...] This is one of the reasons Avinash see’s Contextual Data is “King” and why the GA folks are putting a huge effort into this idea. Data without context is useless. A good example of that is the Visitors Overview report. It doesn’t just give you the total amount visitors from a certain time period, and spit out the related graph above. No, it shows you–get ready for this good metaphor credited to Avinash—the “boyfriend or girlfriend” metrics that go together with the Visitor number, like Absolute Unique Visitors, Pageviews, Average Pageviews, Time on Site, etc. Sometimes numbers can be useless if they’re not presented next to other relevant information. [...]
September 16th, 2008 at 01:33
[...] For those of you who don’t glaze over and twitch when I sat web analytics, check out Context is King Baby: Go Get Your Own at Avinash’s blog [...]
December 2nd, 2008 at 02:15
[...]
Although a clear trend pops from both graphs showing a traffic increase, we can not answer the above questions looking at this data. What are we missing?
CONTEXT!
In this case context comes in the form of overall traffic figures and allows us to build 3 metrics:
[...]
February 6th, 2009 at 21:58
[...] Context Is King Baby! Go Get Your Own. on Kaushik.net. Again a nice post by Avinash, Know what the single most important missing ingredient? Context. [...]
February 27th, 2009 at 14:15
[...] Website Optimizer is great, but Website Optimizer with e-commerce data would be better. In general, increasing conversion rates is what we are trying to do, but it has to be in context, right baby? For online retailers, a good context would be revenue. I want to know that a wining combination according to Website Optimizer actually makes money. Perhaps a "winning" combination appeals to fewer visitors, but these visitors have a higher average order size. So, a better conversion rate may not always be in line with financial goals (do I sound too serious?). [...]
April 15th, 2009 at 00:02
Good article, especially for those of us who are just starting to dabble with Google Analytics reports. Keep up the good work!
October 31st, 2009 at 08:29
[...]
Website Optimizer is great, but Website Optimizer with e-commerce data would be better. In general, increasing conversion rates is what we are trying to do, but it has to be in context, right baby? For online retailers, a good context would be revenue. I want to know that a wining combination according to Website Optimizer actually makes money. Perhaps a "winning" combination appeals to fewer visitors, but these visitors have a higher average order size. So, a better conversion rate may not always be in line with financial goals (do I sound too serious?).
[...]