Emetrics SFO Reflections: Deliberate, Dig, Understand, Throw A Feast!
 Another wonderful Emetrics summit is behind us, I want to thank Matthew Finlay and Jim Sterne for inviting me to be a part of it.
This instance of the summit was just as interesting outside the sessions as it was sitting in the sessions. New and old friends, peer bloggers, industry greats, folks who read this blog more than I do :), it was nice to meet them all. I thoroughly enjoyed our conversations, thank you all for making the time.
I continue to be astounded by the progress that keeps getting made in our industry, new stuff all around us all the time. Does that not sound like fun? It really is.
In this post I wanted to share reflections / insights / concepts that stood out for me.
Who? Kristen Findley, Ameriprise Financial Services
What? My Reporting Toolkit: Little less toolkit, little more crib sheet.
Why? Deliberate Your Data.
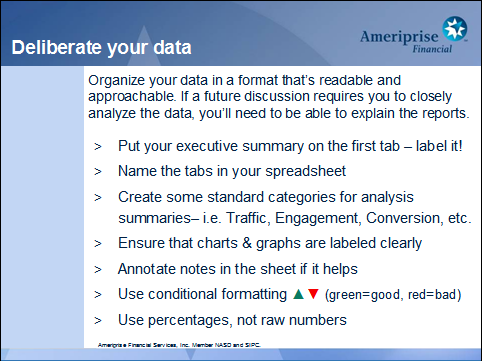
I loved Kristen's presentation because of its sheer simplicity and brilliance. Each and every one of us deals with lots of reporting needs, regardless of if we like it or not. This presentation covered three concepts: 1) Can you repeat the question? 2) Deliberate your data. 3) Before you click the send button.
In the slide above Kristen gives us advice that only a real world practitioner could. So before you send out that fresh batch of twenty two tab spreadsheet please refer the wisdom in the slide above to make things easier for the consumers of your data.
In the rush of our jobs we forget this practical advice, which if followed in its entirety can make a key difference between consumption and auto-delete. For example: Adding a summary on the first tab of your spreadsheet it not just helpful in sharing key insights quickly but it also communicates to your users that you have done more than reporting and are not just sending data over but sending information to take action. Cool ain't it?
__________________________________________________
Who? Jodi McDermott, InPhonic.
What? Creative and Landing Page Optimization,
Why? Digging Into The Data.
Jodi had a great presentation on optimization but one things stuck out for me: That sometimes we should not declare victory or failure simply based on our web data. She shares a case study towards the end of her presentation where two creatives with different offers were run (50-50) for the BlackBerry Perl and Motorola Razr. Analysis of the test showed that the Perl was getting more clicks but the Razr converted better. Victory for the Razr? Not so fast…..
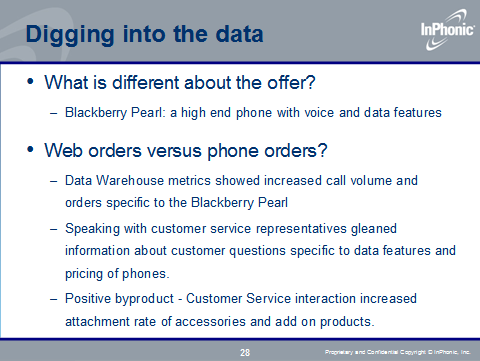
InPhonic undertook the extra step of matching up the online data with their offline data that showed that both call volume and orders for the Perl had increased via their phone channel. Turns out that the website was not answering all the questions, but it was effective in driving customers to call where they no only got the questions answered but also ended up buying more! Net net the campaign was declared a success and (below) yielded some excellent merchandizing options on how to promote and sell the Perl on the website.
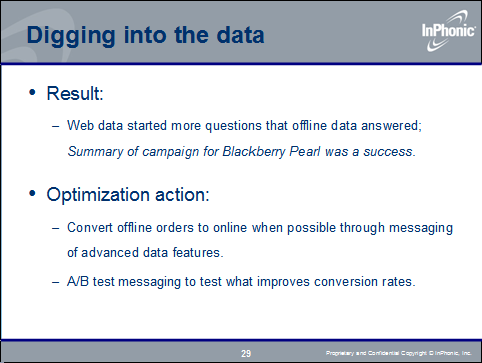
Due to our own organization structures and missing primary keys (to tie the data) it is not often that we go through this type of a exercise. But as it clear in this case, there is a lot to learn when you attempt to glean learnings from a multi-channel perspective even if you can't tie all the data down to row by row. In this case it was taking to the phone representatives that was the source of true insights!
__________________________________________________
Who? Tim Hart, J. Paul Getty Trust.
What? Measuring By The Mission: Web Analytics at the J. Paul Getty Trust
Why? Content consumption and throwing a feast.
Tim's presentation had a great title but I have to admit that I also went because I am such a huge fan of the Getty Center in LA. Love tram ride up the hill, love the building and architecture, and oh yes the art is great. You should visit if you get a chance.
From Tim's unique presentation (chock full of well placed relevant art) I wanted to share two wonderful nuggets.
It is tough for a site that does not sell anything, and had a broad initial mission, to measure the value of the site to the company (Trust). Tim's first set of analysis was brilliant, figure out content consumption. On this blog we have discussed using tools like ClickTracks to measure this (Glean Macro Insights, point # 4). Tim's computation was simpler and something anyone can do, and should do.
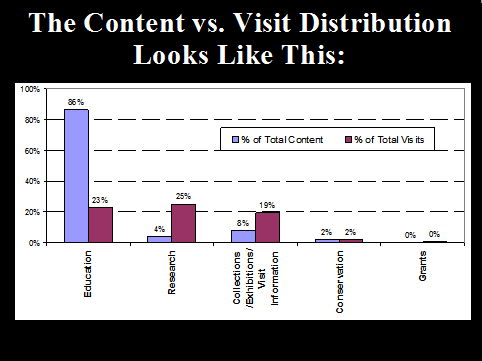
The blue bar shows the type of content on the site: Education, Research, Collections etc. The red bar shows the percent of Visits to that content.
To put it another way "what are the large chunks of content on the site, what are visitors to our website looking at".
I am sure the insights will scream out at you. 86% of the content was being consumed by 23% of the visitors. For 25% of the visitors were looking at 4% of the content (Research). You can see how this translates into a richer understanding of 1) where the website was focused at that time and 2) what customers actually wanted.
Please consider doing this graph of your website. I promise you it will shock you, it has always surprised me for every site I have done it for.
The second nugget was even more delightful: They they ask for bread and water, answer them with a feast.
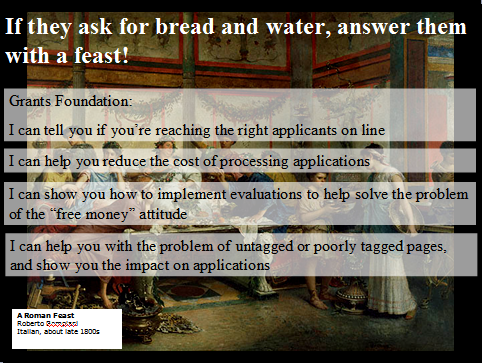
Too often marketers and decision makers ask for reports and stuff that you (the Analyst) in your heart perhaps know adds little value. Don't get disheartened. If they ask for bread, give them a feast.
If they ask for conversion rate, give them segmented conversion rate. If they ask for exits from a page, give them bounce rates and explain why that metric is even more insightful. If they ask for visitors from paid campaigns, add in the number for organic, or better still help them understand cannibalization between paid and organic campaigns. If they ask for HITS, run a survey and give them data for primary purpose and task completion rate of customers.
It is much hard to follow Tim's advice. But if I do then I will not just make sure that I can drive real and meaningful change for my organization but additionally it will help me, I am man enough to admit this, keep my sanity and help move my career forward. It is harder. It is totally worth it.
(I apologize to Tim for taking a small amount of artistic license with his slides, to make them a smidgen more readable in this small size I have made the graph brighter and added a white transparency to the text on the second slide.)
__________________________________________________
What do you all think? Do you agree with these nuggets of wisdom from Kristen, Jodi and Tim? Would you like to add to the conversation? Do you have feedback on my presentation?
Please share your feedback and critique via comments.
[Like this post? For more posts like this please click here.]




May 29th, 2007 at 02:21
Very interesting points indeed.
I also liked very much your views regarding blogging philosophy at the webanalytics.be video of emetrics.
And I like Robbin's idea about the post on why people like you so much ;-) It reminds me of a famous story about Vinicius de Moraes, one of the greatest Brazilian musician/poet. He once proposed a contest for all Brazilian musicians: write a song in his honor! But as Robbin also noted, you are too modest for that :-)
May 29th, 2007 at 05:48
Thanks for this great summary. I hope to be with you on Emetrics Summit next year.
May 29th, 2007 at 06:19
interesting web analytics blog…
good posting this week…
May 29th, 2007 at 07:39
I completely agree with Jodi. Many times we tend to forget the benefit occurring at the background. This is very important to analyze before reaching to any conclusion on any analysis.
I would like to add an example from Pharma field here. While comparing usefulness of two drugs on patients of a particular disease, it is important to analyze for what additional diseases those drugs work. Specially in Asia and Africa where there are many contagious diseases, most of the patients suffer from more than one. From an analysis it is seen that seventy percent of people suffering from Typhoid in Indian Subcontinent is also suffering from one or other form of Pneumonia. So even if drug A performs better for Typhoid, if it performs very poor in Pneumonia the usefulness of that antibiotic is questionable (considering all above mentioned facts).
The analysis is always incomplete if it is not 360 degree. This is one of the most important point he has forwarded. Thank you Jodi.
It is impossible not to admire the great and simple graph by Tim. I am excited to this analysis. I am going to perform this for my site.
Thanks for providing this information, Avinash. Once again an excellent blog entry.
Bhupendra
May 29th, 2007 at 14:06
Great summary Avinash. I was at the summit and I think you just about captured the best pieces. Except of course your own presentation which was amazing – you managed to communicate a complex topic in a way that was easy for anyone to understand.
I have to agree that Kristen's slide is every effective, we have lots of complex tools yet everything happens in Excel and these are great tips. The feast idea from Tim is great, though I have been in organizations that don't appreciate the feast and after a while it gets really hard.
Keep up the great work, am a avid reader.
May 29th, 2007 at 18:46
[...] Avinash summarizes the interesting insights from the recent Emetrics- the online marketing conference. One graph that particularly caught my attention, from a presentation by Tim Hart of J. Paul Getty Trust, is an analysis to determine content consumption of a website. [...]
May 30th, 2007 at 14:42
"Label the tabs."
Do this. Use whole words or at least standard abbreviations. Learn the key words or jargon at the place you are consulting. People love this. A client said, "I didn't know you could do that. It's great."
"They they ask for bread and water, answer them with a feast."
and teach them how to use the metrics they didn't ask for. Why bother? You learn and add to your skill set for next / better job. People love it and they ask you to do more work for them.
Thought provoking as always.
February 13th, 2008 at 00:45
[...] (KPI) or conversion. Content Consumption: Content to Visits Ratio Via Avinash Kauksik's Emetrics EFO Reflections [...]