
The most detailed national vegetation U.S. land-cover map to date was released today by the
U.S. Geological Survey (USGS). The map will enable conservation professionals to identify places in the country with sufficient habitat to support wildlife.
The map, produced by the USGS
Gap Analysis Program (GAP), can be viewed
online and downloaded for free.
“These data are critical for determining the status of biodiversity, as baseline data for assessing climate change impacts, and for predicting the availability of habitat for wildlife,” said John Mosesso,
Gap Analysis Program Manager. “Large datasets of this type are extremely important to land and wildlife managers because they allow for analysis and planning across extensive geographic areas.”
The GAP national land cover data, based on the
NatureServe Ecological Systems Classification, is the most detailed, consistent map of vegetative associations ever available for the United States and will help facilitate the planning and management of biological diversity on a regional and national scale.
GAP’s mission is to keep common species common by providing information on the status of native species. The creation and dissemination of the national landcover dataset and online map viewer furthers that goal by putting crucial information into the hands of conservation professionals. Information about land cover is a key component of effective conservation planning and the management of biological diversity.
Landcover Map Portrays Complex Data
The final version of the landcover map contains 551 Ecological Systems and modified Ecological Systems (the modified ecological systems represent 32 land use classes which depict developed and/or disturbed land cover classes). The map combines data from previous GAP projects in the Southwest, Southeast, and Northwest United States with recently updated California data. For areas of the continental United States where ecological system-level GAP data has not yet been developed, data from the
LANDFIRE project compiled by
Landscope was used. This allows for the construction of a seamless representation of ecological system distributions across the continental United States.
The map also meets natural resources agencies’ need for a way to characterize land cover. Finally, the new map furthers the mission of GAP to promote conservation by providing state, regional, and national assessments of the conservation status of land cover types to resource managers, planners, and policy makers who can use the map and its underlying data to make informed decisions.
Online Map Viewer Shows Data at Multiple Scales
The online map viewing interface has been designed to allow users to explore land cover data at three levels of complexity. Level 1 contains eight classes: grassland, shrubland, forest, aquatic, sparse and barren, recently disturbed, riparian, and human land use. Level 2 contains 43 classes, and incorporates information on elevation and climate. Level 3 contains the full 583 classes. This online tool facilitates exploration of ecological system distribution patterns at multiple scales and allows users to calculate statistics on the types of vegetation occurring within a mapping zone, a state, or a county.
As part of the USGS
National Biological Information Infrastructure (NBII) — a collaborative program coordinated by the USGS to provide increased access to data and information on the nation’s biological resources — GAP data and associated analytical tools have been used in hundreds of applications, from basic research to comprehensive state wildlife plans, and from education projects in schools to ecoregional assessments of biodiversity.
GAP has developed land cover data since the 1980s — initially on a state-by-state basis and more recently on a regional basis. The national land cover map provides seamless coverage across political boundaries, facilitating its use by governmental agencies, researchers, conservation organizations and others.
(Photo: Online Map Viewer for Land-Cover Classification Map. The GAP (GAP Analysis Program) online map viewer shows land cover classifications at three levels. Courtesy of the U.S. Geological Survey Multimedia Gallery)
(This technical announcement was originally published by the U.S. Geological Survey)


 U.S. Geological Survey (USGS) Scientists Steve Hilburger (Program Analyst, USGS Wildlife Program), Sam Droege (Wildlife Biologist, USGS Patuxent Wildlife Research Center and Coordinator of the USGS Native Bee Inventory and Monitoring Laboratory), and Elizabeth Sellers (Manager, Pollinators Project of the USGS National Biological Information Infrastructure) will showcase examples of USGS pollinator research and biological informatics tools at the Inter-departmental National Pollinator Week Exhibit hosted by the U.S. Department of Agriculture (USDA) beside the National Mall (adjacent to the USDA People's Garden) in Washington D.C. on June 21, 2010. This event builds on the cooperative energy initiated at an inter-departmental pollinator collaboration meeting hosted by USDA in March, and provides an opportunity for more pollinator-related information exchange and discussion among Federal agencies and with the public. National Pollinator Week is from June 21-27, 2010.
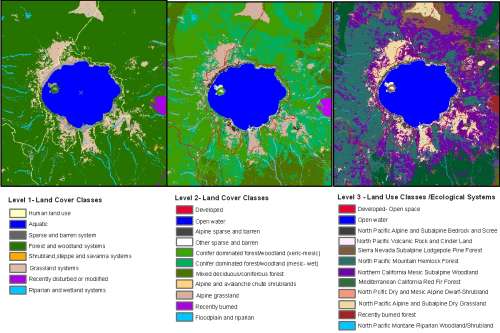 The most detailed national vegetation U.S. land-cover map to date was released today by the U.S. Geological Survey (USGS). The map will enable conservation professionals to identify places in the country with sufficient habitat to support wildlife.


