Southwestern Appalachians
By Terry L. Sohl 1
Click to see available downloads for this ecoregion

Figure 1. The underlying land cover is from the 1992
National Land Cover Database (Vogelmann and others, 2001). The 10 km x 10 km
sample sites for the Land Cover Trends project are shown in yellow. Click to enlarge.
Ecoregion Description
The Southwestern Appalachians
ecoregion stretches from north-central Alabama through southeastern Kentucky (fig. 1) and covers approximately 35,350 km2 (13,650 mi2).
Much of the ecoregion consists of open low mountains, but some portions of the
ecoregion exhibit steep slopes with local relief of up to 300 m. Approximately
three-fourths of the ecoregion is covered by forest, primarily mixed oak
communities and shortleaf pines (fig. 2). Agricultural lands are found on lower
slopes and valley floors, with the greatest concentration in northeastern Alabama. Mining is a locally significant land use activity, especially in the southern
part of the ecoregion where the local abundance of coal, limestone, and iron
deposits led to a booming steel industry in the first half of the twentieth
century. No large cities (populations > 100,000) are found completely
within the ecoregion’s borders, but the greater Birmingham, Huntsville, and Chattanooga metropolitan areas are partially within the ecoregion.
Contemporary Land Cover Change (1973 to 2000)
Overall spatial change in the
ecoregion (i.e., the percentage of area that changed at least one time from
1973 to 2000) was 13.9 percent (table 1), a moderately high level of change
compared to most Eastern United States ecoregions (fig. 3). The total amount
of change increased with each successive time period (table 2). When
normalized to account for varying time period lengths, change was lower during
the 1973 to 1980 period and higher and relatively steady for the last three
time periods (fig. 4).
No individual land cover class
changed by more than 2.6 percent of the total ecoregion area between 1973 and
2000 (table 3). However, two factors driving land cover conversion were
notable in the ecoregion: (1) forestry activity and (2) mining activity. Forest cover consistently showed some of the largest net change, with fairly consistent
declines in all four time periods (fig. 5). The conversion from forest to
mechanically disturbed land was the most common land cover conversion for all
four time periods, while mechanically disturbed to forest land (representing
regeneration of cut forest lands) was the second or third most common conversion
(table 4). In sum, forestry-related activities (both cutting and
regeneration) was clearly one of the most significant factors affecting land
cover in the ecoregion for all time periods (fig. 6 and 7).
Mining activity was the second most
important factor driving land cover change in the ecoregion (fig. 6). Much of
the surface mining in the ecoregion, especially in northern Alabama, is for
coal, iron, and limestone--all primary materials required for the production of
steel. Birmingham, Alabama, which is partially contained within the southern
portion of the ecoregion, was once known as the “Pittsburgh of the South.” The
related mining and steel industries have been key components of much of the
area’s economy in the twentieth century.
However, the local steel industry
began to decline in the second half of the twentieth century. Imports of
cheaper foreign steel into the United States increased dramatically after 1980,
contributing to additional closures of steel facilities in the area (Gerard,
2001). With these declines, local demand for the raw materials of the industry
also declined. As production halted at the surface mines, many were
revegetated with grass/shrubland and eventually reverted back to forest lands.
While 700 km2 of newly mined lands were established between 1973 to
2000, more than 1000 km2 of mined lands were reclaimed during the
same time period, resulting in a net decline of more than 300 km2 (fig.
8). The most significant decline was between 1980 and 1986 when mined land
area dropped by 50 percent within the ecoregion, with very minor declines noted
for the last two time periods (table 3 and fig. 5). Changes related to mined
land reclamation (including mined lands reclaimed to grass/shrublands and
grass/shrublands eventually reverting to forest) were significant land cover conversions
for all time periods (table 4).
Other land cover conversions were
generally minor in the ecoregion. Developed lands did steadily increase
throughout the study period, resulting in a net gain of more than 300 km2
from 1973 to 2000. Urban centers on the fringe of the ecoregion (e.g., Birmingham) either exhibited only minor population gains or even decreased in population
during the study period, but growth in the surrounding suburbs was the primary
driver behind the net gain in developed land area.
References:
Gerard, L.W.,
2001, Section 232 Investigation into the effects on national security of
imports of iron ore and semi-finished steel: Comments submitted to the
U.S. Department of Commerce, United Steelworkers of America.
Vogelmann, J.E., Howard, S.M., Yang, L., Larson, C.R., Wylie,
B.K., and Van Driel, N., 2001, Completion of the 1990s National Land Cover Data
for the conterminous United States from Landsat Thematic Mapper data and
ancillary data sources: Photogrammetric Engineering & Remote Sensing, v. 67,
p. 650-662.
Table 1. Percentage of the ecoregion touched by change
[86.1 percent of all pixels in the ecoregion were unchanged
throughout the study period, while 13.9 percent were touched by change one or
more times]
|
|
Overall
|
Number of changes
|
|
|
spatial change
|
1
|
2
|
3
|
4
|
|
Percent of ecoregion
|
13.9
|
6.3
|
6.4
|
1.1
|
0.1
|
Table 2. Overall change estimates and normalized annual
change for each of the four time periods
[Margin of error at an 85 percent confidence interval]
|
|
Period
|
|
|
1973-1980
|
1980-1986
|
1986-1992
|
1992-2000
|
|
Total change (% of
ecoregion)
|
3.7%
|
5.5%
|
6.2%
|
7.3%
|
|
Margin of error (85%
confidence level)
|
+/-1.2%
|
+/-1.5%
|
+/-1.8%
|
+/-2.3%
|
|
Average annual rate of
change (%/year)
|
0.5%
|
0.9%
|
1.0%
|
0.9%
|
Table 3. Percentages of each land cover class for the five
mapped dates
|
|
1973
|
1980
|
1986
|
1992
|
2000
|
Net change 1973-2000
|
|
Land-use/land-cover class
|
km²
|
%
|
km²
|
%
|
km²
|
%
|
km²
|
%
|
km²
|
%
|
km²
|
%
|
|
Water
|
165
|
0.5
|
175
|
0.5
|
201
|
0.6
|
209
|
0.6
|
221
|
0.6
|
56
|
0.2
|
|
Developed
|
634
|
1.8
|
652
|
1.8
|
736
|
2.1
|
824
|
2.3
|
955
|
2.7
|
321
|
0.9
|
|
Mechanically disturbed
|
384
|
1.1
|
314
|
0.9
|
543
|
1.5
|
819
|
2.3
|
1020
|
2.9
|
636
|
1.8
|
|
Mining
|
551
|
1.6
|
600
|
1.7
|
295
|
0.8
|
281
|
0.8
|
233
|
0.7
|
-318
|
-0.9
|
|
Naturally barren
|
1
|
0.0
|
1
|
0.0
|
1
|
0.0
|
1
|
0.0
|
1
|
0.0
|
0
|
0.0
|
|
Forest
|
27583
|
78.0
|
27425
|
77.6
|
27186
|
76.9
|
26875
|
76.0
|
26635
|
75.4
|
-948
|
-2.7
|
|
Grassland/Shrubland
|
139
|
0.4
|
305
|
0.9
|
549
|
1.6
|
528
|
1.5
|
467
|
1.3
|
327
|
0.9
|
|
Agriculture
|
5823
|
16.5
|
5803
|
16.4
|
5772
|
16.3
|
5745
|
16.3
|
5750
|
16.3
|
-74
|
-0.2
|
|
Wetland
|
60
|
0.2
|
60
|
0.2
|
60
|
0.2
|
60
|
0.2
|
59
|
0.2
|
-1
|
0.0
|
|
Non-mechanically disturbed
|
0
|
0
|
7
|
0
|
0
|
0.0
|
0
|
0.0
|
0
|
0.0
|
0
|
0.0
|
Table 4. The five most common land cover conversions for
each of the four time periods
|
|
|
|
Area changed
|
% of all
|
|
Period
|
From class
|
To class
|
(km2)
|
changes
|
|
1973-1980
|
Forest
|
Mechanically disturbed
|
302
|
23
|
|
|
Mechanically disturbed
|
Forest
|
295
|
22
|
|
|
Forest
|
Mining
|
239
|
18
|
|
|
Mining
|
Forest
|
115
|
9
|
|
|
Mining
|
Grassland/Shrubland
|
101
|
8
|
|
|
Other classes
|
Other classes
|
261
|
20
|
|
|
|
|
1,313
|
100
|
|
|
|
|
|
|
|
1980-1986
|
Forest
|
Mechanically disturbed
|
531
|
27
|
|
|
Mining
|
Grassland/Shrubland
|
298
|
15
|
|
|
Mechanically disturbed
|
Forest
|
256
|
13
|
|
|
Grassland/Shrubland
|
Forest
|
187
|
10
|
|
|
Mining
|
Forest
|
154
|
8
|
|
|
Other classes
|
Other classes
|
505
|
26
|
|
|
|
|
1,931
|
100
|
|
|
|
|
|
|
|
1986-1992
|
Forest
|
Mechanically disturbed
|
789
|
36
|
|
|
Mechanically disturbed
|
Forest
|
421
|
19
|
|
|
Grassland/Shrubland
|
Forest
|
283
|
13
|
|
|
Mining
|
Grassland/Shrubland
|
136
|
6
|
|
|
Forest
|
Mining
|
134
|
6
|
|
|
Other classes
|
Other classes
|
436
|
20
|
|
|
|
|
2,199
|
100
|
|
|
|
|
|
|
|
1992-2000
|
Forest
|
Mechanically disturbed
|
1,003
|
39
|
|
|
Mechanically disturbed
|
Forest
|
726
|
28
|
|
|
Grassland/Shrubland
|
Forest
|
244
|
9
|
|
|
Mining
|
Grassland/Shrubland
|
136
|
5
|
|
|
Forest
|
Mining
|
94
|
4
|
|
|
Other classes
|
Other classes
|
384
|
15
|
|
|
|
|
2,587
|
100
|
|
Overall:
|
|
|
|
|
|
1973-2000
|
Forest
|
Mechanically disturbed
|
2,626
|
33
|
|
|
Mechanically disturbed
|
Forest
|
1,698
|
21
|
|
|
Grassland/Shrubland
|
Forest
|
750
|
9
|
|
|
Mining
|
Grassland/Shrubland
|
671
|
8
|
|
|
Forest
|
Mining
|
610
|
8
|
|
|
Other classes
|
Other classes
|
1,675
|
21
|
|
|
|
|
8,030
|
100
|

Figure 1. The underlying land cover is from the 1992
National Land Cover Database (Vogelmann and others, 2001). The 10 km x 10 km
sample sites for the Land Cover Trends project are shown in yellow.

Figure 2. Forest covers approximately three-fourths of the
ecoregion, and is the prevalent land cover on most hilly and mountainous
slopes.

Figure 3. The overall spatial change in all Eastern U.S. ecoregions. Each bar chart shows the proportion of the ecoregion that
experienced change on 1, 2, 3, or 4 dates.

Figure 4. Estimates of land cover change per time interval
normalized to annual rates of change.

Figure 5. Per period net change for each mapped land cover
class. Cylinder areas above the zero axis represent net gains for a land cover
class, while areas below represent net losses.

Figure 6. Forestry activity (forest cutting and
regeneration) and mining activity (new mining and mining reclamation) account
for the vast majority of change in the ecoregion.
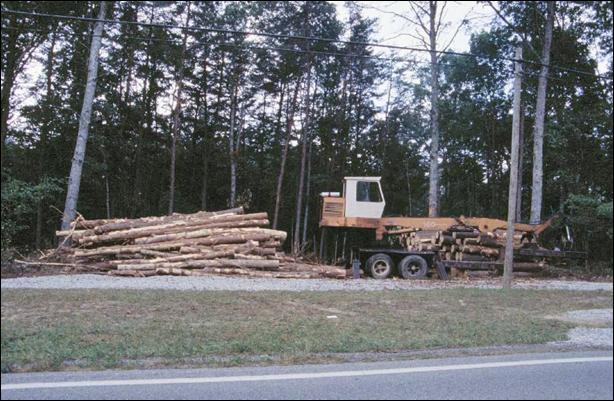
Figure 7. Over 2,600 km2 of forest was cut
between 1973 and 2000 as part of timber harvesting operations in the
ecoregion. The majority of cut lands related to the timber industry were
replanted or allowed to naturally regenerate to forest.

Figure 8. Mining activity has been an important component
of the economy in much of the ecoregion. However, actively mined lands have
declined between 1973 and 2000, and many older mines have either been reclaimed
or allowed to naturally revegetate.

