Western Allegheny Plateau
By Kristi L. Sayler 1
Click to see available downloads for this ecoregion
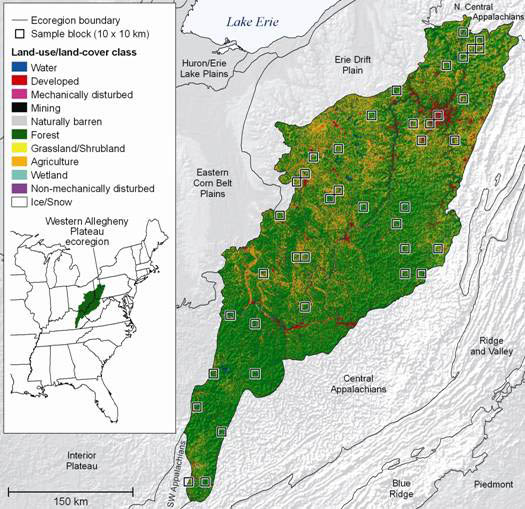
Figure 1. Western Allegheny Plateau and surrounding ecoregions.
The 40 randomly selected 100-km² sample blocks are shown along with land
use/land cover from the 1992 National Land Cover Dataset.
Ecoregion Description
The Western Allegheny Plateau ecoregion, as defined by Omernik (1987),
covers portions of eastern Ohio, southwestern Pennsylvania, northwestern West Virginia, and a small piece of northeastern Kentucky. The ecoregion covers
approximately 84,500 km2 (32,630 mi2) (fig. 1) and is
about 72 percent forest and 23 percent agriculture. The forest area is mostly
mixed oak and mixed temperate forests that still exist today on most of the
remaining rounded hills. Dairy, livestock, and general farming, as well as
residential developments, are concentrated in the valleys (fig. 2). Pittsburgh, Pennsylvania is the largest urban area in the ecoregion and has shown some
expansion despite an overall population decline in the ecoregion. Coal mining
is still active in the Pennsylvania, West Virginia, and Kentucky portions of
the ecoregion and in Ohio to a lesser extent (fig. 3 and 4). The Ohio and Allegheny River systems in the ecoregion have been adversely affected by acid mine
drainage and industrial pollution, which has caused degradation of the stream
habitats and loss of fish species (Cooper, 1983). Water quality has improved
somewhat, and a few species have returned.
Contemporary Land Cover Change (1973 to 2000)
The overall spatial change from 1973 to 2000 for the
Western Allegheny Plateau was 6.0 percent, which was a low amount of change
compared to other ecoregions in the East (fig. 5). An estimated 4 percent of
the ecoregion changed only one time. The other 2 percent changed multiple
times and was likely the result of coal mining and timber harvesting activities
(table 1), which tend to cycle through multiple land cover transitions.
The change per time period ranged from 1.9 to 2.3
percent with margin of errors ranging from 0.4 to 0.7 percent (table 2). The average annual
rates of change show that the 1986 to 1992 period had the greatest amount of
change with a rate of 0.4 percent per year (table 2 and fig. 6). This was a
period of transition for the coal mining regions of Ohio and West Virginia. Ohio coal production was slowing down due to
increasing regulations on surface mining and higher environmental emission
standards (Crowell, 1995), whereas West Virginia saw an increase in the
extraction of low-sulfur coal (Fox, 1999) in order to meet federal standards
from the 1990 Clean Air Act.
The majority of land cover classes in the Western
Allegheny Plateau experienced little change during the study period (table 3).
Forest and agriculture both showed steady declines since 1973, while developed
lands increased during each time period resulting in an increase of 376 km2 (147 mi2) between 1973 and 2000 (fig. 7).
Grassland/shrubland increased from 1.5 percent of the ecoregion area in 1973 to
2.6 percent in 2000.
Mining
and forest clearing activities caused the most prominent net land cover changes
in the Western Allegheny Plateau ecoregion. Net changes in the land cover
classes fluctuated throughout the 1973 to 2000 period (fig. 8). Grassland/shrubland had net increases in all four
time periods, while mining and forest showed decreases in most time periods.
With a few exceptions for timber cutting, the top
three leading land cover transitions during each time period were related to
coal mining activities in the ecoregion (i.e., mining to grassland/shrubland,
grassland/shrubland to forest, or forest to mining). The top seven transitions
contained at least 75 percent of the total change for each time period and
affected between 1,090 and 1,400 km2 of land area (table 4).
References
Cooper, E.L., 1983, Fishes of Pennsylvania and the northeastern United States: University Park, Pa., Pennsylvania State
University Press, 183 p.
Crowell, D.L., 1995, History of the coal-mining
industry in Ohio: Ohio Division of Geological Survey Bulletin 72, 204 p.
Fox, J., 1999,
Mountaintop removal in West Virginia—an environmental sacrifice zone:
Organization and Environment, v. 12, no. 2, p. 163-183.
Omernik, J.M., 1987, Ecoregions of the conterminous United States: Annals of the Association of American Geographers, v. 77, no. 1, p. 118-125.
Table 1. Amount of overall
spatial change detected in the ecoregion and proportion of the ecoregion that
experienced change during one or multiple time periods
|
|
Overall
|
Number of changes
|
|
|
spatial change
|
1
|
2
|
3
|
4
|
|
Percent of
ecoregion
|
6.0
|
4.0
|
1.8
|
0.2
|
0.0
|
Table 2. Raw estimates of
percent change in the ecoregion computed for each of the four time periods and
associated margin of error at a 85 percent level of confidence
|
|
Period
|
|
|
1973-1980
|
1980-1986
|
1986-1992
|
1992-2000
|
|
Total
change (% of ecoregion)
|
2.1%
|
2.0%
|
2.3%
|
1.9%
|
|
Margin of
error (85% confidence level)
|
+/-0.6%
|
+/-0.8%
|
+/-0.6%
|
+/-0.5%
|
|
Average
annual rate of change (%/year)
|
0.3%
|
0.3%
|
0.4%
|
0.2%
|
Table 3. Proportion of the
ecoregion covered by each land cover class during each of the five mapped dates
|
|
1973
|
1980
|
1986
|
1992
|
2000
|
Net change 1973-2000
|
|
Land-use/land-cover
class
|
km²
|
%
|
km²
|
%
|
km²
|
%
|
km²
|
%
|
km²
|
%
|
km²
|
%
|
|
Water
|
1079
|
1.3
|
1116
|
1.3
|
1118
|
1.3
|
1120
|
1.3
|
1126
|
1.3
|
47
|
0.1
|
|
Developed
|
5909
|
7.0
|
5976
|
7.1
|
6034
|
7.1
|
6192
|
7.3
|
6358
|
7.5
|
449
|
0.5
|
|
Mechanically
disturbed
|
75
|
0.1
|
84
|
0.1
|
74
|
0.1
|
245
|
0.3
|
239
|
0.3
|
165
|
0.2
|
|
Mining
|
892
|
1.1
|
1024
|
1.2
|
863
|
1.0
|
574
|
0.7
|
511
|
0.6
|
-381
|
-0.4
|
|
Barren
|
0
|
0.0
|
0
|
0.0
|
0
|
0.0
|
0
|
0.0
|
0
|
0.0
|
0
|
0.0
|
|
Forest
|
54674
|
64.5
|
54298
|
64.1
|
54387
|
64.2
|
54159
|
63.9
|
53942
|
63.7
|
-732
|
-0.9
|
|
Grassland/Shrubland
|
1300
|
1.5
|
1581
|
1.9
|
1683
|
2.0
|
1965
|
2.3
|
2201
|
2.6
|
901
|
1.1
|
|
Agriculture
|
20682
|
24.4
|
20524
|
24.2
|
20445
|
24.1
|
20349
|
24.0
|
20216
|
23.9
|
-465
|
-0.5
|
|
Wetland
|
128
|
0.2
|
134
|
0.2
|
134
|
0.2
|
134
|
0.2
|
145
|
0.2
|
17
|
0.0
|
|
Non-mechanically
disturbed
|
0
|
0.0
|
0
|
0.0
|
0
|
0.0
|
0
|
0.0
|
0
|
0.0
|
0
|
0.0
|
Table 4. Leading land cover
conversions during each of the four time periods
|
|
|
|
Area changed
|
% of all
|
|
Period
|
From
class
|
To
class
|
(km2)
|
changes
|
|
1973-1980
|
Forest
|
Mining
|
331
|
19
|
|
|
Mining
|
Grassland/Shrubland
|
258
|
15
|
|
|
Grassland/Shrubland
|
Forest
|
201
|
11
|
|
|
Forest
|
Grassland/Shrubland
|
174
|
10
|
|
|
Forest
|
Agriculture
|
119
|
7
|
|
|
Agriculture
|
Grassland/Shrubland
|
105
|
6
|
|
|
Agriculture
|
Mining
|
96
|
5
|
|
|
Other
classes
|
Other
classes
|
475
|
27
|
|
|
|
|
1,759
|
100
|
|
|
|
|
|
|
|
1980-1986
|
Grassland/Shrubland
|
Forest
|
414
|
24
|
|
|
Mining
|
Grassland/Shrubland
|
402
|
23
|
|
|
Forest
|
Mining
|
202
|
12
|
|
|
Forest
|
Agriculture
|
113
|
7
|
|
|
Agriculture
|
Mining
|
82
|
5
|
|
|
Agriculture
|
Grassland/Shrubland
|
74
|
4
|
|
|
Forest
|
Grassland/Shrubland
|
69
|
4
|
|
|
Other
classes
|
Other
classes
|
361
|
21
|
|
|
|
|
1,717
|
100
|
|
|
|
|
|
|
|
1986-1992
|
Mining
|
Grassland/Shrubland
|
372
|
20
|
|
|
Grassland/Shrubland
|
Forest
|
238
|
12
|
|
|
Forest
|
Mechanically
disturbed
|
223
|
12
|
|
|
Forest
|
Mining
|
174
|
9
|
|
|
Forest
|
Grassland/Shrubland
|
159
|
8
|
|
|
Mining
|
Forest
|
124
|
7
|
|
|
Agriculture
|
Forest
|
110
|
6
|
|
|
Other
classes
|
Other
classes
|
507
|
27
|
|
|
|
|
1,907
|
100
|
|
|
|
|
|
|
|
1992-2000
|
Forest
|
Mechanically
disturbed
|
214
|
13
|
|
|
Mining
|
Grassland/Shrubland
|
202
|
13
|
|
|
Grassland/Shrubland
|
Forest
|
141
|
9
|
|
|
Forest
|
Grassland/Shrubland
|
138
|
9
|
|
|
Mechanically
disturbed
|
Forest
|
135
|
8
|
|
|
Agriculture
|
Forest
|
133
|
8
|
|
|
Forest
|
Mining
|
127
|
8
|
|
|
Other
classes
|
Other
classes
|
524
|
32
|
|
|
|
|
1,614
|
100
|
|
Overall:
|
|
|
|
|
|
1973-2000
|
Mining
|
Grassland/Shrubland
|
1,234
|
18
|
|
|
Grassland/Shrubland
|
Forest
|
993
|
14
|
|
|
Forest
|
Mining
|
835
|
12
|
|
|
Forest
|
Mechanically
disturbed
|
580
|
8
|
|
|
Forest
|
Grassland/Shrubland
|
540
|
8
|
|
|
Forest
|
Agriculture
|
391
|
6
|
|
|
Agriculture
|
Forest
|
381
|
5
|
|
|
Other
classes
|
Other
classes
|
2,043
|
29
|
|
|
|
|
6,997
|
100
|

Figure 1. Western Allegheny Plateau and surrounding ecoregions.
The 40 randomly selected 100-km² sample blocks are shown along with land
use/land cover from the 1992 National Land Cover Dataset.
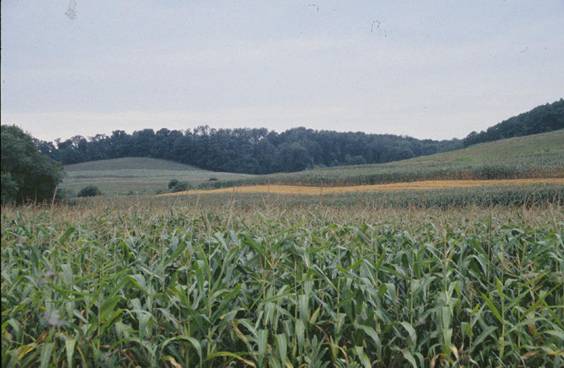
Figure 2. Forested hills
with corn and oats in the valley.

Figure 3. Coal mining
southwest of Brookville, Pennsylvania.
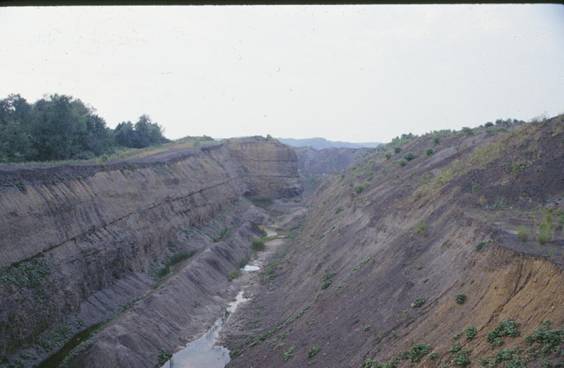
Figure 4. Coal mining south
of East Palestine, Ohio.
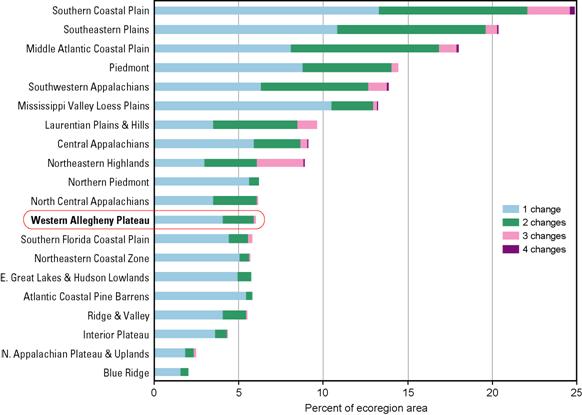
Figure 5. The overall
spatial change in all Eastern U.S. ecoregions. Each bar chart shows the
proportion of the ecoregion that experienced change on 1, 2, 3, or 4 dates.
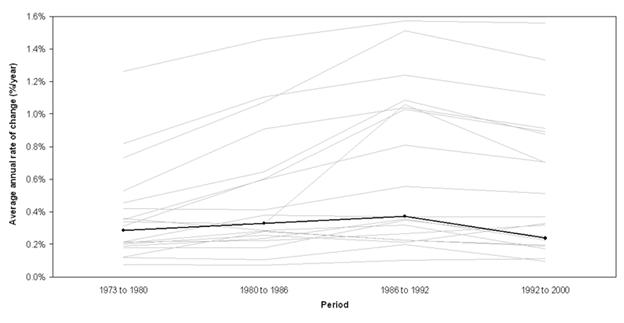
Figure 6. The estimates of
land cover change per time interval normalized to an annual rate of change. The
Western Allegheny Plateau is highlighted in black.
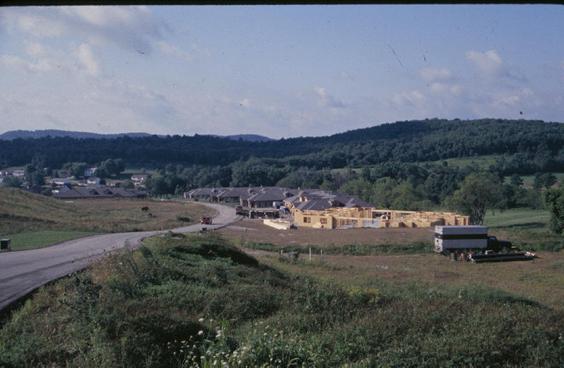
Figure 7. Suburban
development southeast of Pittsburgh, Pennsylvania.
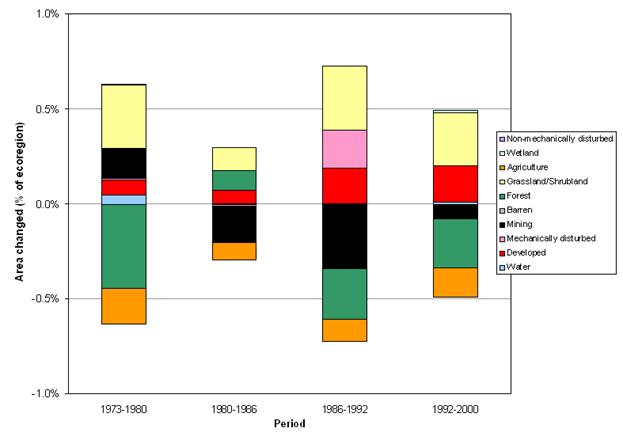
Figure 8. Per period net
change for each land cover class. Areas above zero represent net gains for a
land cover class, while areas below represent a net loss.

