Wildfire and Drought

Prolonged drought lowers the normal moisture content of debris in forests and other wild lands, creating an overload of dry fuel in terrestrial ecosystems and increasing the potential for large, destructive wildfires. Prolonged dry spells tend to increase the intensity of forest fires as moisture content is rarely influenced by single precipitation events.

A popular measure of dryness is the Palmer Drought Severity Index, which factors temperature and rainfall information to estimate dryness for a localized area.

Palmer Drought Severity Index
[Image: U.S. Geological Survey]

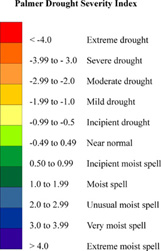
Using the Palmer index, normal conditions fall near zero, while "extreme drought" registers at minus 4 and "extremely moist spell" registers at positive 4.

Other ways of monitoring drought in the Southeast include measuring water flow in rivers and streams. Even when precipitation is normal, water stored in the earth can be low during what is called a hydrologic drought and many rivers, streams, and wells register low flows. Streamflow maps can illustrate the extent of hydrologic drought.

Prolonged periods without rain stress plant communities, making them more susceptible to insects and disease and less competitive with invasive species. Dead and dying vegetation contributes further to the problem of excess dry fuel. Dry conditions also prevent use of prescribed fire, often used control invasive species.

Resources:

Bullet pointUnderstanding and Defining Drought

Bullet pointFire Weather Forecasts

Bullet pointFire Weather Composite Maps

Bullet pointDay 3-8 Fire Weather Outlooks

Bullet pointNational Weather Service Fire Weather Page


U.S. Drought Monitor Data

Each Thursday, the National Weather Service Climate Prediction Center, the United States Department of Agriculture, the National Drought Mitigation Center in Lincoln, Nebraska, and NOAA's National Climatic Data Center, issues a weekly drought assessment called the United States Drought Monitor. Maps and data from the U.S. Drought Monitor's South and Southeast Regions are presented below.


U.S. Drought Monitor - South and Southeast Region Data


U.S. Drought Monitor South - Click to View
Click image above for larger size
[Image: The U.S. Drought Monitor]

More U.S. Drought Monitor: South Resources


U.S. Drought Monitor Southeast - Click to View
Click image above for larger size
[Image: The U.S. Drought Monitor]

More U.S. Drought Monitor: Southeast Resources

The NBII Program is administered by the Biological Informatics Program of the U.S. Geological Survey
About NBII | Accessibility Statement | NBII Disclaimer, Attribution & Privacy Statement | FOIA
Science.gov Logo       USGS Logo       USAgov Logo