Blue Ridge Mountains
By Janis L. Taylor, Rachel Kurtz 1
Click to see available downloads for this ecoregion

Figure 1. The Blue Ridge ecoregion. The underlying land cover is taken from the 1992
National Land Cover Database (Vogelmann and others, 2001).
Ecoregion Description
The
Blue Ridge Mountains ecoregion is located in the southern Appalachian Mountains,
and is the easternmost of the Appalachian highland ecoregions (fig. 1). At more
than 1100 km long and ranging between 8 and 80 km wide, it covers approximately
47,791 km2 (18,452 mi2). The ecoregion is primarily
forested with cool summers and cold winters. Almost one-third of the ecoregion
is under public ownership, including two National parks—the Great Smoky
Mountains National Park and Shenandoah National Park, the Blue Ridge Parkway,
seven National forests, and 29 wilderness areas (Nash, 1999). Areas within the Great Smoky Mountains National Park have been declared an International Biosphere Reserve
because of the high number of endemic species of flora and fauna (Bousquet,
2000). The overall landscape is a mosaic of large continuous blocks of forest
intermixed with agriculture and dotted with small parcels of developed land.
Change from 1973 to 2000
The
Blue Ridge Mountains ecoregion is stable. The overall areal change in land
cover—the percentage of land area within the ecoregion where land cover changed
at least once between 1973 and 2000—was 2.0 percent, the lowest of all Eastern U.S. ecoregions (fig. 2). Three fourths of the converted land changed only one
time, while one-fourth changed twice (table 1).
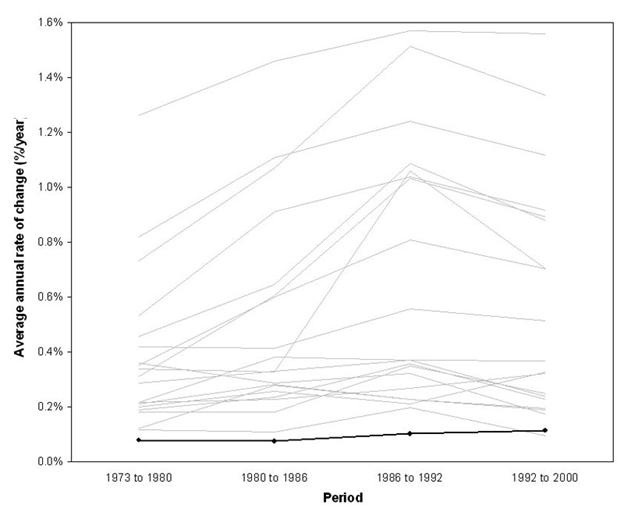
Estimated
changes in each of the time periods selected for this study were low, ranging
from 0.5 percent in the 1973 to 1980 period to 0.9 percent in the 1992 to 2000
period (table 2). The estimates of land cover change have
an associated margin of error that is shown in table 2. After normalizing
the land cover change per period to an annual rate of change to avoid
comparison of unequal time intervals, change was lowest in the 1980 to 1986
period, at 0.07 percent per year, and highest in the 1992 to 2000 period, at
0.11 percent per year (fig. 3).
Three
classes of land cover (forest, agricultural land, and developed land) account
for 99 percent of the ecoregion. Table 3 lists the percentage of each
individual land cover class during each of the five mapped dates. Forest is the most common cover and makes up nearly 80 percent of the ecoregion. Over the
entire study period, forest cover decreased from 79.6 percent of the ecoregion
in 1972 to 78.3 percent in 2000, a 1.3 percent decrease. Changes to forest
cover included both unidirectional conversions and cyclical conversions during
the study period. Some forest was converted to developed land, while some was
harvested for timber, and then returned to forest in subsequent years.
Agriculture was the second most common land cover, occupying approximately 13.7
percent of the ecoregion (fig.4). Over the entire study period, agricultural
cover remained relatively stable with minor gains and losses in each time
period. Developed land, the third most common land cover, increased 1.1
percent, from 6.1 percent in 1972 to 7.2 percent in 2000 (figs. 5 and 6).
The
transition from forest to developed land dominated three of the four periods
(1973 to 1980, 1980 to 1986, and 1992 to 2000) (table 4) (fig. 7). The largest
conversion of this type occurred from 1992 to 2000, when 192 km2 of
forest was converted to some type of developed land (fig. 8). Between 1986 and
1992, the major land cover conversion was from forest to mechanically
disturbed, when 87 km2 of forest was cut, a likely result of
commercial timber harvesting for pulpwood used to produce paper and packaging
materials (SAMAB 1996).
Overall,
little change occurred in the ecoregion between 1973 and 2000. Most of the land
cover change that did occur was to developed land. Existing urban areas
expanded and exurban development increased. According to the U.S. Census Bureau
(2000), seasonal housing has been increasing in high proportions in Avery and Watuga Counties, North Carolina. Between 1970 and 2000, population within the ecoregion
increased by 63 percent, almost double the national increase of 34 percent. The
ecoregion is also experiencing an increase in tourism and recreational
activities such as golf and skiing. This amenity-rich area draws seasonal
residents in the summer for a respite from the warmer and more humid South and
in the winter for snow-related, winter recreation (Gade and others, 2002).
References
Bousquet, Woodward S., 2000, Outdoor Recreation, in
Orr, Douglas M., Jr., and Stuart, A.W., The North Carolina atlas—portrait for a
new century: Chapel Hill, N.C., The University of North Carolina Press, p.
409-433.
Gade, O., Rex, A.B., Young, J.E., and Perry, L.B., 2002, North Carolina—people and environments 2d ed.: Boone, N.C., Parkway Publishers, Inc, 602
p..
Nash, Steve, 1999, Blue Ridge 2020—an owner's manual:
Chapel Hill, N.C., The University of North Carolina Press, 211 p.
Southern Appalachian Man and the Biosphere (SAMAB),
1996, The Southern Appalachian Aassessment: Atlanta, Ga., U.S. Department of
Agriculture, Forest Service, Southern Region, vols. 1-5.
U.S. Census Bureau, 2000, GCT-H5 General housing
characteristic—2000, accessed November 11, 2004,
Vogelmann, J.E, Howard, S.M., Yang, L., Larson,
C.R., Wylie, B.K., and Van Driel, N., 2001, Completion of the 1990s National
Land Cover Data Set for the coterminous United States from Landsat Thematic
Mapper data and ancillary data sources: Photogrammetric Engineering &
Remote Sensing, v. 61, p. 650-662.