Central Appalachians
By Kristi L. Sayler 1
Click to see available downloads for this ecoregion

Figure1. Central Appalachians and surrounding ecoregions. The 32 randomly selected
100-km sample blocks are shown along with land use/land
cover from the 1992 National Land Cover Dataset.
Ecoregion Description
The Central Appalachian ecoregion stretches from central Pennsylvania through West Virginia, Maryland, Virginia, and Kentucky and into northern Tennessee (Omernik, 1987). The ecoregion covers approximately 59,800 km2 (23,089
mi2) (fig. 1) and is about 89 percent forested. It is primarily a
high, dissected, rugged plateau composed of sandstone, shale, conglomerate, and
coal. Local relief varies from less than 15 m (50 ft) to more than 594 m
(1,950 ft), and the highest mountain elevations range from about 366 to 1,402 m
(1,200 to 4,600 ft) (Woods and others, 1996). The rugged terrain, cool
climate, and infertile soils limit agriculture and result in a mostly forested
land cover. A mixed mesophytic forest with areas of Appalachian oak and
northern hardwood forest cover the high hills and low mountains (fig. 2). Coal
mining is common in the ecoregion and is one of the major drivers of change (fig.
3). The agricultural lands of the ecoregion are located in the valleys, where
the growing season can last up to 165 days (Woods and others, 1996) (fig. 4).
The main agricultural activities include livestock and dairy farming and
Christmas trees growing on plantations. The climate of the Central
Appalachians is variable because of topographic influences in the region.
Precipitation is distributed rather uniformly throughout the year, but the late
summer and early fall seasons tend to be drier, with an average annual
precipitation of about 1,125 mm (45 in) (Raitz and Ulack, 1984).
Contemporary Land Cover Change (1973 to 2000)
The overall spatial change in the Central
Appalachians was 9.1 percent from 1973 to 2000 (fig. 5). This was a moderate
amount of change in comparison to the other eastern ecoregions. Most of the
change was closely tied to coal mining in the ecoregion. An estimated 5.9
percent of the ecoregion changed only once, and the percentage of area
undergoing multiple changes was estimated at 3.2 percent (table 1). Most of the
multiple-change areas reflected different stages of land cover, including
forest, mechanically disturbed, mining, and grassland/shrubland, as coal mines
became established, expanded, an then eventually closed down and were abandoned
or reclaimed. The sample blocks with the highest change were concentrated in
coal mining regions. The total change per time period ranged from 2.5 percent
to 4.1 percent (table 2). Our average annual rates of change show that the 1986
to 1992 period had the highest rate of change with a rate of 0.6 percent per
year (table 2 and fig. 6). This was likely because of a resurgence of coal
mining in West Virginia in the 1990s (Fox, 1999).
The mining, grassland/shrubland, and forest classes had the most change
during our study period (table 3). Mining nearly doubled in area from 1.7
percent of the ecoregion in 1973 to 3.2 percent in 2000. Conversely, forest
decreased from 86.6 percent to 83.3 percent (fig. 7). The grassland/shrubland
category increased throughout the study period, as old mining areas
transitioned back to forest. Agriculture decreased slightly because of
abandonment and subsequent conversion back to forest. Developed lands
increased slightly over the four time periods, in contrast to the population of
the ecoregion, which has steadily decreased since the 1980s (fig. 8).
Figure 9 shows the net changes in land cover classes in the ecoregion
over the study period. The changes were relatively minor until the 1992 to
2000 period when there was resurgence in forest clearing for mining
activities. The leading land cover conversions were also all related to coal
mining in the ecoregion. Forest to mining was the top conversion during all
time periods, ranging from 450 to 1,099 km2 (table 4). During every
time period, at least 65 percent of all changes were connected to mining
activities in the ecoregion.
References
Fox, J., 1999, Mountaintop removal in West Virginia—an environmental sacrifice zone: Organization and Environment, v. 12, no. 2,
p. 163-183.
Omernik,
J.M., 1987, Ecoregions of the conterminous United States: Annals of the
Association of American Geographers, v. 77, no. 1, p. 118-125.
Raitz,
K.B., and Ulack, R., 1984, Appalachia, a regional geography—land, people, and
development: Boulder, Colo., Westview Press, 396 p.
U.S. Census
Bureau, various years, at
http://www.census.gov/prod/www/abs/decennial/index.htm.
Woods,
A.J., Omernik, J.M., Brown, D.D., and Kiilsgaard, C.W., 1996, Level III and IV
ecoregions of Pennsylvania and the Blue Ridge Mountains, the Ridge and Valley,
and Central Appalachians of Virginia, West Virginia, and Maryland:
EPA/600/R-96/077, U.S. Environmental Protection Agency, National Health and
Environmental Effects Research Laboratory, Corvallis, Oreg., 50 p.
Table 1. Amount of overall
spatial change detected in ecoregion and proportion of ecoregion that
experienced change during one or multiple time periods
|
|
Overall
|
Number of changes
|
|
|
spatial change
|
1
|
2
|
3
|
4
|
|
Percent of
ecoregion
|
9.1
|
5.9
|
2.8
|
0.4
|
0.0
|
Table 2. Raw estimates of
percent change in ecoregion computed for each of four time periods and
associated margin of error at 85-percent confidence level
|
|
Period
|
|
|
1973-1980
|
1980-1986
|
1986-1992
|
1992-2000
|
|
Total
change (% of ecoregion)
|
2.9%
|
2.5%
|
3.3%
|
4.1%
|
|
Margin of
error (85% confidence level)
|
+/-0.7%
|
+/-0.6%
|
+/-0.6%
|
+/-1.1%
|
|
Average
annual rate of change (%/year)
|
0.4%
|
0.4%
|
0.6%
|
0.5%
|
Table 3. Proportion of
ecoregion covered by each land cover class during each of five mapped dates
|
|
1973
|
1980
|
1986
|
1992
|
2000
|
Net change 1973-2000
|
|
Land-use/land-cover
class
|
km²
|
%
|
km²
|
%
|
km²
|
%
|
km²
|
%
|
km²
|
%
|
km²
|
%
|
|
Water
|
308
|
0.5
|
355
|
0.6
|
355
|
0.6
|
358
|
0.6
|
366
|
0.6
|
58
|
0.1
|
|
Developed
|
1834
|
3.1
|
1932
|
3.2
|
1956
|
3.3
|
2038
|
3.4
|
2156
|
3.6
|
322
|
0.5
|
|
Mechanically
disturbed
|
177
|
0.3
|
152
|
0.3
|
177
|
0.3
|
182
|
0.3
|
220
|
0.4
|
43
|
0.1
|
|
Mining
|
1036
|
1.7
|
1079
|
1.8
|
1238
|
2.1
|
1178
|
2.0
|
1939
|
3.2
|
904
|
1.5
|
|
Barren
|
2
|
0.0
|
2
|
0.0
|
2
|
0.0
|
3
|
0.0
|
2
|
0.0
|
0
|
0.0
|
|
Forest
|
51724
|
86.6
|
51371
|
86.0
|
51069
|
85.5
|
50911
|
85.2
|
49768
|
83.3
|
-1956
|
-3.3
|
|
Grassland/Shrubland
|
317
|
0.5
|
524
|
0.9
|
631
|
1.1
|
841
|
1.4
|
1093
|
1.8
|
776
|
1.3
|
|
Agriculture
|
4188
|
7.0
|
4177
|
7.0
|
4162
|
7.0
|
4077
|
6.8
|
4043
|
6.8
|
-146
|
-0.2
|
|
Wetland
|
151
|
0.3
|
145
|
0.2
|
146
|
0.2
|
151
|
0.3
|
151
|
0.3
|
0
|
0.0
|
|
Non-mechanically
disturbed
|
0
|
0.0
|
0
|
0.0
|
0
|
0.0
|
0
|
0.0
|
0
|
0.0
|
0
|
0.0
|
Table 4. Leading land cover
conversions during each of four time periods
|
|
|
|
Area changed
|
% of all
|
|
Period
|
From
class
|
To
class
|
(km2)
|
changes
|
|
1973-1980
|
Forest
|
Mining
|
539
|
31
|
|
|
Mining
|
Forest
|
427
|
24
|
|
|
Forest
|
Grassland/Shrubland
|
185
|
11
|
|
|
Forest
|
Mechanically
disturbed
|
124
|
7
|
|
|
Mining
|
Grassland/Shrubland
|
76
|
4
|
|
|
Mechanically
disturbed
|
Forest
|
61
|
3
|
|
|
Forest
|
Developed
|
60
|
3
|
|
|
Other
classes
|
Other
classes
|
279
|
16
|
|
|
|
|
1,751
|
100
|
|
|
|
|
|
|
|
1980-1986
|
Forest
|
Mining
|
450
|
31
|
|
|
Mining
|
Forest
|
188
|
13
|
|
|
Grassland/Shrubland
|
Forest
|
149
|
10
|
|
|
Forest
|
Mechanically
disturbed
|
148
|
10
|
|
|
Mining
|
Grassland/Shrubland
|
121
|
8
|
|
|
Forest
|
Grassland/Shrubland
|
109
|
7
|
|
|
Mechanically
disturbed
|
Forest
|
97
|
7
|
|
|
Other
classes
|
Other
classes
|
212
|
14
|
|
|
|
|
1,474
|
100
|
|
|
|
|
|
|
|
1986-1992
|
Forest
|
Mining
|
531
|
27
|
|
|
Mining
|
Forest
|
366
|
18
|
|
|
Mining
|
Grassland/Shrubland
|
242
|
12
|
|
|
Grassland/Shrubland
|
Forest
|
174
|
9
|
|
|
Forest
|
Mechanically
disturbed
|
157
|
8
|
|
|
Forest
|
Grassland/Shrubland
|
130
|
7
|
|
|
Mechanically
disturbed
|
Forest
|
106
|
5
|
|
|
Other
classes
|
Other
classes
|
289
|
15
|
|
|
|
|
1,995
|
100
|
|
|
|
|
|
|
|
1992-2000
|
Forest
|
Mining
|
1,099
|
45
|
|
|
Mining
|
Grassland/Shrubland
|
272
|
11
|
|
|
Forest
|
Mechanically
disturbed
|
204
|
8
|
|
|
Forest
|
Grassland/Shrubland
|
189
|
8
|
|
|
Grassland/Shrubland
|
Forest
|
176
|
7
|
|
|
Mechanically
disturbed
|
Forest
|
128
|
5
|
|
|
Mining
|
Forest
|
113
|
5
|
|
|
Other
classes
|
Other
classes
|
268
|
11
|
|
|
|
|
2,449
|
100
|
|
Overall:
|
|
|
|
|
|
1973-2000
|
Forest
|
Mining
|
2,620
|
34
|
|
|
Mining
|
Forest
|
1,094
|
14
|
|
|
Mining
|
Grassland/Shrubland
|
711
|
9
|
|
|
Forest
|
Mechanically
disturbed
|
632
|
8
|
|
|
Forest
|
Grassland/Shrubland
|
612
|
8
|
|
|
Grassland/Shrubland
|
Forest
|
555
|
7
|
|
|
Mechanically
disturbed
|
Forest
|
392
|
5
|
|
|
Other
classes
|
Other classes
|
1,054
|
14
|
|
|
|
|
7,670
|
100
|

Figure
1. Central Appalachians and surrounding ecoregions. The 32 randomly selected
100-km2 sample blocks are shown along with land use/land
cover from the 1992 National Land Cover Dataset.

Figure 2. Forested hills of
the Central Appalachians.

Figure 3. Processing coal
at a coal mine in southern West Virginia.

Figure 4. Predominately
forested area with agriculture in the valley.

Figure 5. The overall
spatial change in all Eastern U.S. ecoregions. Each bar chart shows the
proportion of the ecoregion that experienced change on 1, 2, 3, or 4 dates.

Figure 6. The estimates of
land cover change per time interval normalized to an annual rate of change as
compared to other ecoregions. Central Appalachian ecoregion is highlighted in
black.

Figure 7. Active logging of
the ecoregion’s hardwood forests.
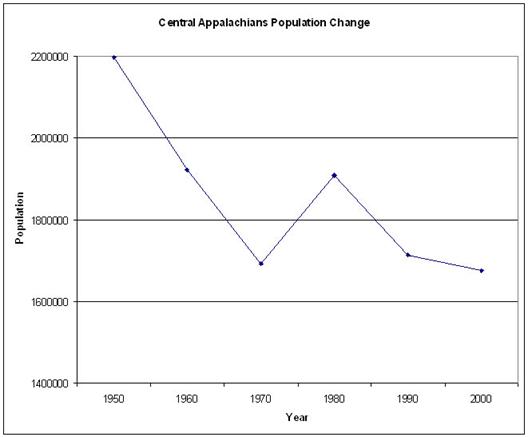
Figure 8. Central
Appalachian population 1950 to 2000 (U.S. Census Bureau).

Figure 9. Per period net
change for each land cover class. Areas above zero represent net gains for a
land cover class, while areas below represent a net loss.

