Mississippi Valley Loess Plains
By Janis L. Taylor 1
Click to see available downloads for this ecoregion

Figure 1. The Mississippi Valley Loess Plain. The
underlying land cover is from the 1992 National Land Cover Database (Vogelmann
and others, 2001). Outlines of the thirty-two, 10 km x 10 km sample sites are
shown in black.
Ecoregion Description
The Mississippi Valley Loess Plains
extend from western Kentucky south to Louisiana, covering approximately 43,775
km2 (16,901 mi2) (fig. 1). The ecoregion is about 750 km
(466 mi) long and not more than 110 km (68 mi) wide at any point and is
sandwiched between the Mississippi Valley Alluvial Plain ecoregion to the west
and the Southeastern Plains ecoregion to the east. The topography consists
primarily of irregular plains. A highly erodible, thick layer of loess—a unique
geologic deposit consisting almost entirely of wind-transported, silt-sized
grains of quartz and other common minerals—is the distinguishing characteristic
of this ecoregion (Omernik, 1987). The principal soils are finely textured and
acidic, red and yellow podzols developed from the underlying clays, sands, and
loess (Faulkner, 2005). These erodible soils are characteristically poor in
organic matter and nutrients. However, they are easily cultivated with the use of
fertilizers.
The average annual air temperature
ranges from 16 to 20oC (60 to 68oF), increasing from
north to south. Annual precipitation ranges from 1,150 to 1,525 mm (45 to 60
in.), increasing from north to south. Most precipitation is in the form of rain,
occurring mainly during the winter and spring. The freeze-free period is 200
days or more in most of the ecoregion but is as long as 290 days in the
southernmost part (U.S. Department of Agriculture, 2006).
The overall spatial change—the
percentage of land area within the ecoregion where land cover changed between
1973 and 2000—was 13.2 percent, moderately high in comparison to other Eastern U.S. ecoregions (fig. 2). Of the overall land cover change, 10.5 percent of the
land area changed just one time, 2.5 percent changed two times, and 0.2 percent
changed three times (table 1). Estimated changes in the
time periods used in this study ranged from a low of 2.0 percent to a high of
6.4 percent (table 2). After land cover changes per
period were normalized to an average annual rate, changes ranged from a low 0.3
percent per year in the 1980 to 1986 period to a high of 1.1 percent of area
per year in the 1986 to 1992 period (table 2 and fig. 3). The estimates of change have an associated margin of error
that is shown in table 2.
Table 3 lists the areal percentage
of each individual land cover type during each of the five mapped dates. Forest, agriculture, and developed land account for more than 90 percent of the land cover
in the ecoregion. The southern portion of the ecoregion is a mosaic of forest
and cropland, while agriculture is the dominant land use in the northern
portion. Trees, cotton, corn, soybeans, strawberries, and tobacco are common
crops grown throughout the ecoregion (fig. 4). Longleaf pine is the principal
commercial tree in the densely forested sections of the south, and loblolly,
slash, and shortleaf pine are the common commercial trees in the north (fig. 5).
During the study, agricultural land
decreased from 46.5 percent of the ecoregion in 1973 to 39.7 percent in 2000
(table 3). Developed land increased from 3.6 percent of the ecoregion in 1973
to 7.6 percent in 2000. The amount of forested land changed little between 1973
and 2000, and ranging between 43 and 44 percent of the land cover.
Agricultural land decreased in
every time interval (table 3 and fig. 6), and the most common land cover
conversion during the entire study period was agriculture to forest (table 4).
The most significant decrease in agriculture occurred between 1986 and 1992 and
was accompanied by a complementary increase in forest and developed land.
The conversion of agricultural land
to forest is the result of several factors. In 1985, the Food Security Act
initiated the Conservation Reserve Program (CRP) (Johnson and Maxwell, 2001).
The CRP encouraged the planting of hardwood trees on marginal quality farmland.
Many of the counties within the ecoregion showed a significant increase in the
amount of land placed in the CRP in 1987, 1992, and 1997 (U.S. Department of
Agriculture, 2004). In addition to the CRP, the U.S. Forest Service promoted afforestation,
the restoration of forest on abandoned agriculture land (Stanfurf and Gardiner,
2000).
Socio-economic benefits garnered
from forested land include financial gain from the sale of hunting leases,
carbon credits for carbon sequestration, increased recreational opportunities,
improved water quality, and an economy based on the production of biofuels and
fiber. During the study period, many of the forested areas in the ecoregion
were managed as pine plantations. Additionally, the common conversion of forest
to mechanically disturbed land and the reverse, mechanically disturbed to
forest, were ranked third and fourth overall during the entire study period (table
4). These conversions represent the short harvest cycles of pine plantations in
the ecoregion (fig. 7).
Developed land
increased in each of the four time intervals (table 3), and agriculture
converting to developed land was the second most common conversion for the
entire study period (table 4). This unidirectional land cover change was driven
by a population increase both in and around the two largest cities in the
ecoregion, Memphis, Tennessee, and Jackson, Mississippi (fig. 8).
References
Faulkner, S.,
2005, Major land resource areas of Mississippi, Southern Mississippi Valley
silty uplands (loess bluffs): Cleveland, Miss. Department of Biological
Sciences, Delta State University,
<http://www.marshdoc.com/soil/soil7/soil7.html>.
Johnson, Jerry and Maxwell, B., 2001, The role of
the Conservation Reserve Program in controlling rural residential development:
Journal of Rural Studies, v. 17, p. 323-332.
Omernik, J.M., 1987, Ecoregions of the conterminous
United States: Annals of the Association of American Geographers v. 77, no.
1, p. 118-125.
Stanturf, John
A., and Gardiner, Emile S., 2000, Restoration of bottomland
hardwoods in the Lower Mississippi Alluvial Valley, in Sustaining
Southern forests—the science of forest assessment: Atlanta, Ga., Southern
Forest Resource Assessment, <http://www.srs.fs.fed.us/sustain/conf/>.
U.S. Department
of Agriculture, 2004, Census of agriculture, 1987, 1992, 1997: Ithica, N.Y., Cornell University, Mann Library,
<http://agcensus.mannlib.cornell.edu/area_to_county.php>.
U.S. Department
of Agriculture, 2006, Land resource regions and major land resource areas of
the United States, the Caribbean, and the Pacific Basin: U.S. Department of
Agriculture Handbook 296, U.S. Department of Agriculture, National Resources
Conservation Service, 663 p.
Vogelmann, J.E,
Howard, S.M., Yang, L., Larson, C.R., Wylie, B.K., and Van Driel, N., 2001,
Completion of the 1990s National Land Cover Data set for the conterminous United
States from Landsat Thematic Mapper data and ancillary data sources:
Photogrammetric Engineering & Remote Sensing, v. 61, p. 650-662.
Table 1. Amount of overall spatial change measured in the
ecoregion and proportion of the ecoregion that experienced change during one or
multiple time periods

Table 2. Raw estimates of percent change in the ecoregion
computed for each of the four time periods and the associated margin of error
at an 85-percent confidence level
[Estimates of change per period normalized to an annual rate
of change for each of the four time periods]
Table 3. Proportion of the ecoregion covered by each land
cover class during each of the five mapped dates

Table 4. Leading land use and land cover conversions from
1973 to 2000 ranked by greatest to least area changed
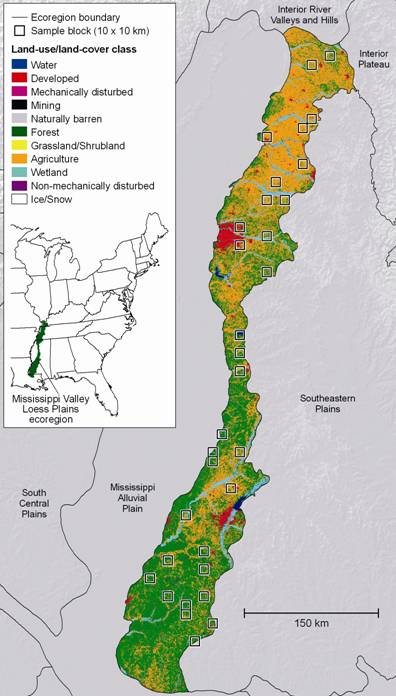
Figure 1. The Mississippi Valley Loess Plain. The
underlying land cover is from the 1992 National Land Cover Database (Vogelmann
and others, 2001). Outlines of the thirty-two, 10 km x 10 km sample sites are
shown in black.

Figure 2. The overall spatial change in all Eastern U.S. ecoregions. Each bar chart shows the proportion of the ecoregion that
experienced change on 1, 2, 3, or 4 dates.

Figure 3. The estimates of land cover change per time
interval normalized to an annual rate of change.

Figure 4. Tobacco field and shed northeast of Mayfield in
western Kentucky (photograph)

Figure 5. Replanted pine plantation west of Crystal Springs, Mississippi (photograph)
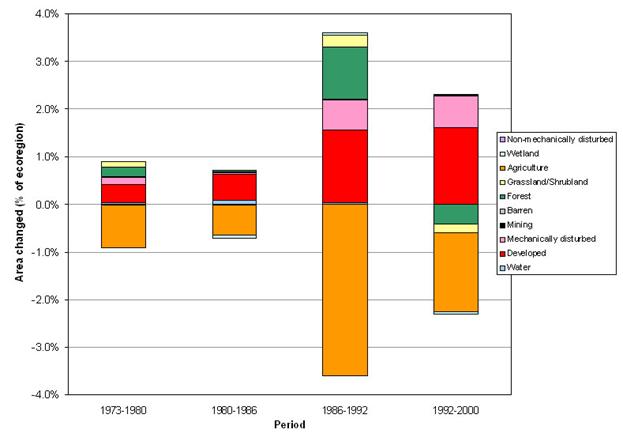
Figure 6. Net change of each land cover per time period.

Figure 7. Piles of new logs in a huge clear cut just west
of Crystal Springs in Copiah County, Mississippi (photograph)

Figure 8. Recently cleared site for a new subdivision
located northeast of Memphis, Tennessee. There is another subdivision already
built in the background. (photograph)

