>>
Open the mapper in a new window
The NAWQA Mapper allows you to view chemical concentrations found in streams, lakes, wells, and other sampling sites in the US. The data points presented on the map are generated directly from the 17 million water quality results stored in the NAWQA data warehouse. After a map is created, statistical distributions can be viewed, additional details can be queried for individual sites, and background maps from the USGS National Map can be turned on to provide spatial context to the water quality themes.
Quick Start Guide
To try out some of the mapper's capabilities, click the link (above) to open the mapper in a new browser window. Then, in the mapper application, click on one of the Predefined Maps shown in the tab labeled 'Predefined Maps'.
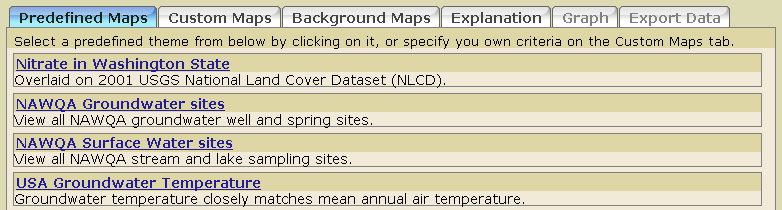
Select a Predefined Map, such as the Nitrate in Washington State map above.
After the map is created, investigate the other tabs to find other features of the application. For instance,
- The Custom Maps tab allows you to control which data points are displayed on the map and how the data values are calculated
- The Background Maps tab allows you to control background layers, such as rivers, roads, and topographical layers.
- The Explanation tab shows a legend describing the NAWQA data layer shown on the map and lists any other displayed background layers.
- The Graph tab shows a box plot of the data shown on the map. Hover over graph points to highlight their location on the map.
- The Export Data tab provides various options for exporting data shown on the map.
Many view controls are available when the mouse is placed on the map. For instance, when the 'Zoom In' control is selected, you can either click on the map to zoom in to that location, or drag the mouse on the map to select the area the map should display.
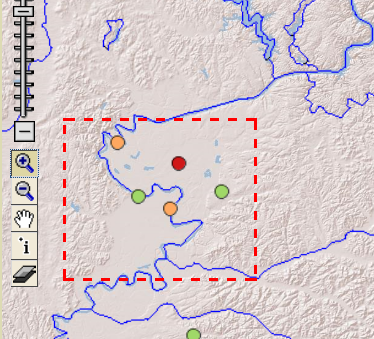
Click the 'zoom in' tool and drag the mouse to zoom in on the selected mapped area.
Reference
Custom Maps
Using the controls on the Custom Maps tab, you can control which data from the NAWQA database are displayed on the map. The data can be 'filtered' so that only a particular chemical constituent, time period, type of sample site, and/or region is used to generate the data points.
Determining One Value per Site to Map
A statistical aggregate function (min, max, median, first, last) must be choosen so that all of the sample values for a chemical constituent at a site can be combined into a single value to be displayed on the map. Changing the date range of your filter will affect what set of samples is aggregated and changing the aggregate function will affect what value from that set is displayed at each site. For surface water sites, all samples taken during the time period you select are considered in the aggregate. For groundwater sites, one sample from NAWQA's first cycle (1992-2002) and one from the second cycle (2002+) are aggregated unless the selected time period does not cover both cycle periods.
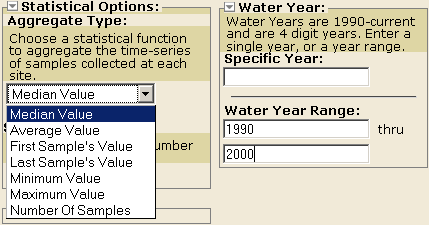
Select a statistical aggregate function to apply to the data found during the selected date range. Median is the default.
Note that the 'Sites' tab only displays sites and does not show any constituent concentrations - thus, it has no statistical control options.
Background Maps
Site and concentration maps can be overlaid on background maps from the USGS National Map. Based on your region of interest, a menu of available maps is presented in the "Background Maps" tab. You can navigate the menu, or search for maps of interest in the search sub-tab.
Add User-Defined Background Layers
Additional background layers can be added to the map by specifying the web map service (WMS) URL in the Background Maps tab. The WMS URL should have this format:
http://<Web server machine name>/<ArcGIS Server instance name>/services/<folder name (if applicable)>/<service name>/<MapServer>/WMSServer.
The layer name must also be specified. To find out all layer names available within the WMS along with other layer metadata, you can submit a GetCapabilities request directly to the WMS. A GetCapabilities request should have this format:
http://<Web server machine name>/<ArcGIS Server instance name>/services/<folder name (if applicable)>/<service name>/MapServer/WMSServer?request=GetCapabilities.
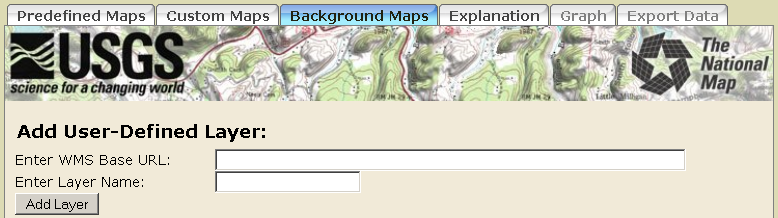
Add a WMS Layer to the map by specifying a WMS URL and Layer Name.
Data Exports
Once a map is created, the supporting water-quality data can be exported to several tabular and GIS formats including Microsoft Excel, ESRI Shapefile (includes .shp, .shx and .dbf files in lat/long non-projected format with the NAD83 datum) and Google Earth.
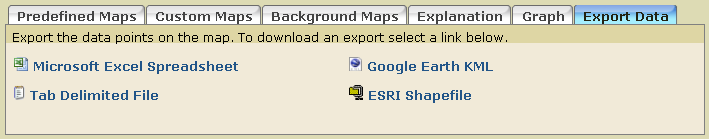
Example Export Control

Example Google Earth Export
Site Based Summaries
Detailed information for a site can be queried by selecting the identify tool-tip (the "i+" icon) on the map and clicking near the site of interest. A window will open summarizing NAWQA data for that site with links to NWIS Web and stream discharge-concentration graphs for stream sites with stream gages.
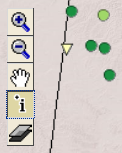
Example Identify Control
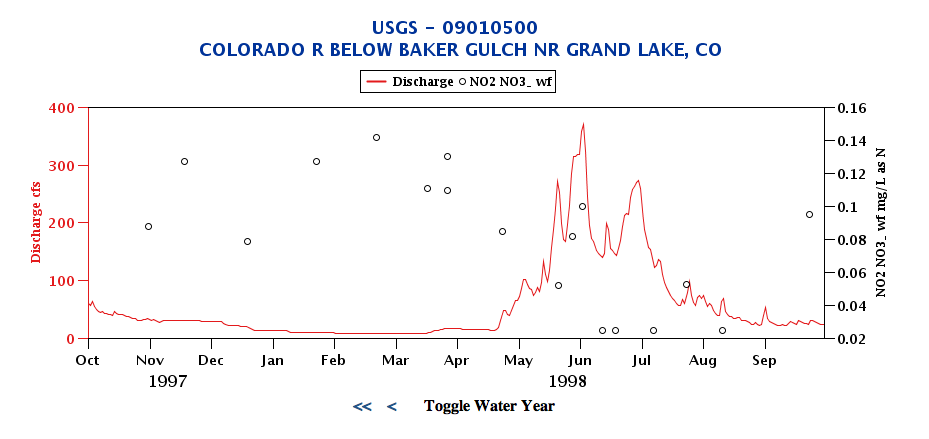
Example Discharge Concentration Graph
Statistical Distributions
The graph tab presents a box plot graph showing the statistical distribution of concentrations shown on the current extent of the map. By zooming into a region of interest, you can see how concentrations from that area (shown as points) fit within the national distribution (displayed as bars). When you hover over points on the graph, the location of the site from which that concentration corresponds is highlighted on the map.
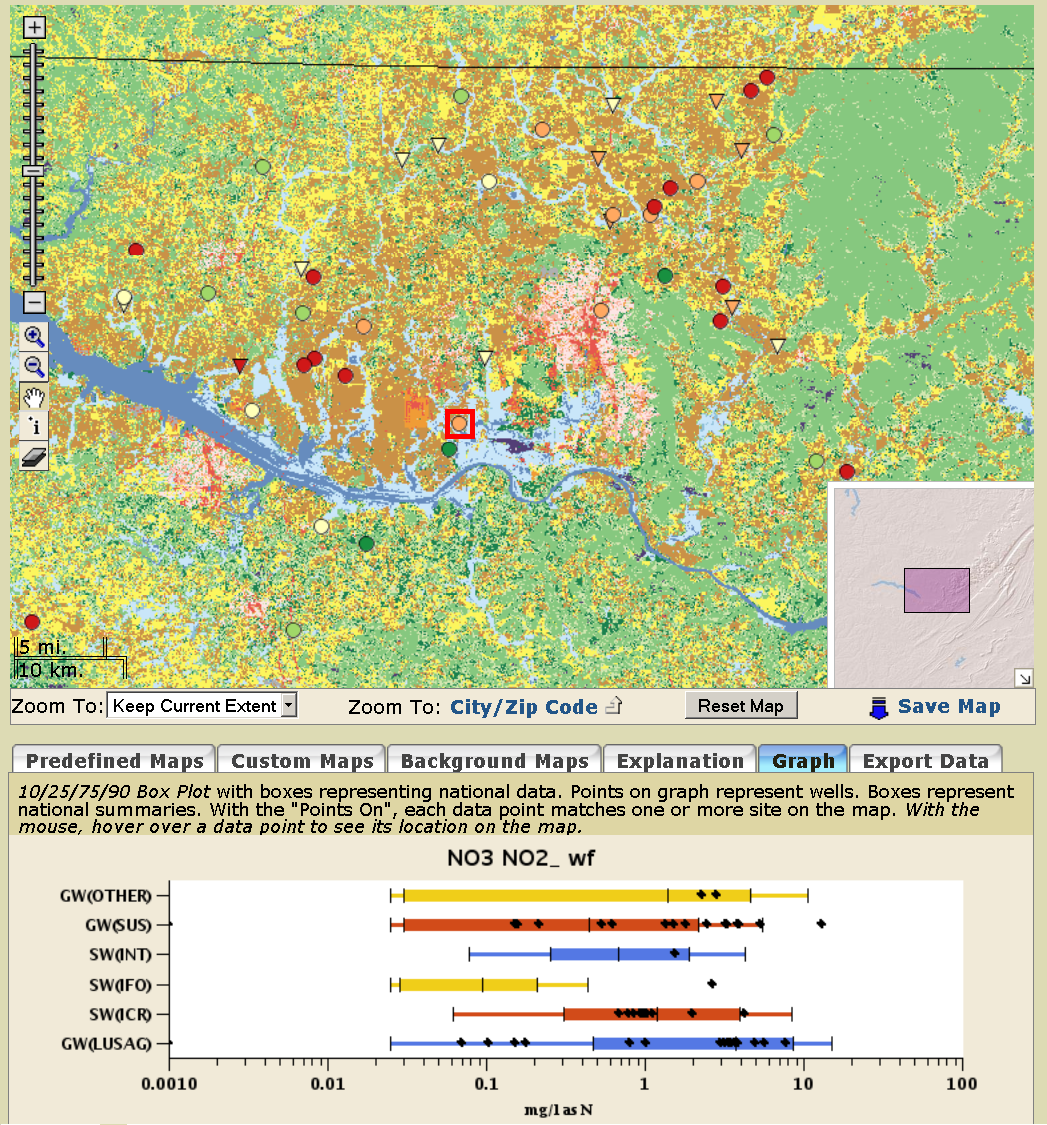
Example Graph