A Statistical Profile of Asian Older Americans Aged 65+
Introduction
Almost 38.9 million Americans were aged 65 and over in 2007. Three in five people in this age group are women. Over the next forty years, the number of people aged 65 and older is expected to double and the number of people aged 85 and older is expected to triple. Along with general trends for America’s population, the Asian, Hawaiian, and Pacific Island population is living longer.
The
Older Asian, Hawaiian, and Pacific island Population: Past, Present, and Future

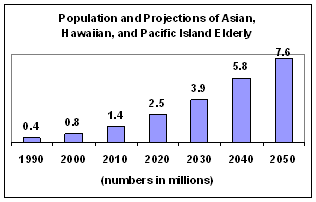
The Asian, Hawaiian and Pacific Island older population was over 1.3 million in 2008 (3.4% of the older population) and is projected to grow to over 7.6 million by 2050. By 2050, the percentage of the older population that is Asian, Hawaiian and Pacific Island is projected to account for 8.6 percent of the older population.
Residence
In 2008, almost 60% of Asian, Hawaiian and Pacific Island elderly lived in just three states: California (40.5%), Hawaii (9.6%), and New York (9.2%). Other states with significant populations include Texas (4.3%), New Jersey (3.9%), Illinois (3.5%), Washington (3.3%), and Florida (3.0%).
Educational
Level
The past four decades have seen a significant increase in educational attainment among older Americans, including Asian older Americans. In 2008, 74% of the older Asian population aged 65 and older had finished high school. Also in 2008, almost 32% of Asian older persons had a bachelor’s degree or higher.
The percent of high school graduates among older Asians is almost as high as the percent among all older persons (77%). However, the percent of older Asians in 2008 who had a bachelor’s degree or higher (32%) was over 50% higher than for the overall older population. Furthermore, the percent of male Asians who had a bachelor’s degree or higher (40%) almost 50% higher than for the overall older population (27%).
Living
Arrangements
In 2008, 84% of older Asian men lived with their spouses, 6% lived with other relatives, 2% lived with non-relatives, and 8% lived alone. For older Asian women, 47% lived with their spouses, 30% lived with other relatives, 3% lived with non-relatives, and 20% lived alone.
Income
and Poverty
Households containing families headed by Asian persons aged 65+ reported a median income in 2008 of $48,859. The comparable figure for all older households was $44,188. The median personal income for Asian men was $18,518 and $11,501 for Asian women. The comparable figures for all elderly were $25,503 for men and $14,559 for women.
The poverty rate in 2008 for Asian elderly (65 and older) was 12.1% while the rate for all elderly was 9.7%. The rate for Asian men was 11.1% and the rate for Asian women was 12.8%. For the overall population, the poverty rate among the elderly was 6.7% for men and 11.9% for women.