Climate Change
Climate Change Science Overview
On This Page
Earth's climate is changing in ways that affect our weather, oceans, snow, ice, ecosystems, and society.
Natural causes alone cannot explain all of these changes. Human activities are contributing to climate change, primarily by releasing billions of tons of carbon dioxide (CO2) and other heat-trapping gases, known as greenhouse gases, into the atmosphere every year. [1]
Climate changes will continue into the future. The more greehouse gases we emit, the larger future climate changes will be.
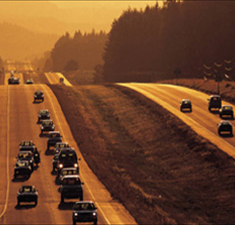
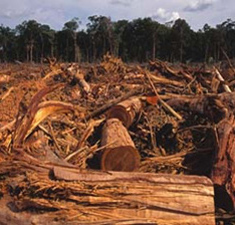
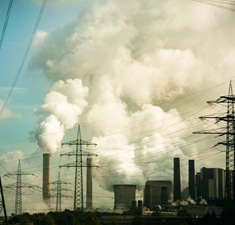
Human activities, like driving, manufacturing, electricity generation, and the clearing of forests contribute to greenhouse gas emissions and warm the planet.
Sources: EPA 2010, EPA 2011, USGCRP 2008
Changes in the climate system affect our health, environment, and economy. We can prepare for some of the impacts of climate change to reduce their effects on our well-being.
Related Links:
Earth's climate is changing
The global average temperature increased by more than 1.3°F over the last century. [2] The average temperature in the Arctic rose by almost twice as much. [2] The buildup of greenhouse gases in our atmosphere and the warming of the planet are responsible for other changes, such as:
- Changing precipitation patterns [1] [3]
- Increases in ocean temperatures, sea level, and acidity
- Melting of glaciers and sea ice [1]
Learn more about the indicators of climate change.

View enlarged image
These maps show temperatures across the world in the 1880s (left) and the 1980s (right), as compared to average temperatures from 1951 to 1980. This difference from average is called an anomaly. The map on the left shows that it was colder in the 1880's in most places. The map on the right shows it was warmer in the 1980s in most places. Earth's average surface temperature has increased almost 1.5°F during the 20th century. Two-thirds of the warming has occurred since 1975, at a rate of roughly 0.3°F-0.4°F per decade.
Source: NASA
Click on the image to open a pop-up that explains the differences between climate change and global warming.
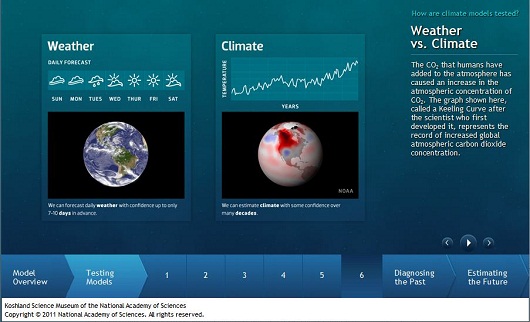
Click on the image to open a pop-up that shows a larger version of this image, plus text that explains the differences between weather and climate.
Climate Change vs. Global Warming
The term climate change is sometimes used interchangeably with the term global warming. However, the terms do not refer entirely to the same thing.
Global warming refers to the recent and ongoing rise in global average temperature near Earth's surface. It is caused mostly by increasing concentrations of greenhouse gases in the atmosphere. Global warming is causing climate patterns to change. However, global warming itself represents only one aspect of climate change.
Climate change refers to any significant change in the measures of climate lasting for an extended period of time. In other words, climate change includes major changes in temperature, precipitation, or wind patterns, among others, that occur over several decades or longer. Climate change can occur at the global, continental, regional, and local levels. Climate change may refer to natural changes in climate, or changes caused by human activities.
Weather vs. Climate
The difference between weather and climate is primarily a matter of time and geography. Weather refers to the conditions of the atmosphere over a short period of time, such as hours or days, and typically for a local area. Climate refers to the behavior of the atmosphere over a longer period of time, and usually for a large area.
Familiar examples of weather characteristics include the daily temperature, humidity, or the amount of precipitation produced by a storm. Weather also includes severe weather conditions such as hurricanes, tornadoes, and blizzards. Because of the dynamic nature of the atmosphere, it is not possible to predict weather conditions in a specific location months or years in advance.
Climate is typically defined based on 30-year averages of weather. [4] Climate represents our expectations for the weather. For example, climate tells us how warm we expect a typical summer to be, how much rainfall would correspond to a wetter-than-average spring, or how frequently we expect a snowy winter to occur. Scientists can compare recent and long-term observations of the climate to detect the influence of greenhouse gases on climate conditions.
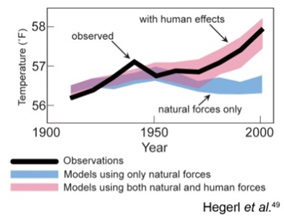
Natural causes alone cannot explain recent changes
View enlarged image
Models that account only for the effects of natural processes are not able to explain the warming over the past century. Models that also account for the greenhouse gases emitted by humans are able to explain this warming.
Source: USGRCP 2009
View enlarged image
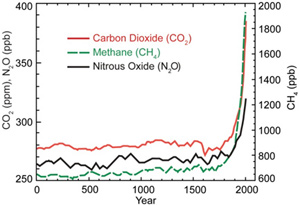
This graph shows the increase in greenhouse gas (GHG) concentrations in the atmosphere over the last 2,000 years. Increases in concentrations of these gases since 1750 are due to human activities in the industrial era. Concentration units are parts per million (ppm) or parts per billion (ppb), indicating the number of molecules of the greenhouse gas per million or billion molecules of air.
Source: USGCRP 2009
Natural processes such as changes in the sun's energy, shifts in ocean currents, and others affect Earth's climate. However, they do not explain the warming that we have observed over the last half-century. [1]
Human causes can explain these changes
Most of the warming of the past half century has been caused by human emissions of greenhouse gases. [1] Greenhouse gases come from a variety of human activities, including: burning fossil fuels for heat and energy, clearing forests, fertilizing crops, storing waste in landfills, raising livestock, and producing some kinds of industrial products.
Greenhouse gas emissions are not the only way that people can change the climate. Activities such as agriculture or road construction can change the reflectivity of Earth's surface, leading to local warming or cooling. This effect is observed in urban centers, which are often warmer than surrounding, less populated areas. Emissions of small particles, known as aerosols, into the air can also lead to reflection or absorption of the sun's energy.
Learn more about past and present climate trends and their causes.
Climate will continue to change unless we reduce our emissions
During the 21st century, global warming is projected to continue and climate changes are likely to intensify. Scientists have used climate models to project different aspects of future climate, including temperature, precipitation, snow and ice, ocean level, and ocean acidity. Depending on future emissions of greenhouse gases and how the climate responds, average global temperatures are projected to increase worldwide by 2°F to 11.5°F by 2100. [1] Learn more about the projections of future climate change.
Climate change impacts our health, environment, and economy
Climate change affects our environment and natural resources, and impacts our way of life in many ways. For example:
- Rising sea levels threaten coastal communities and ecosystems.
- Changes in the patterns and amount of rainfall, as well as changes in the timing and amount of stream flow, can affect water supplies and water quality and the production of hydroelectricity.
- Changing ecosystems influence geographic ranges of many plant and animal species and the timing of their lifecycle events, such as migration and reproduction.
- Warmer temperatures increase the frequency, intensity, and duration of heat waves, which can pose health risks, particularly for young children and the elderly.
We can prepare for some of the likely climate change impacts to reduce their effect on ecosystem and human well-being. Making such preparations is known as adaptation. Examples of adaptation include strengthening water conservation programs, upgrading stormwater systems, developing early warning systems for extreme heat events, and preparing for stronger storms through better emergency preparation and response strategies.
Learn more about how climate change impacts are expected to affect different U.S. regions and sectors and how we can prepare.
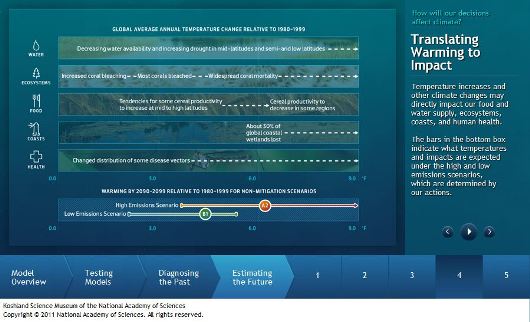
This slideshow describes some of the projected climate change impacts to key sectors, among other topics. Click the image above to play the slideshow.
References:
[1] NRC (2010). Advancing the Science of Climate Change
![]() . National Research Council. The National Academies Press, Washington, DC, USA.
. National Research Council. The National Academies Press, Washington, DC, USA.
[2] IPCC (2007). Climate Change 2007: Synthesis Report
![]() . Contribution of Working Groups I, II and III to the Fourth Assessment Report of the Intergovernmental Panel on Climate Change [Pachauri, R.K. and A. Reisinger (eds.)]. Geneva, Switzerland.
. Contribution of Working Groups I, II and III to the Fourth Assessment Report of the Intergovernmental Panel on Climate Change [Pachauri, R.K. and A. Reisinger (eds.)]. Geneva, Switzerland.
[3] IPCC (2012)
![]() . Summary for Policymakersin: Managing the Risks of Extreme Events and Disasters to Advance Climate Change Adaptation [Field, C.B., V. Barros, T.F. Stocker, D. Qin, D.J. Dokken, K.L. Ebi, M.D. Mastrandrea, K.J. Mach, G.-K. Plattner, S.K. Allen, M. Tignor and P.M. Midgley (eds.)]. A Special Report of Working Groups I and II of the Intergovernmental Panel on Climate Change. Cambridge University Press, Cambridge, United Kingdom and New York, NY, USA.
. Summary for Policymakersin: Managing the Risks of Extreme Events and Disasters to Advance Climate Change Adaptation [Field, C.B., V. Barros, T.F. Stocker, D. Qin, D.J. Dokken, K.L. Ebi, M.D. Mastrandrea, K.J. Mach, G.-K. Plattner, S.K. Allen, M. Tignor and P.M. Midgley (eds.)]. A Special Report of Working Groups I and II of the Intergovernmental Panel on Climate Change. Cambridge University Press, Cambridge, United Kingdom and New York, NY, USA.
[4] Le Treut, H., R. Somerville, U. Cubasch, Y. Ding, C. Mauritzen, A. Mokssit, T. Peterson and M. Prather (2007). Historical Overview of Climate Change Science. In: Climate Change 2007: The Physical Science Basis
![]() . Contribution of Working Group I to the Fourth Assessment Report of the Intergovernmental Panel on Climate Change [Solomon, S., D. Qin, M. Manning, Z. Chen, M. Marquis, K.B. Averyt, M. Tignor and H.L. Miller (eds.)]. Cambridge University Press, Cambridge, United Kingdom and New York, NY, USA.
. Contribution of Working Group I to the Fourth Assessment Report of the Intergovernmental Panel on Climate Change [Solomon, S., D. Qin, M. Manning, Z. Chen, M. Marquis, K.B. Averyt, M. Tignor and H.L. Miller (eds.)]. Cambridge University Press, Cambridge, United Kingdom and New York, NY, USA.
