Science Features
While Hurricane Isaac has passed, scientific work to understand the storm’s impact on Gulf Coast states continues.
Isaac’s floodwaters and impacts were measured using a variety of tools before, during and after the storm, including terrestrial and airborne lidar, acoustic Doppler and aerial photography
Mapping in 3-D: Terrestrial lidar and acoustic Doppler
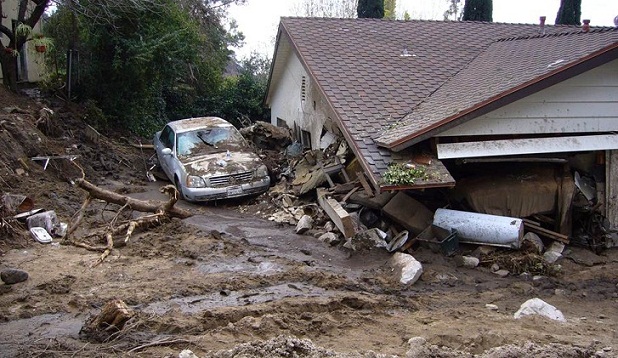
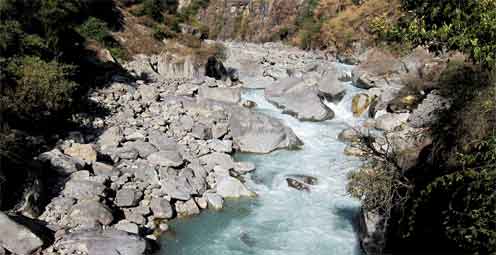
USGS scientists mapped the Tangipahoa Dam using terrestrial lidar (video at right), or T-lidar and acoustic Doppler technology to capture multiple scans of different areas near the dam, showing the above and underwater topography. The dam was damaged during heavy rainfall in Hurricane Isaac and caused thousands of people downstream to be evacuated late last week.
These scans captured a clear view of two landslides on the dam’s downstream side. The larger of the two landslides occurred mostly underwater. While T-lidar provides a clear view of above ground features, scientists used acoustic Doppler techniques to conduct underwater measurements.
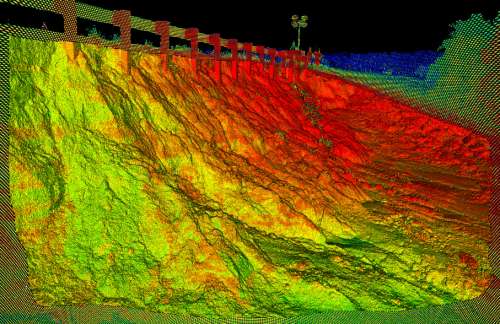
A 3-D terrestrial LiDAR scan of the Percy Quin Mississippi State Park Dam in McComb, Mississippi, taken Monday, September 3, 2012. The U.S. Geological Survey is using this new technology in select areas of Louisiana, Mississippi and Alabama to map impacts by Hurricane Isaac.
The first T-lidar scans took place Saturday, with more completed on Monday to assess whether additional movement of the landslides had occurred. Monday’s scan showed little movement. This information and other data has been provided to the U.S. Army Corps of Engineers as they continue to address the dam’s structural risk and public safety.
T-lidar allows scientists to quickly generate 3-D maps of buildings, dams, levees and other structures, and can show areas of storm damage as well. In a four-to-five minute scan, the instrument collects millions of topographic data points in a full 360-degree view to quickly produce highly accurate topographic information and can map areas up to two-thirds of a mile away.
Acoustic Doppler instruments are frequently used to measure stream or lake geometry and water velocity. An acoustic signal is bounced off the river or lake bottom and the amount of time required for the signal to return to the sensor provides a measurement of the distance to the bottom. In the Tangipahoa Lake application an acoustic Doppler instrument was used to map the underwater portion of the landslide area, and to determine the force of the water on the dam structure.
Isaac is the first storm in which USGS has used its terrestrial lidar capabilities to map urban flooding.
The view from above: aerial flight surveys and lidar showing coastal change
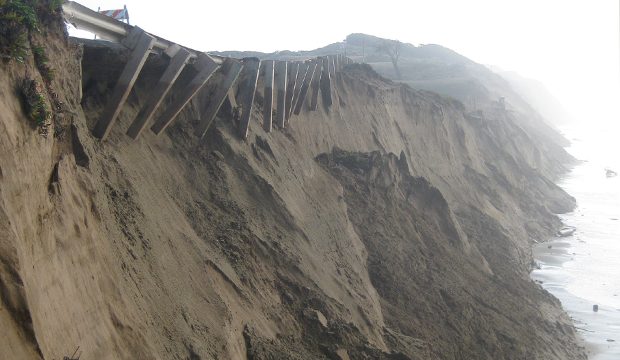
After the worst of the storm passed, USGS scientists began conducting aerial photography and elevation surveys of post-storm beach conditions along the Gulf Coast to document the impacts of hurricane surge, waves, and currents on beaches. Information obtained from these surveys allows scientists to measure changes to coastal environments.
Oblique aerial photography was collected this week from Isle Dernieres in Louisiana to Dauphin Island in Alabama. Scientists compared these images with pre- storm images of the same location to illustrate the coastal changes and damage from Hurricane Isaac. Photo pairs of several locations are available online.
Photos from Dauphin Island indicated beach erosion and island overwash, furthering the erosion the island has seen during repeated storm events — Ivan, Katrina, Gustav and Isaac — that have led to the island’s increased vulnerability to future storms. This photo shows the effects that repeat hurricane waves and surge have had on Dauphin Island from 2004 -2008.
Some areas of the Chandeleur Islands in Louisiana experienced such extreme erosion from Isaac that only underwater shoals, or submerged shallow areas, remain. This erosion resulted in the disappearance of an oil-protection berm constructed following the BP oil spill. Due to cumulative damage from previous storms like Hurricane Katrina, it remains in question whether this beach system will ever be able to fully recover from storm impacts.
Scientists are also conducting an airborne lidar survey of beach elevations to gather additional information in the most heavily impacted areas and to measure the amount of erosion.
Lidar, light detection and ranging, is an aircraft-based, remote-sensing technique that uses laser pulses to collect highly detailed ground elevation data. The photography and lidar data, as well as the coastal change analyses of these data, should be useful in mitigation and restoration efforts along the Gulf Coast shoreline. Data acquired will also be used to improve predictive models of future coastal impacts from severe storms and to identify areas vulnerable to extreme coastal change.
Flyover Shows Storm Damage and Marsh Dieback:
Another set of USGS aerial flight surveys flown this week used similar techniques to document vegetation and habitat change, and other ecological impacts and along coast and barrier islands post Isaac.
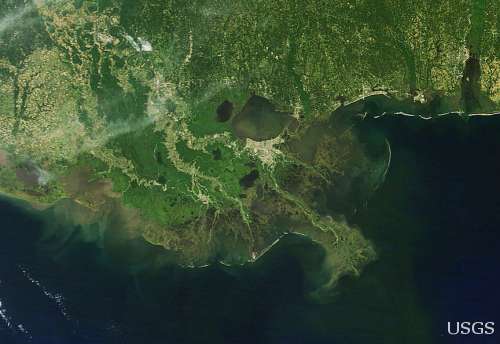
These flights examined areas from Wax Lake Delta, Louisiana, to Ship Island, Mississippi., and preliminary assessments suggest that Hurricane Isaac damaged coastal wetlands in a manner that is substantial, but not unprecedented. Damage to coastal wetland areas was evident throughout much of southeast Louisiana. The intensity of hurricane effects was most abundant in areas of upper Breton Sound, an area just to the south of the community of Braithwaite, which experienced devastating flooding.
The most prevalent effects of Hurricane Isaac observed were expansive wrack fields. Wrack is accumulated organic debris and trash that are transported and deposited by a hurricane’s surge. Wrack deposits from Hurricane Isaac were observed throughout southeast Louisiana, burying existing marsh areas and obstructing infrastructure, such as canals and railroads.
Large areas of marsh dieback, termed “brown marsh” or “sudden marsh dieback,” were observed in the Terrebonne and Barataria basins in Louisiana. Previous reports of sudden marsh dieback in the spring and summer of 2012, before Hurricane Isaac, indicate that the dieback in this area has been increasing over time and may be the result of a combination of other stressors. Evidence of vegetation stress, such as widespread discoloration, was also observed in areas that were directly impacted further to the east by hurricane storm surge. The browning and destruction in the marshes east of the Mississippi River in coastal Louisiana appear to be recent, indicating a more direct link to salinity and flooding stress associated with the Hurricane Isaac’s storm surge. The USGS will further investigate the recent history of sudden marsh dieback events in coastal Louisiana. Subsequent aerial surveys will be conducted to quantify the extent of brown marsh and to potentially separate the phenomenon of sudden dieback and the storm surge impacts.
Louisiana currently experiences more wetland loss then all other states in the U.S. combined. Coastal Louisiana has lost a wetland area the size of Delaware, equaling 1,883 square miles, over the past 78 years, according to a 2011 USGS National Wetlands Research Center study. For more information about NWRC’s hurricane research, visit http://www.nwrc.usgs.gov/hurricane/index.html. To view images collected during post-Hurricane Isaac reconnaissance flights, click on the Hurricane Isaac link. To learn more about marsh dieback or brown marsh, visit http://www.nwrc.usgs.gov/about/capabilities/brwnmrsh.htm.
Seeing the Surge: Collecting Sensors and Gathering High Water Marks
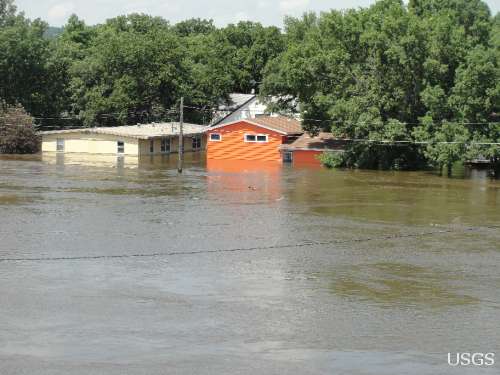
USGS field crews responded to the storm deploying 170 storm surge sensors and rapid deployment gauges along the Gulf coast between Mobile Bay in Alabama and Venice, Louisiana. Now those sensors are being collected and the data are being analyzed.
Surge elevations ranged from more than five feet in eastern Mississippi to nearly 11 feet west of Bay St. Louis. Along the North Shore of Lake Pontchartrain, surge elevation ranged from six feet to over seven and a half feet near Madisonville, Louisiana. The LaPlace area southwest of Lake Pontchartrain experienced over five feet of surge elevation, but the worst hit was the Plaquemines Parish area, where flooding continues to impede access to USGS sensors. All data (provisional and subject to change upon review) are available via interactive mapper.
In addition to in measuring storm-tide, more than 75 independent high-water marks have been recorded to provide additional points between the sensors to document the extent and magnitude of storm surge from Isaac. Rains from Hurricane Isaac cause record flows on Mississippi streams. Inland flooding was recorded in Mississippi on the Wolf River, Black Creek and Wiggins. Three stations in southeastern Louisiana had the second highest peak stage of record ever recorded at these sites. Bogue Chitto River near Bush, La. peaked at 19.82 feet on September 2nd; Bogue Chitto River at Franklinton, La. also peaked on September 2nd with a high-water mark of 22.13 feet; Tangipahoa River at Robert, La. peaked on September 1 with high water mark of 24.02 feet.

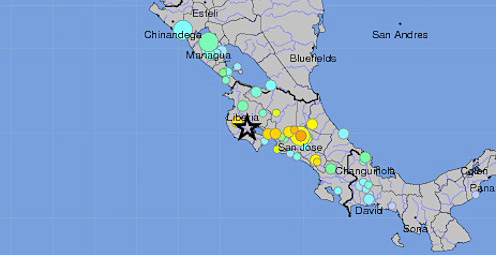
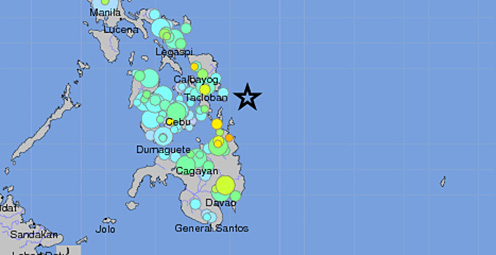
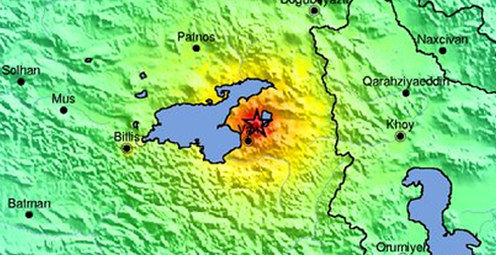
A magnitude 7.6 earthquake struck near the west coast of Costa Rica on September 5, 2012 at 14:42:10 UTC. Read more
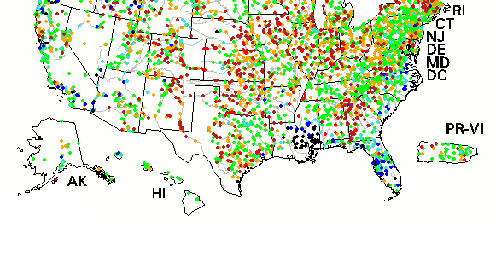
Real-time map showing the extent of flooding (black dots) and drought (red dots) in the U.S. Read more
USGS scientists, engineers, and technicians are working along the Gulf coast in response to Hurricane Isaac. Read more
USGS scientists are providing up-to-date information. Read more
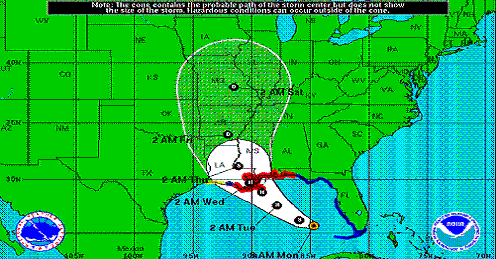
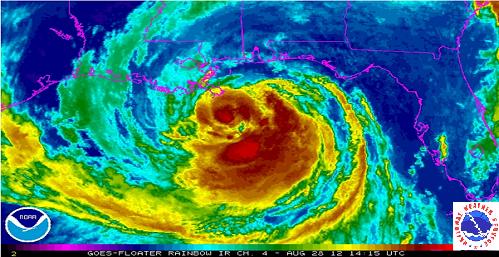
The U.S. Geological Survey is keeping careful watch as Tropical Storm Isaac continues to track northwest toward the west coast of Florida and the Gulf of Mexico. Read more
It was one of the largest recorded earthquakes to occur in the east over the last century. Find out what scientists have learned in the past year. Read more

USGS scientists improve systems to monitor and forecast volcanic activity and track volcanic ash to help communities prepare. Read more
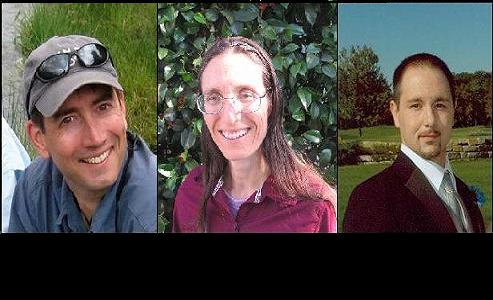
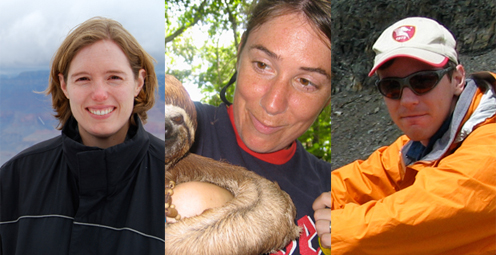
These 3 young scientists have forged ahead with innovative research at the frontiers of science. Learn more

The majority of the nation is facing dry conditions; in most areas drought conditions are expected to persist or intensify. Read more
The new “Did You See It?” website collects citizen observations of landslides. Read more
Please comment on the USGS’ draft science strategies! Read more
Citizen volunteers, portable instruments, and real-time maps help improve gathering of and access to earthquake data.Read more
The USGS and partners are designing an earthquake early warning system for California to help save lives and property.
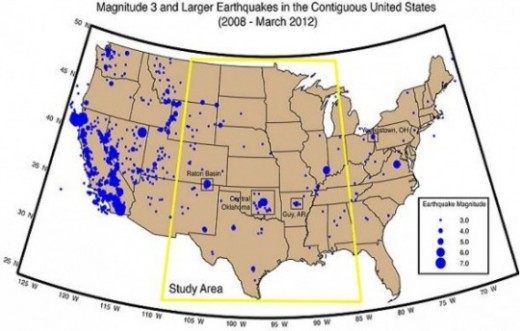
Science or Soundbite? Is the recent increase in midcontinent earthquakes natural or man-made? Find out here.
Timing is everything! Consider helping track changes in spring’s arrival
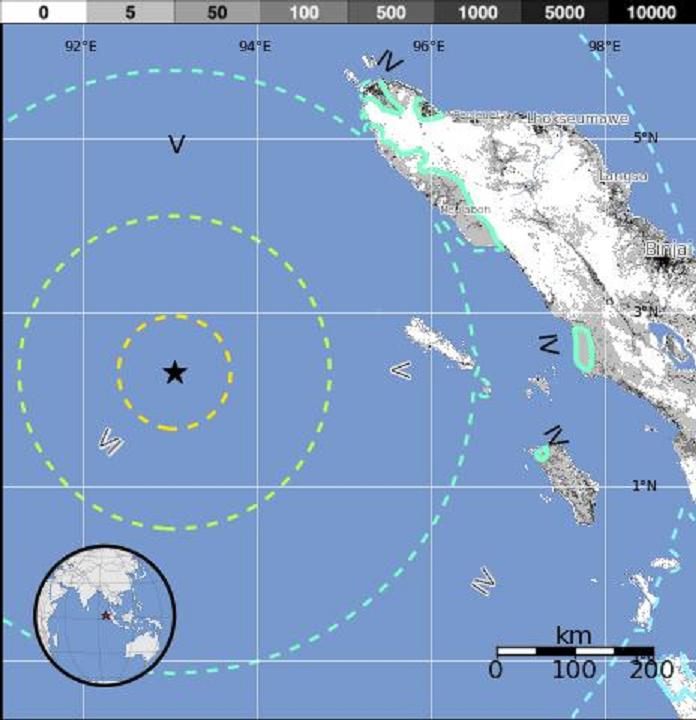
A magnitude-8.6 earthquake struck off the west coast of northern Sumatra Wednesday, April 11, 2012, at 8:38 a.m., UTC at the epicenter.
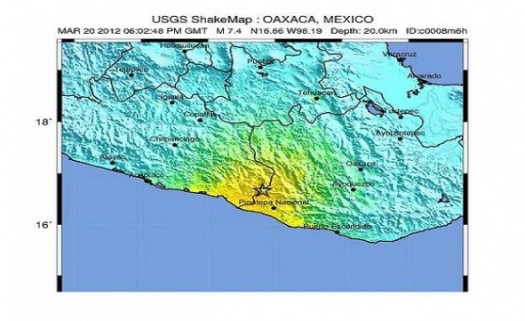
A magnitude-7.4 earthquake struck in the Mexican state of Oaxaca Tuesday, March 20, 2012, at 12:02 p.m., local time at the epicenter.
Flood Safety Awareness Week is March. 12-16. What can you do to prepare?
National Groundwater Awareness Week is Mar. 11-17, 2012. See how USGS science is connecting groundwater and surface water.
Since Japan’s March 11, 2011, Tohoku earthquake and subsequent tsunami, scientists at the USGS have learned much to help better prepare for a large earthquake in the United States.

Five USGS employees honored with Distinguished Service Awards for their service to the nation
The proposed USGS budget reflects research priorities to respond to nationally relevant issues, including water quantity and quality, ecosystem restoration, hydraulic fracturing, natural disasters such as floods and earthquakes, and support for the National Ocean Policy, and has a large R&D component.
Exploding lakes in Cameroon, Africa, have killed people and livestock. Find out how USGS science is helping prevent such an event from occurring again.
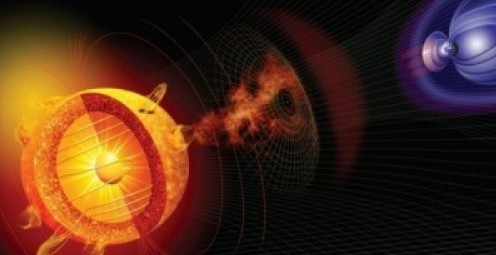
Everyone is familiar with weather systems on earth like rain, wind and snow. But space weather – variable conditions in the space surrounding Earth – has important consequences for our lives inside Earth’s atmosphere.

Scientists and communities are working together to make science more useful and communities safer. What one emergency manager has to say.
Modern volcano monitoring in the United States began with the founding of the Hawaiian Volcano Observatory in 1912. Living with volcanoes
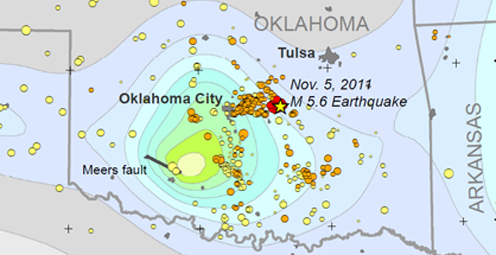
Shaking from Oklahoma's M5.6 main shock, the largest quake in the State's history, was felt from St. Louis to Lubbock. Number of quakes increasing in Oklahoma
A magnitude-7.2 earthquake struck eastern Turkey on Sunday, October 23, 2011. History of strong earthquakes
It's only the beginning of their careers, but these 3 young scientists have forged ahead with innovative research at the frontiers of science. How they've transformed their fields
Oct. 9-15, 2011, is Earth Science Week, themed "Our-Ever Changing Earth," and Oct. 12, 2011, is International Day for Natural Disaster Reduction. Answers to questions posed by a changing world
Fire managers and the public can access online maps of current wildfire locations, thanks to a Web-based mapping application provided by the USGS and its partners.
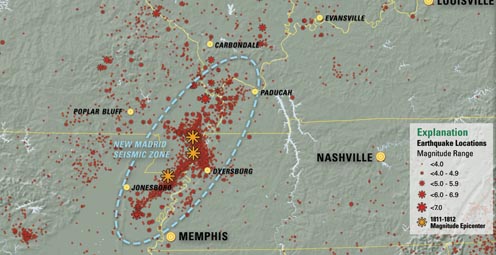
On Feb. 7, 1812, at about 3 a.m., a third, and probably most widely felt of three major earthquakes, occurred in the central Mississippi River Valley. Similar risk today.
Rivers and streams are reaching record levels as a result of Hurricane Irene’s rainfall, with more than 80 USGS streamgages measuring record peaks.
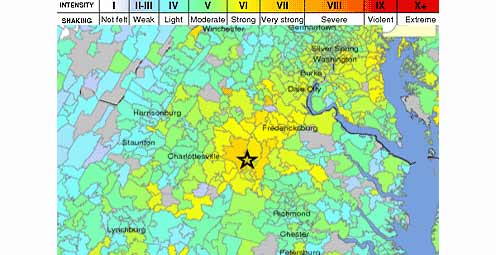
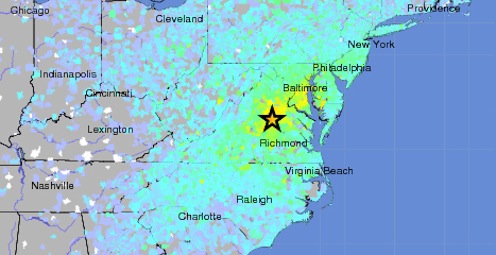
Tuesday, August 23, 2011 at 01:51 PM a 5.8 Earthquake occurred 38 miles outside of Richmond, VA.
A new geologic map of Lassen Volcanic National Park and vicinity has been created. The map area includes the entire Lassen Volcanic Center, parts of three older volcanic centers, and the products of regional volcanism.
To better understand and reduce tsunami hazards, USGS scientists examined sediment deposited by the tsunami in and around Sendai, Japan, as part of an international tsunami survey team organized by Japanese scientific cooperators.
USGS crews continue to measure streamflow and collect water quality and sediment samples in the Ohio and Mississippi River basins using state-of-art instruments.
Many communities in South Dakota, North Dakota, Montana, Colorado, Wyoming and Iowa are dealing with record floodwaters and bracing for more flooding in the upcoming weeks.
Fire managers and the public can access online maps of current wildfire locations, thanks to a web-based mapping application provided by the USGS and its partners.
New Zealand has experienced another damaging earthquake close to the city of Christchurch, which is still recovering from the magnitude-6.1 earthquake that struck in February. This latest quake has resulted in additional damage to buildings and infrastructure.
The USGS-NASA Landsat 5 satellite captured this image of 39-mile track of destruction caused by a massive tornado on June 1 near Sturbridge, MA.
As hurricane season starts, researchers are modeling potential changes to coastal environments to identify communities vulnerable to extreme erosion during storms. Data collected before and after storm landfall are used to verify past forecasts and improve future predictions.
The effects of the March 11 magnitude 9.0 earthquake and resulting tsunami on Japan are being monitored using Landsat satellite data from the USGS.

The most recent earthquake in Japan affected water levels in groundwater wells all over the country. Water level fluctuations were recorded as far away as Illinois, Virginia, Missouri and Florida.

Volcanic activity continues in the Pu`u `O`o crater on Kilauea Volcano's east rift zone and in the Halema`uma`u Crater vent at Kilauea’s summit. Visit the USGS Hawaii Volcanoes Observatory site to get detailed Kilauea and Mauna Loa activity updates, recent volcano photos, recent earthquakes, and more.
Scientists unveil a catastrophic winter storm scenario that could possibly overwhelm California's flood protection system, and significantly disrupt Statewide social and economic systems.
Heavy rainfall could potentially destabilize hillsides. The USGS Landslide Hazards Web site has what you need to know if you live in an area prone to landslides.
The USGS and the National Weather Service have developed a new flood inundation map tool that enables management officials and residents to see where the potential threat of flooding is the highest along the Flint River near Albany, Georgia.

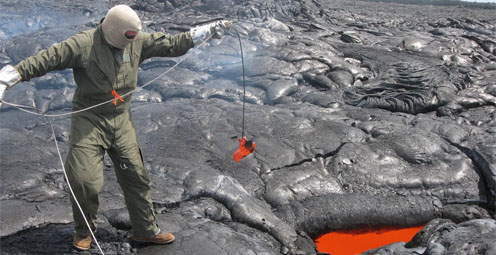
Volcanic eruptions have always been a part of human history; the American experience is no exception. On November 3rd, USGS’s Dr. John Eichelberger discusses new USGS programs which establish monitoring networks on all hazardous US volcanoes, to reduce the effects of volcanic hazards on communities.
Kilauea is Hawaii's youngest volcano and one of the world's most active. Get daily updates on ongoing eruptions from Kilauea's summit and east rift zone.
Looking for information on natural resources, natural hazards, geospatial data, and more? The USGS Education site provides great resources, including lessons, data, maps, and more, to support teaching, learning, K-12 education, and university-level inquiry and research.
The USGS PAGER system (Prompt Assessment of Global Earthquakes for Response) will now include estimated economic loss and casualty information. This system is used by emergency responders, government and aid officials, and the public to understand the scope of the disaster to develop the best response.
Flash flooding is one of the major causes of natural hazard-related deaths in the United States and is hard to predict, but data collected by the USGS is crucial to formulating better predictive models.
The USGS Science Strategy is a comprehensive report to critically examine the USGS's major science goals and priorities for the coming decade. The USGS is moving forward with these strategic science directions in response to the challenges that our Nation's future faces and for the stewards of our Federal lands.
The majority of the nation is still experiencing abnormally dry conditions, even after soaking rains from Isaac. Read more
Real-time map showing the extent of flooding (black dots) and drought (red dots) in the U.S. Read more
USGS scientists, engineers, and technicians are working along the Gulf coast in response to Hurricane Isaac. Read more
The U.S. Geological Survey is keeping careful watch as Tropical Storm Isaac continues to track northwest toward the west coast of Florida and the Gulf of Mexico. Read more
Fifteen years of data illuminate complex interactions driving land change in Puerto Rico. Read more
USGS scientists look to see if water quality is improving. Read more
The majority of the nation is facing dry conditions; in most areas drought conditions are expected to persist or intensify. Read more
Kati is a USGS student employee studying water and traveling the California coast. Read more
This year, a large dead zone again threatens the Gulf of Mexico. Read more
Please comment on the USGS’ draft science strategies! Read more
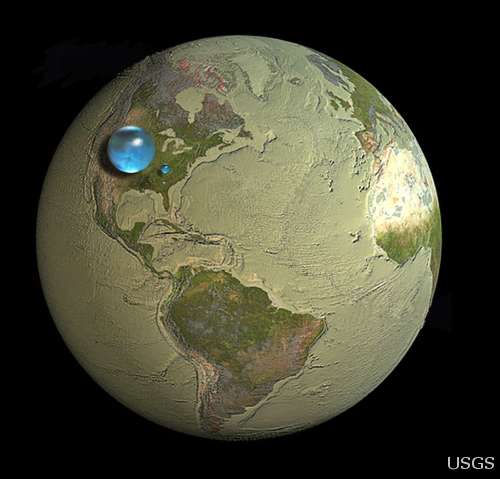
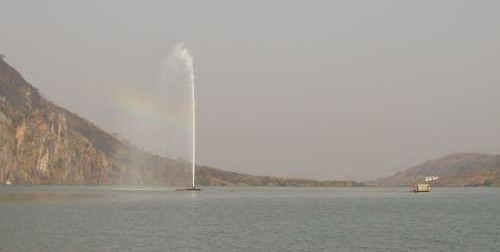
Are you surprised the water bubbles look so small? Read more
USGS Details how climate change could affect water availability in 14 U.S. Basins. Read more
Travis Gibson shares insight into the life a USGS hydrologic technician for one of the USGS water science centers out west. Read more
The USGS plays an integral role in the new U.S. Water Partnership, which will bring together public and private resources to address water challenges around the world.
Timing is everything! Consider helping track changes in spring’s arrival
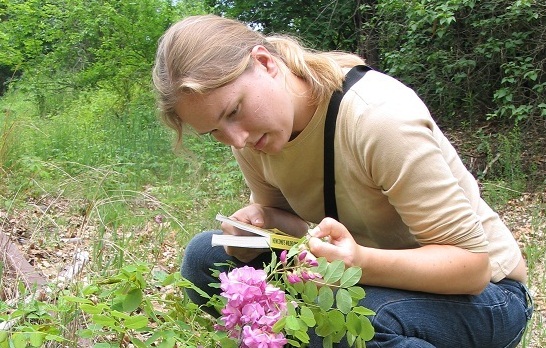
Meet one of the next generation of USGS physical scientists.
Flood Safety Awareness Week is March. 12-16. What can you do to prepare?
National Groundwater Awareness Week is Mar. 11-17, 2012. See how USGS science is connecting groundwater and surface water.
Since Japan’s March 11, 2011, Tohoku earthquake and subsequent tsunami, scientists at the USGS have learned much to help better prepare for a large earthquake in the United States.
Five USGS employees honored with Distinguished Service Awards for their service to the nation
Meet a member of the next generation of USGS hydrologic technicians.
Meet a member of the next generation of USGS hydrologic technicians.
It’s National Invasive Species Awareness Week. Did you know invasive species cost our country more than 100 billion dollars each year? Get to know America’s ten top invaders this week.
Groundwater in aquifers on the East Coast and in the Central U.S. has the highest risk of contamination from radium, a naturally occurring radioactive element and known carcinogen.
The proposed USGS budget reflects research priorities to respond to nationally relevant issues, including water quantity and quality, ecosystem restoration, hydraulic fracturing, natural disasters such as floods and earthquakes, and support for the National Ocean Policy, and has a large R&D component.
Four new reports examine the contaminants polycyclic aromatic hydrocarbons (PAHs) found in house dust, streams, lakes, soil, and air.
Exploding lakes in Cameroon, Africa, have killed people and livestock. Find out how USGS science is helping prevent such an event from occurring again.
A summer intern turned permanent employee discusses his career path. Most memorable moment
Oct. 9-15, 2011, is Earth Science Week, themed "Our-Ever Changing Earth," and Oct. 12, 2011, is International Day for Natural Disaster Reduction. Answers to questions posed by a changing world
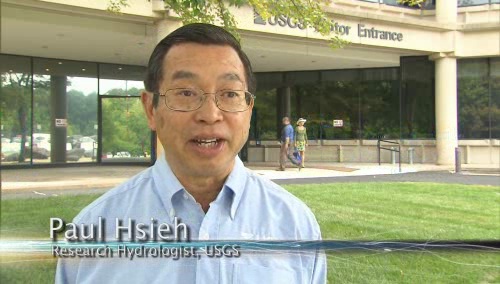
As the team of responders struggled to end the worst oil spill in our Nation’s history, USGS scientist Paul Hsieh provided the critical scientific information needed to make a crucial decision.
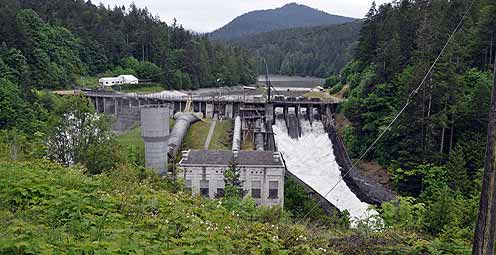
After years of planning, the Department of the Interior has begun removing two dams on the Elwha River in Washington. But how will the removal of these dams impact the river’s sediments, waters, and fish?
As a nation, we use more than 75 billion gallons of groundwater each day. September 13 is the National Groundwater Association’s “Protect Your Groundwater Day.” What we can do to ensure we continue to have enough of it?
USGS scientists are working to characterize the contaminants and habitats for a number of aquatic species along the lower Columbia River.
The effects of drought are felt throughout the United States and the world, and USGS science has a prominent role in understanding the causes and consequences of this hydrological phenomenon.
USGS crews continue to measure streamflow and collect water quality and sediment samples in the Ohio and Mississippi River basins using state-of-art instruments.
Many communities in South Dakota, North Dakota, Montana, Colorado, Wyoming and Iowa are dealing with record floodwaters and bracing for more flooding in the upcoming weeks.
The most recent earthquake in Japan affected water levels in groundwater wells all over the country. Water level fluctuations were recorded as far away as Illinois, Virginia, Missouri and Florida.

Groundwater is one of our most vital natural resources. The USGS studies the quantity and quality of the nation's groundwater. Learn about USGS research in an aquifer near you.
Learn how 3-D modeling is used to examine groundwater and how this cutting edge science is used to solve tomorrow's problems today.
The Great Lakes are the largest freshwater system on Earth. However the basin has the potential for local shortages, according to a new basin-wide water availability assessment by the USGS.
The Department of the Interior has established a new website to find and share websites that provide water conservation and sustainability information.
The USGS is providing information on arsenic levels at the town level in Maine to protect human health and further promote citizen participation in State well-testing programs.
Water Security is the protection of adequate water supplies for food, fiber, industrial, and residential needs for expanding populations, which requires maximizing water-use efficiency, developing new supplies, and protecting water reserves in event of scarcity due to natural, manmade, or technological hazards.
Decreases in stream flow, which are often caused by human activities, affect the integrity of aquatic life in streams, according to a new USGS study.
The USGS and the National Weather Service have developed a new flood inundation map tool that enables management officials and residents to see where the potential threat of flooding is the highest along the Flint River near Albany, Georgia.
Looking for information on natural resources, natural hazards, geospatial data, and more? The USGS Education site provides great resources, including lessons, data, maps, and more, to support teaching, learning, K-12 education, and university-level inquiry and research.
The Chesapeake Bay has long been an R&R destination for DC residents. However, the watershed’s overpopulation contributes to its decline. Join us when USGS’s Scott Phillips and Peter Claggett discuss new science efforts applied to restoring the Nation's largest estuary on October 6th.
The "Flood and high flow" map shows the location of streamgages where the water level is currently above or near flood stage. Find out what rivers and creeks near you are doing.
Nutrient sources in both agricultural and urban areas contribute to elevated nutrient concentrations in streams and groundwater across the Nation.
USGS is playing a critical role in the federal government's coordinated Deepwater Horizon response efforts.
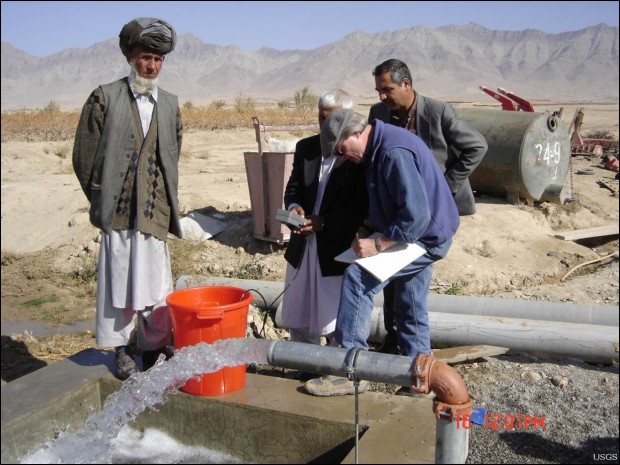
Population growth in the Kabul Basin, Afghanistan, due in part to returning refugees, is estimated to lead to a six-fold increase in drinking water needs by 2057. The USGS has worked in partnership with the Afghanistan Geological Survey to address questions of future water availability.
Flash flooding is one of the major causes of natural hazard-related deaths in the United States and is hard to predict, but data collected by the USGS is crucial to formulating better predictive models.
Did you know that contaminant-ridden dust from Africa may be harming coral reefs in the Caribbean? Scientists at the USGS are examining the air in Africa and in the Caribbean to determine what kinds of nutrients, microbes, and contaminants are traveling across the ocean.
Pharmaceutical manufacturing facilities can be a significant source of pharmaceuticals in surface water. The USGS is working with water utilities to try to reduce the release of pharmaceuticals and other emerging contaminants to the environment.
The United States Group on Earth Observations (USGEO) is working to connect Earth observations with public health, agriculture, climate, and data management and dissemination.
The USGS Science Strategy is a comprehensive report to critically examine the USGS's major science goals and priorities for the coming decade. The USGS is moving forward with these strategic science directions in response to the challenges that our Nation's future faces and for the stewards of our Federal lands.

In response to Hurricane Isaac, USGS has deployed several hundred storm surge sensors to collect information about the effects of Isaac on the Gulf Coast.

Join us on September 5th in Reston, VA for a free public lecture on the 2011 Virginia earthquake!

Join us on August 1 to learn more about the anatomy of flooding: What are the different causes of these extreme events, and how is USGS science helping prepare residents for future foods.

Join us on June 6 for a centennial look at the greatest volcanic eruption of the 20th century at our June Public Lecture!

In recognition of World Forestry Day, let’s take a glimpse at USGS science to understand the fate of forests from climate change.

The Volcano Hazards Program announces the establishment of the USGS California Volcano Observatory (CalVO), which expands and replaces the former Long Valley Observatory.

The U.S. Geological Survey had a very busy 2011 — below are a few of our highlights from last year.

On Nov. 3, USGS scientists Patrick Barnard and William Ellsworth will present a public lecture in Menlo Park, CA, providing Bay Area residents information about USGS research in the San Francisco Bay Area, including recent discoveries beneath San Francisco Bay and ongoing studies to better understand earthquake probabilities and the potential hazards associated with strong ground shaking.

Join USGS scientists on November 2nd to discuss the seismology of the M5.8 Virginia earthquake, its effects, and its context in the geology of Virginia.
In response to Hurricane Isaac, USGS has deployed several hundred storm surge sensors to collect information about the effects of Isaac on the Gulf Coast.

7 p.m.—Public lecture (also live-streamed over the Internet)
Join us on August 1 to learn more about the anatomy of flooding: What are the different causes of these extreme events, and how is USGS science helping prepare residents for future foods.

Join us in Menlo Park for our Evening Lecture on Scanning the Seafloor with Sound!

Stressed agricultural lands may be releasing less of the moisture needed to protect the breadbasket of a continent.
The U.S. Geological Survey had a very busy 2011 — below are a few of our highlights from last year.

Over the next 10 years, the USGS plans to conduct a new assessment of water availability and use. This national Water Census will address critical aspects of recent Federal legislation, including the need to establish a national water assessment program.

Recent USGS research shows that climate, vegetation, groundwater recharge rate, and proximity of the contaminants to the water table can all affect and control natural removal rates.
USGS scientists will join thousands of scientists, managers, and decision makers in Boston this week to present new findings on toxics at the Society for Environmental Toxicology and Chemistry (SETAC) conference in the Hynes Convention Center, Nov. 13-17.
On Nov. 3, USGS scientists Patrick Barnard and William Ellsworth will present a public lecture in Menlo Park, CA, providing Bay Area residents information about USGS research in the San Francisco Bay Area, including recent discoveries beneath San Francisco Bay and ongoing studies to better understand earthquake probabilities and the potential hazards associated with strong ground shaking.

Rivers and streams in the United States are releasing substantially more carbon dioxide into the atmosphere than previously thought.

Meet the R/V Muskie and the R/V Kaho, the USGS Great Lakes Science Center's two newest additions to its Great Lakes research fleet!

![]() U.S. Department of the Interior |
U.S. Geological Survey
U.S. Department of the Interior |
U.S. Geological Survey
URL: www.usgs.gov/blogs/features/usgs_top_story/isaac/
Page Contact Information: Ask USGS
Page Last Modified: September 26, 2011


