Projects Created at the 1.USA.gov Hack Day
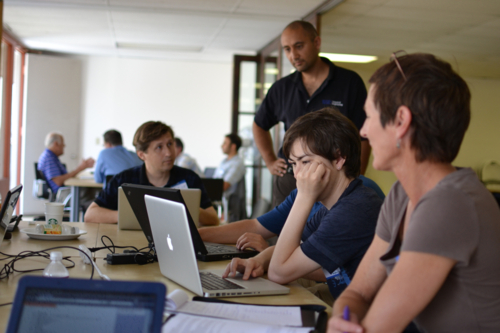
Participants working at the 1.USA.gov Hack Day in San Diego.
A week ago, we held the first 1.USA.gov Hack Day, a nationwide event organized to encourage people to explore the data created by our URL shortening service 1.USA.gov.
Hack day events took place in Washington, D.C., New York City, San Francisco, and San Diego. Over 120 people attended the events and explored ways to use 1.USA.gov data to help people find useful and interesting government information.
1.USA.gov automatically creates .gov URLs whenever you use bitly to shorten a URL that ends in .gov or .mil. We created this service to make it easy for people to know when a short URL will lead to official, and trustworthy, government information.
Data is created every time someone clicks on a 1.USA.gov link, which happens about 56,000 times each day. Together, these clicks show what government information people are sharing with their friends and networks. No one has ever had such a broad view of how government information is viewed and shared online.
Here are some examples of what Hack Day participants built with data from 1.USA.gov:
Find government links that are popular near you
Robert, a consultant and professor from San Diego State University, built a tool that lets you see which links were most popular in the past 24 hours near your city or within your country. Try it out and see what’s popular near you.
See where NASA is most popular
Adam Laiacano, an engineer who lives in Brooklyn, NY, analyzed 1.USA.gov data and found that 42% of all clicks on 1.USA.gov links go to NASA websites. He created a map that shows that people in Europe are more likely to only click on NASA links, while people in the United States click on links from a wider variety of government links. See Adam’s map on his blog.
Watch as government links are clicked all over the world
Helmut Hissen, a software engineer, made this animation that shows clicks on 1.USA.gov links from June 2 through July 14:
In the video, red flashes represent clicks from non-mobile devices, and green flashes represent clicks from mobile devices. Note that the final NASA Shuttle launch occurred on July 8. You can see a dramatic increase in activity at the 1:24 mark.
See which links are most popular right now
Barg Upender and Adam, software engineers in Washington, D.C., created a site called PopGov.us that shows which government links are popular in real time.
Create your own hacks
If you are interested in working with 1.USA.gov data, you can find everything you need to know, including links to code from the Hack Day and a full list of projects on the USA.gov Developer Resources page.
If you want to share your creation with us, leave a comment on this post or tweet about it using the hashtag #1USAgov.
