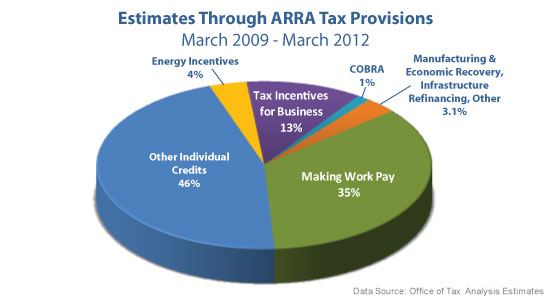
The Office of Tax Analysis estimates that, as of March 2012, $297.8 billion in tax benefits has been made available. The benefits come in various forms including the Making Work Pay tax credit, COBRA Continuation Coverage Assistance, and tax incentives for businesses.
| Mar '09 |
$2.3 |
$0.0 |
$0.0 |
$0.1 |
$0.8 |
$0.0 |
$3.2 |
| Jun '09 |
$15.0 |
$8.5 |
$0.4 |
$14.4 |
$4.9 |
$0.0 |
$43.2 |
| Sep '09 |
$26.9 |
$18.1 |
$0.9 |
$25.4 |
$8.9 |
$3.5 |
$83.8 |
| Dec '09 |
$36.9 |
$21.6 |
$2.2 |
$33.3 |
$3.7 |
$1.2 |
$99.1 |
| Mar '10 |
$64.4 |
$49.1 |
$1.5 |
$40.5 |
$6.0 |
$1.0 |
$162.7 |
| Jun '10 |
$73.0 |
$98.0 |
$7.3 |
$38.5 |
$4.8 |
$1.4 |
$223.0 |
| Sep '10 |
$82.6 |
$108.6 |
$8.2 |
$36.2 |
$5.6 |
$2.1 |
$243.4 |
| Dec '10 |
$89.3 |
$122.5 |
$9.3 |
$33.4 |
$3.7 |
$1.9 |
$259.9 |
| Mar '11 |
$99.2 |
$143.2 |
$9.8 |
$32.4 |
$3.7 |
$4.4 |
$292.7 |
| Jun '11 |
$104.1 |
$136.4 |
$10.3 |
$36.9 |
$3.7 |
$7.1 |
$298.5 |
| Sep '11 |
$104.1 |
$136.4 |
$10.8 |
$35.4 |
$3.7 |
$9.6 |
$300.1 |
| Dec '11 |
$104.4 |
$136.3 |
$10.8 |
$34.5 |
$3.7 |
$10.2 |
$299.8 |
Back to Featured Stories