Skip directly to search Skip directly to A to Z list Skip directly to navigation Skip directly to site content Skip directly to page options
CDC Home

Data and Statistics

Obesity rates among all children in the United States

(Data from the National Health and Nutrition Examination Survey)

[Read article]

  • Approximately 17% (or 12.5 million) of children and adolescents aged 2—19 years are obese.
  • Since 1980, obesity prevalence among children and adolescents has almost tripled.
  • There are significant racial and ethnic disparities in obesity prevalence among U.S. children and adolescents. In 2007—2008, Hispanic boys, aged 2 to 19 years,were significantly more likely to be obese than non-Hispanic white boys, and non-Hispanic black girls were significantly more likely to be obese than non-Hispanic white girls.

Obesity rates among low-income preschool children

(Data from the Pediatric Nutrition Surveillance System)

  • 1 of 7 low-income, preschool-aged children is obese. [Check out this Fact Sheet to learn more (PDF-1.5Mb)]
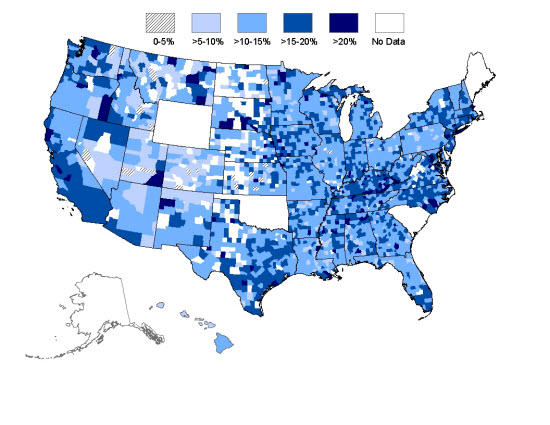
  • County obesity rates are variable within states. Even states with the lowest prevalence of obesity have counties where many low-income children are obese and at risk for chronic disease.


2011 State Prevalence Among Low-Income Children Aged 2 to 4 Years

2011 obesity rates for states, U.S. territories, and Indian Tribal Organizations (ITOs) that contributed data to the 2011  Pediatric Nutrition Surveillance System. No contributors had obesity rates of less than 5%.  Obesity rates greater than 5% to 10% include Colorado, Hawaii and Utah. Obesity rates greater than 10% to 15% include Alabama, Arizona, Arkansas, Florida, Georgia, Idaho, Illinois, Indiana, Iowa, Kansas, Louisiana, Michigan, Minnesota, Mississippi, Missouri, Montana, Nebraska, Nevada, New Hampshire, New Mexico, New York, North Dakota, Ohio, Oregon, Pennsylvania, Tennessee, Texas, Vermont, Washington, West Virginia, Wisconsin, the District of Columbia and the U.S. Virgin Islands.  Obesity rates greater than 15% to 20% include California, Connecticut, Kentucky, Maryland, Massachusetts, New Jersey, North Carolina, Rhode Island, South Dakota, Virginia, and these U.S. territories and ITOs: the Navajo Nation, and Puerto Rico. Obesity rates greater than 20% include the Cheyenne River Sioux (SD), Inter Tribal Council of Arizona, the Choctaw-MS, the Rosebud Sioux, the Standing Rock Sioux (ND),and the Three Affiliated Tribes (ND)


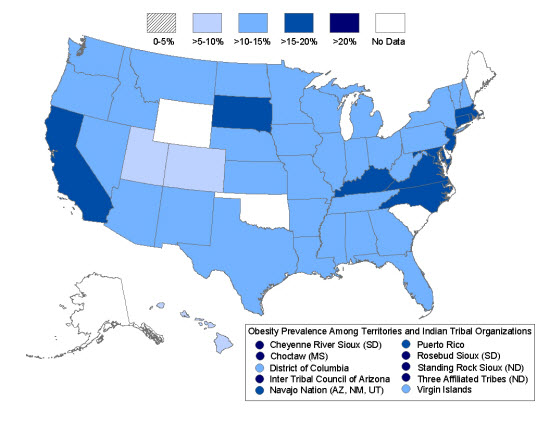
2009—2011 County Obesity Prevalence Among Low-Income Children
Aged 2 to 4 Years

Obesity rates were found to be highest in Indian Tribal Organizations, in western and southern California, southern Texas, the central and north eastern seaboard, some Appalachian states, and in counties touching the Pacific Ocean. Several counties in the Rocky Mountains have prevalence rates below 10%.


Contact Us:
  • Centers for Disease Control and Prevention
    1600 Clifton Rd
    Atlanta, GA 30333
  • 800-CDC-INFO
    (800-232-4636)
    TTY: (888) 232-6348
    24 Hours/Every Day
  • cdcinfo@cdc.gov
USA.gov: The U.S. Government's Official Web PortalDepartment of Health and Human Services
Centers for Disease Control and Prevention   1600 Clifton Rd. Atlanta, GA 30333, USA
800-CDC-INFO (800-232-4636) TTY: (888) 232-6348 - cdcinfo@cdc.gov
A-Z Index
  1. A
  2. B
  3. C
  4. D
  5. E
  6. F
  7. G
  8. H
  9. I
  10. J
  11. K
  12. L
  13. M
  14. N
  15. O
  16. P
  17. Q
  18. R
  19. S
  20. T
  21. U
  22. V
  23. W
  24. X
  25. Y
  26. Z
  27. #