Climate Change
Causes of Climate Change
On This Page
Key Points
- Both natural and human factors change Earth’s climate.
- Before humans, changes in climate resulted entirely from natural causes such as changes in Earth’s orbit, changes in solar activity, or volcanic eruptions.
- Since the Industrial Era began, humans have had an increasing effect on climate, particularly by adding billions of tons of heat-trapping greenhouse gases to the atmosphere.
- Most of the observed warming since the mid-20th century is due to human-caused greenhouse gas emissions.
Earth’s temperature is a balancing act
Earth’s temperature depends on the balance between energy entering and leaving the planet’s system . When incoming energy from the sun is absorbed by the Earth system, Earth warms. When the sun’s energy is reflected back into space, Earth avoids warming. When energy is released back into space, Earth cools. Many factors, both natural and human, can cause changes in Earth’s energy balance, including:
 View enlarged image
Models that account only for the effects of natural processes are not able to explain the warming over the past century. Models that also account for the greenhouse gases emitted by humans are able to explain this warming.
Source: USGRCP (2009)
- Changes in the greenhouse effect, which affects the amount of heat retained by Earth’s atmosphere
- Variations in the sun’s energy reaching Earth
- Changes in the reflectivity of Earth’s atmosphere and surface
These factors have caused Earth’s climate to change many times.
Scientists have pieced together a picture of Earth’s climate, dating back hundreds of thousands of years, by analyzing a number of indirect measures of climate such as ice cores, tree rings, glacier lengths, pollen remains, and ocean sediments, and by studying changes in Earth’s orbit around the sun. [1]
The historical record shows that the climate system varies naturally over a wide range of time scales. In general, climate changes prior to the Industrial Revolution in the 1700s can be explained by natural causes, such as changes in solar energy, volcanic eruptions, and natural changes in greenhouse gas (GHG) concentrations. [1]
Recent climate changes, however, cannot be explained by natural causes alone. Research indicates that natural causes are very unlikely to explain most observed warming, especially warming since the mid-20th century. Rather, human activities can very likely explain most of that warming. [1]

Click on the image to open a lightbox that explains radiative forcing. The discussion includes both natural and human-induced climate forcings.
Radiative Forcing
Radiative forcing is a measure of the influence of a particular factor (e.g. greenhouse gases (GHGs), aerosols, or land use changes) on the net change in Earth’s energy balance. On average, a positive radiative forcing tends to warm the surface of the planet, while a negative forcing tends to cool the surface.
GHGs have a positive forcing because they absorb energy radiating from Earth’s surface, rather than allowing it to be directly transmitted into space. This warms the atmosphere like a blanket. Aerosols, or small particles, can have a positive or negative radiative forcing, depending on how they absorb and emit heat or reflect light. For example, black carbon aerosols have a positive forcing since they absorb sunlight. Sulfate aerosols have a negative forcing since they reflect sunlight back out into space.
The National Oceanic and Atmospheric Administration’s Annual Greenhouse Gas Index, which tracks changes in radiative forcing from GHGs over time, shows that such forcing from human-added GHGs has increased 27.5% between 1990 and 2009. Increases in carbon dioxide (CO2) in the atmosphere are responsible for 80% of the increase. The contribution to radiative forcing by methane (CH4) and chlorofluorocarbons (CFCs) has been nearly constant or declining, respectively, in recent years.
The Greenhouse Effect causes the atmosphere to retain heat
When sunlight reaches Earth’s surface, it can either be reflected back into space or absorbed by Earth. Once absorbed, the planet releases some of the energy back into the atmosphere as heat (also called infrared radiation). Greenhouse gases (GHGs) like water vapor (H2O), carbon dioxide (CO2), and methane (CH4) absorb energy, slowing or preventing the loss of heat to space. In this way, GHGs act like a blanket, making Earth warmer than it would otherwise be. This process is commonly known as the “greenhouse effect”.

This slideshow explains the Greenhouse Effect, among other topics.
The Role of the Greenhouse Effect in the Past
In the distant past (prior to about 10,000 years ago), CO2 levels tended to track the glacial cycles. During warm ‘interglacial’ periods, CO2 levels have been higher. During cool ‘glacial’ periods, CO2 levels have been lower. [1] [2] This is because the heating or cooling of Earth’s surface can cause changes in greenhouse gas concentrations. [1] These changes often act as a positive feedback, amplifying existing temperature changes. [1]
 View enlarged image
Estimates of the Earth’s changing carbon dioxide (CO2) concentration (top) and Antarctic temperature (bottom), based on analysis of ice core data extending back 800,000 years. Until the past century, natural factors caused atmospheric CO2 concentrations to vary within a range of about 180 to 300 parts per million by volume (ppmv). Warmer periods coincide with periods of relatively high CO2 concentrations. NOTE: The past century’s temperature changes and rapid CO2 rise (to 390 ppmv in 2010) are not shown here. Increases over the past half century are shown in the Recent Role section
Source: Based on data appearing in NRC (2010)

Click on the image to open a lightbox that explains radiative forcing.
Feedbacks [1] can amplify or reduce changes
Climate feedbacks amplify or reduce direct warming and cooling effects. They do not change the planet’s temperature directly. Feedbacks that amplify changes are called positive feedbacks. Feedbacks that counteract changes are called negative feedbacks. Feedbacks are associated with changes in surface reflectivity, clouds, water vapor, and the carbon cycle.
Water vapor appears to cause the most important positive feedback. As Earth warms, the rate of evaporation and the ability of air to hold water vapor both rise, increasing the amount of water vapor in the air. Because water vapor is a greenhouse gas (GHG), this leads to further warming.
The melting of Arctic sea ice is another example of a positive climate feedback. As temperatures rise, sea ice retreats. The loss of ice exposes the underlying sea surface, which is darker and absorbs more sunlight than ice, increasing the total amount of warming.
Some types of clouds cause a negative feedback. Warming temperatures can increase the amount or reflectivity of these clouds, reflecting more sunlight back into space, cooling the surface of the planet. Other types of clouds, however, contribute a positive feedback.
There are also several positive feedbacks that increase the concentration of GHGs. For example, as temperatures warm:
Natural processes that are affected by warming, such as permafrost thawing, tend to release more carbon dioxide (CO2).
- The ocean releases CO2 into the atmosphere and absorbs atmospheric CO2 at a slower rate.
- Several types of land surfaces may release more methane (CH4).
These changes lead to higher concentrations of atmospheric GHGs and contribute to increased warming.
Related Links:
The Recent Role of the Greenhouse Effect
Since the Industrial Revolution began around 1750, human activities have contributed substantially to climate change by adding CO2 and other heat-trapping gases to the atmosphere. These greenhouse gas emissions have increased the greenhouse effect and caused Earth’s surface temperature to rise. The primary human activity affecting the amount and rate of climate change is greenhouse gas emissions from the burning of fossil fuels.
The Main Greenhouse Gases
The most important GHGs directly emitted by humans include CO2, CH4, nitrous oxide (N2O), and several others. The sources and recent trends of these gases are detailed below.
Carbon dioxide
Carbon dioxide is the primary greenhouse gas that is contributing to recent climate change. CO2 is absorbed and emitted naturally as part of the carbon cycle, through animal and plant respiration, volcanic eruptions, and ocean-atmosphere exchange. Human activities, such as the burning of fossil fuels and changes in land use, release large amounts of carbon to the atmosphere, causing CO2 concentrations in the atmosphere to rise.

This slideshow describes the carbon cycle, among other topics. {Click to play.}
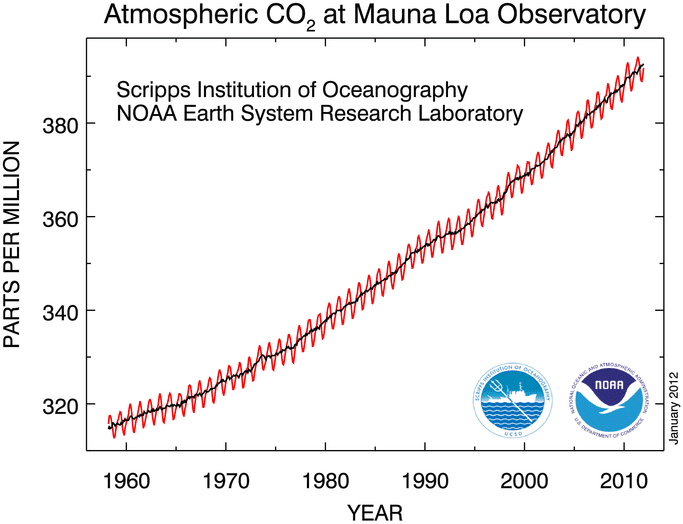
, but the parts per million increases steadily from just below 320 parts per million in 1960 to over 390 parts per million around 2010.") View enlarged image
View enlarged image
Carbon dioxide concentration has risen from pre-industrial levels of 280 parts per million by volume (ppmv) to about 390 ppmv in 2010. Since 1958 alone (shown here), concentrations have risen by 75 ppmv. Source: NOAA
Atmospheric CO2 concentrations have increased by almost 40% since pre-industrial times, from approximately 280 parts per million by volume (ppmv) in the 18th century to 390 ppmv in 2010. The current CO2 level is higher than it has been in at least 800,000 years. [1]
Some volcanic eruptions released large quantities of CO2 in the distant past. However, the U.S. Geological Survey (USGS) reports that human activities now emit more than 135 times as much CO2 as volcanoes each year.
Human activities currently release over 30 billion tons of CO2 into the atmosphere every year. [1] This build-up in the atmosphere is like a tub filling with water, where more water flows from the faucet than the drain can take away.
 is much larger than the drain (or sinks of carbon) and that as global termperature increases the size of the drain will decrease. Writing to the right of the image explains that: If the amount of water flowing into a bathtub is greater than the amount of water leaving through the drain, the water level will rise. Carbon dioxide emissions are like the flow of water into the world’s carbon bathtub. 'Sources' of carbon dioxide emissions such as fossil fuel burning, cement manufacture, and land use are like the bathtub's faucet. 'Sinks' of carbon dioxide in the ocean and on land (such as plants) that take up carbon dioxide are like the drain. Today, human activities have turned up the flow from the carbon dioxide 'faucet', which is much larger than the 'drain' can cope with, and the level of carbon dioxide in the atmosphere (like the level of water in a bathub) is rising.")
For more information on the human and natural sources and sinks of CO2 emissions, see the Carbon Dioxide page in the Greenhouse Gas Emissions section of the website.
Methane
Methane is produced through both natural and human activities. For example, natural wetlands, agricultural activities, and fossil fuel extraction and transport all emit CH4.
 View enlarged image
This graph shows the increase in greenhouse gas (GHG) concentrations in the atmosphere over the last 2,000 years. Increases in concentrations of these gases since 1750 are due to human activities in the industrial era. Concentration units are parts per million (ppm) or parts per billion (ppb), indicating the number of molecules of the greenhouse gas per million or billion molecules of air.
Source: USGCRP (2009)
Methane is more abundant in Earth’s atmosphere now than at any time in at least the past 650,000 years. [2] Due to human activities, CH4 concentrations increased sharply during most of the 20th century and are now more than two-and-a-half times pre-industrial levels. In recent decades, the rate of increase has slowed considerably. [1]
For more information on CH4 emissions and sources, and actions that can reduce emissions, see EPA’s Methane page in the Greenhouse Gas Emissions section of the website.
Nitrous oxide
Nitrous oxide is produced through natural and human activities, mainly through agricultural activities and natural biological processes. Fuel burning and some other processes also create N2O. Concentrations of N2O have risen approximately 18% since the start of the Industrial Revolution, with a relatively rapid increase towards the end of the 20th century.
[3]
In contrast, the atmospheric concentration of N2O varied only slightly for a period of 11,500 years before the onset of the industrial period, as shown by ice core samples.
[3]
For more information on N2O emissions and sources, and actions that can reduce emissions, see EPA’s Nitrous Oxide page in the Emissions section of the website.
Other Greenhouse Gases
Click on the image to open a lightbox that explains how global warming potentials describe the impact of each gas.

- Water vapor is the most abundant greenhouse gas and also the most important in terms of its contribution to the natural greenhouse effect, despite having a short atmospheric lifetime. Some human activities can influence local water vapor levels. However, on a global scale, the concentration of water vapor is controlled by temperature, which influences overall rates of evaporation and precipitation. [1] Therefore, the global concentration of water vapor is not substantially affected by direct human emissions.
- Tropospheric ozone (O3), which also has a short atmospheric lifetime, is a potent greenhouse gas. Chemical reactions create ozone from emissions of nitrogen oxides and volatile organic compounds from automobiles, power plants, and other industrial and commercial sources in the presence of sunlight. In addition to trapping heat, ozone is a pollutant that can cause respiratory health problems and damage crops and ecosystems.
- Chlorofluorocarbons (CFCs), hydrochlorofluorocarbons (HCFCs), hydrofluorocarbons (HFCs), perfluorocarbons (PFCs), and sulfur hexafluoride (SF6), together called F-gases, are often used in coolants, foaming agents, fire extinguishers, solvents, pesticides, and aerosol propellants. Unlike water vapor and ozone, these F-gases have a long atmospheric lifetime, and some of these emissions will affect the climate for many decades or centuries.
For more information on greenhouse gas emissions, see the Greenhouse Gas Emissions section. To learn more about actions that can reduce these emissions, see the What You Can Do section.
Global warming potential describes impact of each gas
Certain greenhouse gases (GHGs) are more effective at warming Earth (“thickening the blanket”) than others.The two most important characteristics of a greenhouse gas in terms of climate impact are how well the gas absorbs energy (preventing it from immediately escaping to space), and how long the gas stays in the atmosphere.
The Global Warming Potential (GWP) for a gas is a measure of the total energy that a gas absorbs over a particular period of time (usually 100 years), compared to carbon dioxide (CO2). [3] The larger the GWP, the more warming the gas causes. For example, methane’s (CH4) 100-year GWP is 21, which means that CH4 will cause 21 times as much warming as an equivalent mass of CO2 over a 100-year time period. [4]
- Carbon dioxide is assigned a GWP of 1 to serve as a baseline for other GWP values. Carbon dioxide emissions cause changes in atmospheric CO2 concentrations that persist for thousands of years.
- Methane has a GWP more than 20 times higher than CO2 for a 100-year time scale. Methane emitted today lasts for only about a decade in the atmosphere. [1] However, on a pound-for-pound basis, CH4 absorbs more energy than CO2, making its GWP higher.
- Nitrous oxide (N2O) has a GWP 300 times that of CO2 for a 100-year timescale. Nitrous oxide emitted today remains in the atmosphere for more than 100 years, on average. [1]
- Chlorofluorocarbons (CFCs), hydrofluorocarbons (HFCs), hydrochlorofluorocarbons (HCFCs), perfluorocarbons (PFCs), and sulfur hexafluoride (SF6) are sometimes called high-GWP gases because, for a given amount of mass, they trap substantially more heat than CO2 . Some HFCs remain in the atmosphere for only a few years, while SF6 can remain in the atmosphere for thousands of years.
For more information on GHGs, please visit the Greenhouse Gas Emissions section.
Changes in the sun’s energy affect how much energy reaches Earth’s system
 View enlarged image
The sun’s energy received at the top of Earth’s atmosphere has been measured by satellites since 1978. It has followed its natural 11-year cycle of small ups and downs, but with no net increase (bottom). Over the same period, global temperature has risen markedly (top).
Source: USGCRP (2009)
Climate is influenced by natural changes that affect how much solar energy reaches Earth. These changes include changes within the sun and changes in Earth’s orbit.
Changes occurring in the sun itself can affect the intensity of the sunlight that reaches Earth’s surface. The intensity of the sunlight can cause either warming (during periods of stronger solar intensity) or cooling (during periods of weaker solar intensity). The sun follows a natural 11-year cycle of small ups and downs in intensity, but the effect on Earth’s climate is small. [1] [5]
Changes in the shape of Earth’s orbit as well as the tilt and position of Earth’s axis can also affect the amount of sunlight reaching Earth’s surface. [1] [2]
Click on the image to open a lightbox that explains how rates of climate change have varied over time.

The Role of the Sun’s Energy in the Past
Changes in the sun’s intensity have influenced Earth’s climate in the past. For example, the so-called “Little Ice Age” between the 17th and 19th centuries may have been partially caused by a low solar activity phase from 1645 to 1715, which coincided with cooler temperatures. The “Little Ice Age” refers to a slight cooling of North America, Europe, and probably other areas around the globe. [1] [2]
Changes in Earth’s orbit have had a big impact on climate over tens of thousands of years. In fact, the amount of summer sunshine on the Northern Hemisphere, which is affected by changes in the planet’s orbit, appears to control the advance and retreat of ice sheets. These changes appear to be the primary cause of past cycles of ice ages, in which Earth has experienced long periods of cold temperatures (ice ages), as well as shorter interglacial periods (periods between ice ages) of relatively warmer temperatures. [1] [2]
Rates of Climate Change [6] have varied over time
Studies of Earth’s past climate suggest periods of relative stability as well as periods of rapid change.
Periods of Relative Stability
Interglacial climate periods such as the present tend to be more stable than cooler, glacial climates. For example, Earth’s climate during the current interglacial period is more stable than the most recent glacial period. The glacial period was characterized by widespread, large, and abrupt climate changes. In contrast, the previous interglacial period was similarly stable.
[1]
This image shows a glacier calving, when a mass of ice suddenly releases and breaks away. Source: USDA
Periods of Abrupt Climate Change
Abrupt climate change refers to sudden (on the order of decades), large changes in some major component of the climate system, with rapid, widespread effects. Abrupt or rapid climate changes tend to frequently accompany transitions between glacial and interglacial periods (and vice versa).
[2]
For example, a significant part of the Northern Hemisphere, particularly around Greenland, may have experienced very rapid warming of 14°F-28°F over several decades during and after the most recent ice age.
[2]
Abrupt climate changes occur when a threshold or ‘tipping point’ in the climate system is crossed, causing large changes or impacts to the climate. Scientific data show that abrupt changes in climate at the regional scale have occurred throughout history and are characteristic of Earth’s climate system. Warming from greenhouse gas emissions, as well as other human changes to the Earth system may increase the possibility of large and abrupt regional or global climatic events.
The Recent Role of the Sun’s Energy
Changes in solar energy continue to affect climate. However, solar activity has been relatively constant, aside from the 11-year cycle, since the mid-20th century and therefore does not explain the recent warming of Earth. Similarly, changes in the shape of Earth’s orbit as well as the tilt and position of Earth’s axis affect temperature on relatively long timescales (tens of thousands of years), and therefore cannot explain the recent warming.
Changes in reflectivity affect how much energy enters Earth’s system
When sunlight reaches Earth, it can be reflected or absorbed. The amount that is reflected or absorbed depends on Earth’s surface and atmosphere. Light-colored objects and surfaces, like snow and clouds, tend to reflect most sunlight, while darker objects and surfaces, like the ocean, forests, or soil, tend to absorb more sunlight.
The term albedo refers to the amount of solar radiation reflected from an object or surface, often expressed as a percentage. Earth as a whole has an albedo of about 30%, meaning that 70% of the sunlight that reaches the planet is absorbed. [1] Absorbed sunlight warms Earth’s land, water, and atmosphere.
Reflectivity is also affected by aerosols. Aerosols are small particles or liquid droplets in the atmosphere that can absorb or reflect sunlight. Unlike greenhouse gases (GHGs), the climate effects of aerosols vary depending on what they are made of and where they are emitted. Those aerosols that reflect sunlight, such as particles from volcanic eruptions or sulfur emissions from burning coal, have a cooling effect. Those that absorb sunlight, such as black carbon (a part of soot), have a warming effect.
The Role of Reflectivity in the Past
Natural changes in reflectivity, like the melting of sea ice or increases in cloud cover, have contributed to climate change in the past, often acting as feedbacks to other processes.
Volcanoes have played a noticeable role in climate. Volcanic particles that reach the upper atmosphere can reflect enough sunlight back to space to cool the surface of the planet by a few tenths of a degree for several years. [1] These particles are an example of cooling aerosols. Volcanic particles from a single eruption do not produce long-term change because they remain in the atmosphere for a much shorter time than GHGs. [1] [7]
The Recent Role of Reflectivity
Human changes in land use and land cover have changed Earth’s reflectivity. Processes such as deforestation, reforestation, desertification, and urbanization often contribute to changes in climate in the places they occur. These effects may be significant regionally, but are smaller when averaged over the entire globe.
In addition, human activities have generally increased the number of aerosol particles in the atmosphere. Overall, human-generated aerosols have a net cooling effect offsetting about one-third of the total warming effect associated with human greenhouse gas emissions. Reductions in overall aerosol emissions can therefore lead to more warming. However, targeted reductions in black carbon emissions can reduce warming. [1] [8]
References:
[1] NRC (2010). Advancing the Science of Climate Change . National Research Council. The National Academies Press, Washington, DC, USA.
[2] Jansen, E., J. Overpeck, K.R. Briffa, J.-C. Duplessy, F. Joos, V. Masson-Delmotte, D. Olago, B. Otto-Bliesner, W.R. Peltier, S. Rahmstorf, R. Ramesh, D. Raynaud, D. Rind, O. Solomina, R. Villalba and D. Zhang (2007). Paleoclimate. In: Climate Change 2007: The Physical Science Basis . Contribution of Working Group I to the Fourth Assessment Report of the Intergovernmental Panel on Climate Change [Solomon, S., D. Qin, M. Manning, Z. Chen, M. Marquis, K.B. Averyt, M. Tignor and H.L. Miller (eds.)]. Cambridge University Press, Cambridge, United Kingdom and New York, NY, USA.
[3] Solomon, S., D. Qin, M. Manning, R.B. Alley, T. Berntsen, N.L. Bindoff, Z. Chen, A. Chidthaisong, J.M. Gregory, G.C. Hegerl, M. Heimann, B. Hewitson, B.J. Hoskins, F. Joos, J. Jouzel, V. Kattsov, U. Lohmann, T. Matsuno, M. Molina, N. Nicholls, J. Overpeck, G. Raga, V. Ramaswamy, J. Ren, M. Rusticucci, R. Somerville, T.F. Stocker, P. Whetton, R.A. Wood and D. Wratt (2007). Technical Summary. In: Climate Change 2007: The Physical Science Basis . Contribution of Working Group I to the Fourth Assessment Report of the Intergovernmental Panel on Climate Change [Solomon, S., D. Qin, M. Manning, Z. Chen, M. Marquis, K.B. Averyt, M. Tignor and H.L. Miller (eds.)]. Cambridge University Press, Cambridge, United Kingdom and New York, NY, USA.
[4] Forster, P., V. Ramaswamy, P. Artaxo, T. Berntsen, R. Betts, D.W. Fahey, J. Haywood, J. Lean, D.C. Lowe, G. Myhre, J. Nganga, R. Prinn, G. Raga, M. Schulz and R. Van Dorland (2007). Changes in Atmospheric Constituents and in Radiative Forcing. In: Climate Change 2007: The Physical Science Basis . Contribution of Working Group I to the Fourth Assessment Report of the Intergovernmental Panel on Climate Change [Solomon, S., D. Qin, M. Manning, Z. Chen, M. Marquis, K.B. Averyt, M. Tignor and H.L. Miller (eds.)]. Cambridge University Press, Cambridge, United Kingdom and New York, NY, USA.
[5] USGCRP (2009). Global Climate Change Impacts in the United States . Thomas R. Karl, Jerry M. Melillo, and Thomas C. Peterson (eds.). United States Global Change Research Program. Cambridge University Press, New York, NY, USA.
[6] NRC (2002). Abrupt Climate Change: Inevitable Surprises . National Research Council. The National Academies Press, Washington, DC, USA.
[7] Hegerl, G.C., F. W. Zwiers, P. Braconnot, N.P. Gillett, Y. Luo, J.A. Marengo Orsini, N. Nicholls, J.E. Penner and P.A. Stott (2007). Understanding and Attributing Climate Change. In: Climate Change 2007: The Physical Science Basis . Contribution of Working Group I to the Fourth Assessment Report of the Intergovernmental Panel on Climate Change [Solomon, S., D. Qin, M. Manning, Z. Chen, M. Marquis, K.B. Averyt, M. Tignor and H.L. Miller (eds.)]. Cambridge University Press, Cambridge, United Kingdom and New York, NY, USA.
[8] UNEP/WMO (2011) Integrated Assessment of Black Carbon and Tropospheric Ozone: Summary for Decision Makers . United Nations Environmental Programme and the World Meteorological Society.