Cancer Rates by Race and Ethnicity
The rate of people getting or dying from cancer varies by race and ethnicity.
Incidence Rates by Race/Ethnicity and Sex
"Incidence rate" means how many people out of a given number get the disease each year. The graph below shows how many people out of 100,000 got cancer each year during the years 1999–2008. The year 2008 is the most recent year for which numbers have been reported. The cancer incidence rate is grouped by race and ethnicity.
For example, you can see that black men had the highest incidence rate for cancer. White men had the second highest rate of getting cancer, followed by white women, black women, and Hispanic men.
All Cancers Combined
Incidence Rates* by Race/Ethnicity and Sex, U.S., 1999–2008
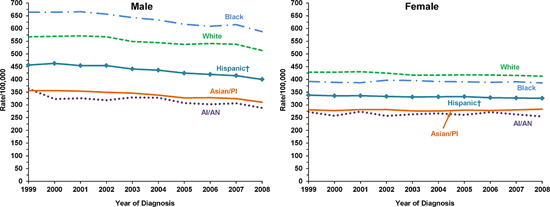
Incidence source: Combined data from the National Program of Cancer Registries as submitted to CDC and from the Surveillance, Epidemiology and End Results program as submitted to the National Cancer Institute in November 2010.
*Rates are per 100,000 persons and are age-adjusted to the 2000 U.S. standard population (19 age groups – Census P25-1130). Incidence rates cover approximately 100% of the U.S. population.
†Hispanic origin is not mutually exclusive from race categories (white, black, Asian/Pacific Islander, American Indian/Alaska Native).
Death Rates by Race/Ethnicity and Sex
From 1999–2008, the rate of people dying from cancer has varied, depending on their race and ethnicity. The graph below shows that in 2008, black men were more likely to die of cancer than any other group. White men had the second highest rate of deaths from cancer, followed by black women, white women, and American Indian/Alaska Native men.
All Cancers Combined
Death Rates* by Race/Ethnicity and Sex, U.S., 1999–2008
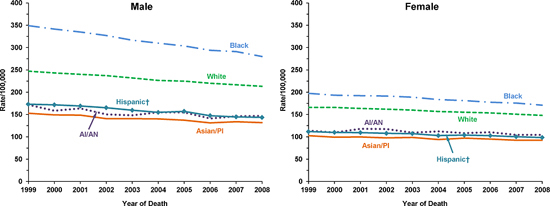
Mortality source: U.S. Mortality Files, National Center for Health Statistics, CDC.
*Rates are per 100,000 persons and are age-adjusted to the 2000 U.S. standard population (19 age groups – Census P25-1130). Death rates cover 100% of the U.S. population.
†Hispanic origin is not mutually exclusive from race categories (white, black, Asian/Pacific Islander, American Indian/Alaska Native).
Contact Us:
- Centers for Disease Control and Prevention
Division of Cancer Prevention and Control
4770 Buford Hwy NE
MS K-64
Atlanta, GA 30341 - 800-CDC-INFO
(800-232-4636)
TTY: (888) 232-6348
8am–8pm ET
Monday–Friday
Closed on Holidays - cdcinfo@cdc.gov
