Breastfeeding among U.S. children born 2000–2009,
CDC National Immunization Survey
| Percent of U.S. children who were breastfed, by birth yeara | |
|---|---|
 |
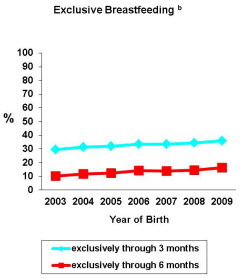 |
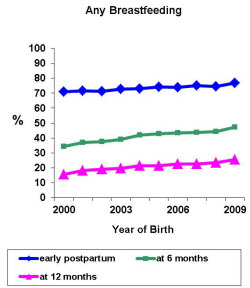
aHealthy People 2020 objectives for breastfeeding in early postpartum period, at 6 months, and 12 months are 81.9%, 60.6%, and 34.1%, respectively. Healthy People 2020 objectives for exclusive breastfeeding through 3 and 6 months of age are 46.2% and 25.5%, respectively. National data about exclusive breastfeeding are not available for children born before 2003. See survey methods for details on study design. |
|
Percentage of U.S. children who were breastfed, by birth year, National Immunization Survey, United States (percent ±half 95% Confidence Interval).
| 2000 | 2001 | 2002 | 2003 | 2004 | 2005 | 2006 | 2007 | 2008 | 2009 (provisionala) |
|
|---|---|---|---|---|---|---|---|---|---|---|
| Early postpartum | 70.9±1.9 | 71.6±1.0 | 71.4±0.9 | 72.6±0.9 | 73.1±0.8 | 74.1±1.0 | 74.0±0.9 | 75.0±0.9 | 74.6±0.9 | 76.9±1.2 |
| At 6 months | 34.2±2.0 | 36.9±1.2 | 37.6±1.0 | 39.1±0.9 | 42.1±0.9 | 42.9±1.1 | 43.5±1.1 | 43.8±1.1 | 44.4±1.1 | 47.2±1.5 |
| At 12 months | 15.7±1.5 | 18.2±0.9 | 19.0±0.8 | 19.6±0.8 | 21.4±0.8 | 21.5±0.9 | 22.7±0.9 | 22.7±1.0 | 23.4±1 | 25.5±1.3 |
| Exclusively through 3 months | 29.6±1.5 | 31.5±0.9 | 32.1±1.0 | 33.6±1.0 | 33.5±1.0 | 34.3±1.1 | 36.0±1.5 | |||
| Exclusively through 6 months | 10.3±1.0 | 12.1±0.7 | 12.3±0.7 | 14.1±0.8 | 13.8±0.8 | 14.6±0.8 | 16.3±1.2 | |||
aInterviews with caregivers of children born in 2009 will continue through December 2012. Provisional rates for children born in 2009 will be updated with final estimates once data becomes available in August 2013. See survey methods for details on study design. |
||||||||||
| Percentage of breastfed U.S. children who are supplemented with infant formula, by birth yeara |
|---|
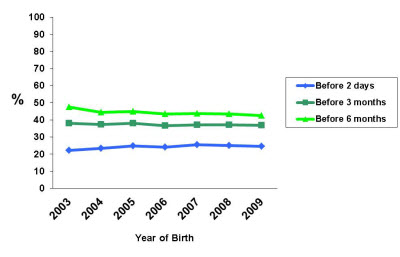 |
aFormula supplementation is defined as supplementation of breast milk with formula (with or without other supplementary liquids or solids) among infants breastfed at the age specified (2 days, 3 months, or 6 months). National data on formula supplementation are not available for children born prior to 2003. See survey methods for details on study design. |
Percentage of breastfed U.S. children who are supplemented with infant formula, by birth yeara
Percentage of breastfed U.S. children who are supplemented with infant formula, by birth yeara by birth year, National Immunization Survey, United States (percentage ± half 95% Confidence Interval)
| 2003 | 2004 | 2005 | 2006 | 2007 | 2008 | 2009 (provisional)a |
|
|---|---|---|---|---|---|---|---|
| Before 2 days | 22.3±1.6 | 23.5±1.0 | 24.9±1.1 | 24.2±1.1 | 25.6±1.2 | 25.1±1.2 | 24.6±1.6 |
| Before 3 months | 38.1±2.2 | 37.4±1.3 | 38.1±1.4 | 36.7±1.4 | 37.1±1.5 | 37.1±1.5 | 36.9±1.9 |
| Before 6 months | 47.4±2.6 | 44.5±1.5 | 45.9±1.7 | 43.6±1.6 | 43.8±2.0 | 43.6±1.7 | 42.6±2.2 |
aInterviews with caregivers of children born in 2009 will continue through December 2012. Provisional rates for children born in 2009 will be updated with final estimates once data becomes available in August 2013. See survey methods for details on study design. |
|||||||
Provisional rates of any and exclusive breastfeeding by age among children born in 2009, National Immunization Surveya,b |
|---|
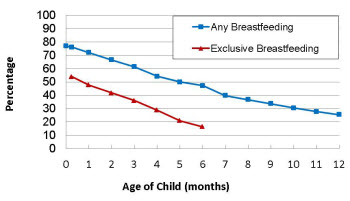 |
a Interviews with caregivers of children born in 2009 will continue through December 2012. Provisional rates for children born in 2009 will be updated with final estimates once data becomes available in August 2013. See survey methods for details on study design. bExclusive breastfeeding is defined as ONLY breast milk — NO solids, no water, and no other liquids. |
Provisional rates of any and exclusive breastfeeding by age among children born in 2009 (percent +/- half 95% confidence interval)a,b
| U.S. National Breastfeeding Rates, 2009 | ||
|---|---|---|
| Child Age | Breastfeeding (n=13,757) |
Exclusive Breastfeeding (n=13,514) |
| At birth | 76.9±1.2 | |
| 7 days | 76.1±1.2 | 53.9±1.5 |
| 14 days | 75.3±1.2 | 51.7±1.5 |
| 21 days | 73.5±1.3 | 49.4±1.5 |
| 28 days | 72.5±1.3 | 48.4±1.5 |
| 42 days | 68.4±1.4 | 43.1±1.5 |
| 1 month | 72.0 ±1.3 | 47.7±1.5 |
| 2 month | 66.5±1.4 | 41.8±1.5 |
| 3 month | 61.3±1.5 | 36.0 ±1.5 |
| 4 month | 54.2±1.5 | 28.8±1.4 |
| 5 month | 50.0 ±1.5 | 21.0 ±1.3 |
| 6 month | 47.2±1.5 | 16.3±1.2 |
| 9 month | 33.7±1.4 | |
| 12 month | 25.5±1.3 | |
| 18 month | 9.0±0.9 | |
aInterviews with caregivers of children born in 2009 will continue through December 2012. Provisional rates for children born in 2009 will be updated with final estimates once data becomes available in August 2013. See survey methods for details on study design. |
||
Tables and Maps
Breastfeeding data shown below are stratified by sociodemographic and geographic characteristics. Provisional data for 2009 and final data for 2007-2008 will be added later when all tables and maps in this series will be released in a new interactive format.
| Tables | Birth Cohorts | |||||||
|---|---|---|---|---|---|---|---|---|
| Any breastfeeding rates | ||||||||
| -by socio-demographic factors | 2007 | 2006 | 2005 | 2004 | 2003 | 2002 | 2001 | 2000 |
| -by state and local areas | 2007 | 2006 | 2005 | 2004 | 2003 | 2002 | 2001 | 2000 |
| Exclusive breastfeeding rates | ||||||||
| -by socio-demographic factors | 2007 | 2006 | 2005 | 2004 | ||||
| -by state and local areas | 2007 | 2006 | 2005 | 2004 | ||||
| Formula supplementation rates | ||||||||
| -by socio-demographic factors | 2007 | 2006 | 2005 | 2004 | ||||
| -by state and local areas | 2007 | 2006 | 2005 | 2004 | ||||
| Breastfeeding rates | ||||||||
| -by child's age | 2007 | 2006 | 2005 | 2004 | 2003 | 2002 | 2001 | 2000 |
| Maps | Birth Cohorts | |||||||
| -Percent of children ever breastfed by state | 2007 | 2006 | 2005 | 2004 | 2003 | 2002 | 2001 | 2000 |
| -Percent of children breastfed at 6 months of age by state | 2007 | 2006 | 2005 | 2004 | 2003 | 2002 | 2001 | 2000 |
| -Percent of children breastfed at 12 months of age by state | 2007 | 2006 | 2005 | 2004 | 2003 | 2002 | 2001 | 2000 |
| -Percent of children exclusively breastfed through 3 months | 2007 | 2006 | 2005 | 2004 | ||||
| -Percent of children exclusively breastfed through 6 months | 2007 | 2006 | 2005 | 2004 | ||||
| Note:The sample size was insufficient to present estimates by sociodemographic or geographic characteristics for the 1999 births. Similarly, data on exclusive breastfeeding and formula supplementation were available on too few of children born in 2003 to enable sociodemographic or geographic breakdowns (survey methods). | ||||||||
