Racial/Ethnic Differences
Differences in the Prevalence and Impact of Arthritis Among Racial/Ethnic Groups in the United States
The following estimates are from our most recent, published analysis of racial/ethnic differences using three years (2002, 2003, and 2006) of data from the National Health Interview Survey. The National Health Interview Survey is a annual health survey of more 30,000 adults conducted by the National Center for Health Statistics. This study reports first-ever national estimates of arthritis prevalence for Asian Americans/Pacific Islanders (8%) and American Indians/Alaska Natives (25%) and documents disparities in work limitation, activity limitation, and severe pain.
Non-Hispanic White
|
23.8% |
|---|---|
Non-Hispanic Black
|
19.4% |
Hispanic
|
11.1% |
American Indian/Alaska Native
|
25.2% |
Asian/Pacific Islander
|
8.4% |
Multiracial/Other
|
20.7% |
Source: National Health Interview Survey 2002, 2003, 2006
*The prevalence of among Hispanics in the 2002, 2003, 2006 and 2008 National Health Interview Survey is described later on this page
Among adults with doctor-diagnosed arthritis more than one-third (37.7%) had arthritis-attributable activity limitations, 31.2% had a work limitation (adults aged 18–64 years), and 25.6% had severe pain. Non-Hispanic blacks and Hispanics had worse arthritis impact despite having the same or lower prevalence of arthritis compared to non-Hispanic whites.
Figure 2. – Activity Limitation Among Adults
with Arthritis by Race/Ethnicity
Non-Hispanic White
|
36.2% |
|---|---|
Non-Hispanic Black
|
44.6% |
Hispanic
|
43.2% |
American Indian/Alaska Native
|
39.1% |
Asian/Pacific Islander
|
38.2% |
Multiracial/Other
|
49.5% |
Source: National Health Interview Survey 2002, 2003, 2006
*The prevalence of among Hispanics in the 2002, 2003, 2006 and 2008 National Health Interview Survey is described later on this page
with Arthritis by Race/Ethnicity
Non-Hispanic White
|
28.8% |
|---|---|
Non-Hispanic Black
|
41.6% |
Hispanic
|
39.7% |
American Indian/Alaska Native
|
37.7% |
Asian/Pacific Islander
|
28.2% |
Multiracial/Other
|
46.4% |
Source: National Health Interview Survey 2002, 2003, 2006
*The prevalence of among Hispanics in the 2002, 2003, 2006 and 2008 National Health Interview Survey is described later on this page
Arthritis by Race/Ethnicity
Non-Hispanic White
|
23.1% |
|---|---|
Non-Hispanic Black
|
38.3% |
Hispanic
|
36.4% |
American Indian/Alaska Native
|
28.7% |
Asian/Pacific Islander
|
18.5% |
Multiracial/Other
|
36.6% |
Source: National Health Interview Survey 2002, 2003, 2006
*The prevalence of among Hispanics in the 2002, 2003, 2006 and 2008 National Health Interview Survey is described later on this page
Physical activity and arthritis self-management education have been proven to reduce pain and improve function among adults with arthritis. Evidence-based programs, including Spanish language and other culturally tailored strategies, should be made more available and accessible to all people with arthritis, and especially racial/ethnic groups with higher rates of pain and activity limitation.
In summary, arthritis is a frequent problem with a large impact on all racial/ethnic groups, but the disabling effects of arthritis (arthritis-attributable activity limitations, work limitations, and severe pain) affect racial/ethnic minorities more frequently. Read more about improving arthritis pain with physical activity.
The burden of arthritis is high across Hispanic subgroups
CDC examined the prevalence of arthritis and its effects among US adults across seven Hispanic subgroups. An estimated 3.1 million Hispanics reported doctor-diagnosed arthritis.
Among Hispanic subgroups, the prevalence of doctor- diagnosed arthritis is highest among Puerto Ricans and lowest among Cuban/Cuban-Americans
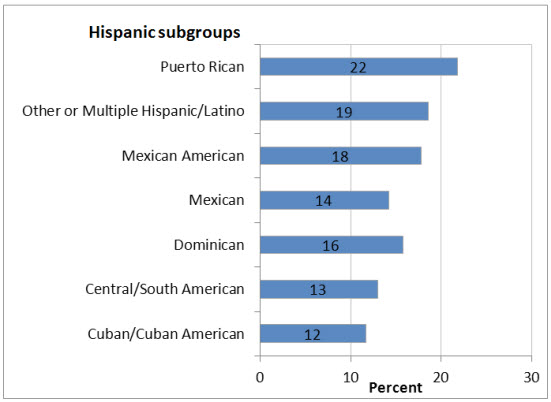
Age-adjusted prevalence of arthritis across Hispanic subgroups
Source: National Health Interview Survey 2002, 2003, 2006 and 2008
Across all Hispanic subgroups, at least 1 in 5 report an arthritis-attributable effect.
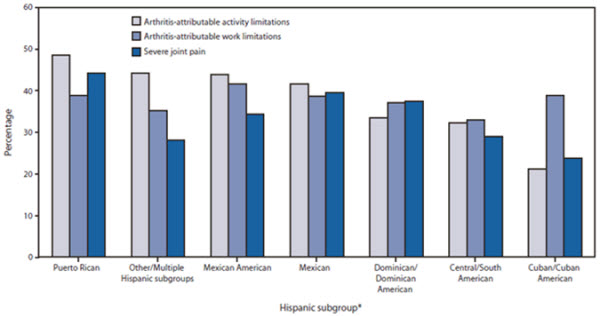
* Subgroups are presented in decreasing order of arthritis-attributable activity limitation .
From: Murphy LB, Bolen J, Schieb L, Hootman, JM, Langmaid GA, Cheng YJ, et al. Prevalence of Doctor-Diagnosed Arthritis and Arthritis-Attributable Effects Among Hispanic Adults, by Hispanic Subgroup — United States, 2002, 2003, 2006, and 2009. MMWR 2011;60(6):167-171. html pdf [1.1MB]
most prevalent among Puerto Ricans and least prevalent among Cuban/Cuban-Americans
Mexican |
42% |
|---|---|
Mexican American |
44% |
Central/South American |
32% |
Puerto Rican
|
49% |
Other/Multiple Hispanic subgroups
|
44% |
Cuban/Cuban American
|
21% |
Dominican/Dominican American
|
22% |
Age-adjusted prevalence of arthritis-attributable activity limitations across Hispanic subgroups
Source: National Health Interview Survey 2002, 2003, 2006 and 2008
prevalent among Mexican Americans and least prevalent among Central/South Americans
Mexican |
39% |
|---|---|
Mexican American |
42% |
Central/South American |
33% |
Puerto Rican
|
39% |
Other/Multiple Hispanic subgroups
|
35% |
Cuban/Cuban American
|
39% |
Dominican/Dominican American
|
37% |
Age-adjusted prevalence of arthritis-attributable activity limitations across Hispanic subgroups
Source: National Health Interview Survey 2002, 2003, 2006 and 2008
Reference
Bolen J, Schieb L, Hootman JM, Helmick CG, Theis K, Murphy LB, et al. Differences in the prevalence and impact of arthritis among racial/ethnic groups in the United States, National Health Interview Survey, 2002, 2003, and 2006. Prev Chronic Dis 2010;7(3):1–5. html pdf [320k]
Get email updates
To receive email updates about this page, enter your email address:

Contact Us:
- Arthritis Program
Mailstop K-51
4770 Buford Hwy NE
Atlanta, GA 30341-3724
- Phone: 770.488.5464
Fax: 770.488.5964 - cdcinfo@cdc.gov
