Maps
Visualizations of spatially–referenced energy data can provide insight into regional, industrial, and economic factors that influence energy consumption and generation across the United States. Federal agencies collect information on energy production, use, natural resources, and energy infrastructure and this data can be visualized in maps and other charts to show how energy is generated and consumed across the country and world. Maps of natural resources can also help energy project developers optimize the location of their project in order to reduce environmental risks.
The maps and visualizations on this tab are a small sample of the types of informative visualizations that can be created using data from the federal government and elsewhere. When you click on the titles below, you will be leaving the Data.gov website.
|
Resources |
Last Updated On |
|---|---|
| Biomass FacilitiesMap of Biomass Facilities. | 10/31/2011 |
| Clean Energy CompaniesMap of International Clean Energy Companies – you can add your own company if it is not already there! | 10/31/2011 |
| Coal Origin MapMap of U.S. state-level coal production with detailed statistics available. | 10/31/2011 |
| Country Energy Profiles MapInteractive map and energy data for 217 countries. | 10/31/2011 |
| Daily Real-Time, Day-Ahead, and Forecasted Prices and LoadsA daily graphical review of four U.S. regions’ electricity prices using Regional Transmission Organization (RTO) information. | 10/31/2011 |
| Electricity PricesMap of Electricity Prices in the U.S. | 10/31/2011 |
| Electricity Restructuring by StateMap showing the status of electricity deregulation and the implementation of retail electricity choice in the U.S. | 10/31/2011 |
| Energy Consumption per Capita by StateVisualization of per capita energy consumption across all sectors of the economy for each state. | 10/31/2011 |
| Energy Open Linked Data VisualizationsEnergy use and generation visualizations produced by RPI’s Open Government Data Initiative. | 10/31/2011 |
| Geothermal CompaniesMap of Geothermal Companies in the U.S. | 10/31/2011 |
| Incentives and PoliciesMap of Energy Efficiency and Renewable Energy Incentives and Policies. | 10/31/2011 |
| International InitiativesInternational country-specific information on clean energy programs, tools and organizations. | 10/31/2011 |
| Lower 48 Shale Gas PlaysMap showing existing shale gas resources and basins in 2011 in the Continental U.S. | 10/31/2011 |
| Map of Community Wind PotentialSuite of state level maps describing wind energy generation potential for EPA tracked sites. | 10/31/2011 |
| Map of Landfill Gas ProjectsMaps of current and potential landfill gas energy projects in the U.S. | 10/31/2011 |
| Marine Cadastre Sample MapsOcean energy resource maps created using the Multipurpose Marine Cadastre. | 10/31/2011 |
| Natural Gas PipelinesSuite of maps describing the production and delivery of natural gas throughout the U.S. | 10/31/2011 |
| Natural Gas Production in Conventional Fields, Lower 48Major natural gas production in conventional fields in the continental US reported by amount of gas produced. | 10/31/2011 |
| Recovery Act Field ProjectsMap of energy-related projects funded by the Recovery Act. | 10/31/2011 |
|
Recovery Act: Federal Buildings Fund Investments Map showing where American Recovery and Reinvestment Act funds are used to convert federal buildings to high-performance green buildings and build new, energy-efficient federal buildings, courthouses, and land ports of entry. |
05/29/2012 |
| Renewable Energy Production by StateMap showing the proportion of renewable electricity generation by state. | 10/31/2011 |
| Solar Energy CompaniesMap of Solar Energy Companies. | 10/31/2011 |
| Solar Power PlantsMap of Solar Power Plants. | 10/31/2011 |
| Standby PowerVisualization of standby power usage for most common appliances. | 10/31/2011 |
| Total Energy FlowsVisualization of the sources of U.S. energy generation and uses of energy in 2010. | 10/31/2011 |
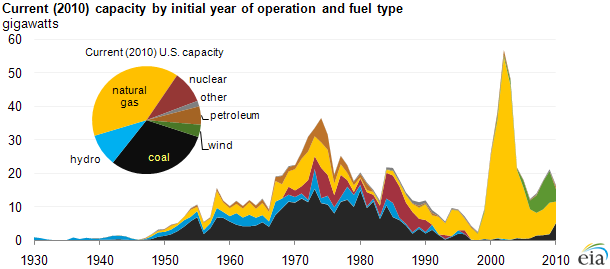
| U.S. Electricity Generation Mix and Vintage (2010)Graph showing when current power plants of different types were built. | 10/31/2011 |
| U.S. Geothermal potential at RE-Power SitesNear surface temperatures for geothermal heat pump potential at EPA tracked sites. | 10/31/2011 |
| U.S. Solar Resource MapsAverage solar resource available to photovoltaic and concentrating solar technologies across the US at a 10 km scale. | 10/31/2011 |
| U.S. Wind ResourcesU.S. wind power class map for estimating potential wind power generation. | 10/31/2011 |
| Utility-Scale Energy Technology Capacity FactorsGraph showing the range of recent capacity factor estimates for utility-scale renewable energy technologies. | 10/31/2011 |
| Utility-Scale Energy Technology Capital CostsCompilation of data sources to illustrate 2006 capital cost estimates for utility-scale renewable energy technologies. | 10/31/2011 |
| Utility-Scale Energy Technology Operations and Maintenance CostsIllustration of operations and maintenance (O&M) cost estimates for utility-scale renewable energy technologies. | 10/31/2011 |
| What Drives Crude Oil Prices?Graphic exploring the relation of oil price and oil consumption. | 10/31/2011 |
| Where Does my Money Go?Average categorical breakdown of annual US residential energy costs. | 10/31/2011 |
| Wind FarmsMap of Wind Farms. | 10/31/2011 |
