FluWorkLoss Special Edition
November 30, 2009, 12:00 PM ET
FluWorkLoss Special Edition is an adaptation from the previously published FluWorkLoss 1.0 software that is available through the CDC website at www.cdc.gov/flu/tools/FluWorkLoss. This newly adapted FluWorkLoss Special Edition is a spreadsheet-based software program that estimates the potential number of days lost from work due to an influenza pandemic, specifically H1N1 Influenza A. FluWorkLoss Special Edition provides a range of estimates of total workdays lost, as well as graphic illustrations of the workdays lost by week (and by day) and the percentage of total workdays lost to influenza-related illnesses on a weekly and daily basis.
Download FluWorkLoss Special Edition Now
Who should use FluWorkLoss Special Edition?
This special edition of the FluWorkLoss estimates the potential number of days lost from work due to an influenza pandemic and can be used by any community, small business, or organization that wishes to understand their workplace's capacity to function during an H1N1 Influenza response. Users may change almost any input value, such as the number of workdays assumed lost when a worker becomes ill or the number of workdays lost due to a worker staying home to care for a family member. Users can also change the length and virulence of the pandemic so that a range of possible impacts can be estimated.
Using FluWorkLoss Special Edition
The user must first define the business population they wish to estimate the potential impact of 2009 H1N1. FluWorkLoss Special Edition requires the user to enter their employee and dependent population into three distinct age groups. These groups are 0-17 years, 19-64 years, and 65+ years with the majority of employees belonging in the 19-64 age group population, while dependents will comprise the other two age group populations. Dependents are defined as people that rely on the employees for care in the event they become ill with H1N1 Influenza. Dependents also will have constant and frequent daily interaction with the employees, thus impacting the number of days the employee will have to take in order to care for their sick family members.
Along with the number of workdays an employee must take off to care for a sick family member (dependent), the user must also enter the number of workdays lost an employee will need to take in order to care for themselves if they become ill with H1N1. The user must also provide specific employment information, such as the community employment rate, the community cohabitat rate, the number of workdays in a week defined by the employer, and the number of days the employees' place of business is in operation; along with the starting week in which H1N1 occurrence is expected to begin. The users have the opportunity to select the length of time H1N1 is expected to last in the community (4, 6, 8, or 12 weeks), as well as the strength of the attack rate in the community. The attack rates are defined as 15% (similar to the Spring 2009 H1N1 Outbreak, 25% (most likely scenario of what could happen in subsequent H1N1 outbreaks, and 35% (a more severe form of the Spring 2009 H1N1 outbreak). The default number of weeks the 2009 H1N1 is expected to last is 12 weeks, while the default attack rate is 25%.
Sources of Default Values
The number of persons, by age group, becoming ill, requiring either a visit to a physician or hospitalization or die due to H1N1 are calculated using the same methodology as that used in FluAid Special Edition (available at: http://www.cdc.gov/flu/pandemic/preparednesstools.htm).
What types of output are produced?
The FluWorkLoss Special Edition program utilizes all of the input variables to produce several outcomes, such as the total number of workdays lost throughout the duration of the H1N1 outbreak and at the different attack rates.
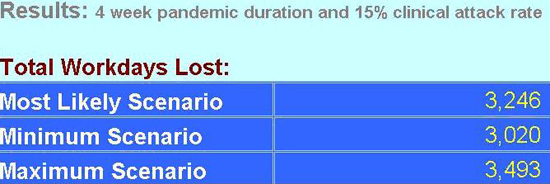
The Minimum Scenario represents the minimum number of workdays lost at the given attack rate, while the Most Likely and Maximum Scenario represents the median and maximum number of workdays lost at the given attack rate. As the user, if you would like to alter any of the scenario information presented above, you have the option to enter your own estimates for the number of deaths, hospitalizations, and outpatient visits for each of the attack rates by selecting the button labeled "Use Your Own Estimates".
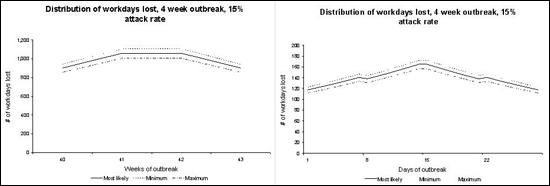
FluWorkLoss Special Edition also produces a graphical representation for the distribution of workdays lost due to H1N1 based upon the weekly and daily distribution of cases observed throughout the length of the 2009 H1N1 occurrence.
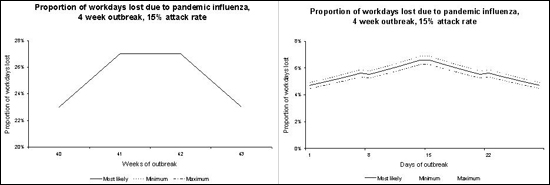
Both graphs displaying the proportion (percentage) of workdays lost during a 4 week pandemic with a 15% attack rate for the three different scenarios (Most Likely, Minimum, and Maximum). The difference is one graphs displays the proportion of workdays lost in weeks beginning with the pandemic start week (FluWorkLoss Results 3) and the other displays the proportion of workdays lost in days beginning with the first day of the pandemic start week (Flu WorkLoss Results 4).
The proportion of workdays lost may also be compared to the Percentage of Visits for Influenza-Like-Illness (ILI) reported nationally and by HHS Regions.
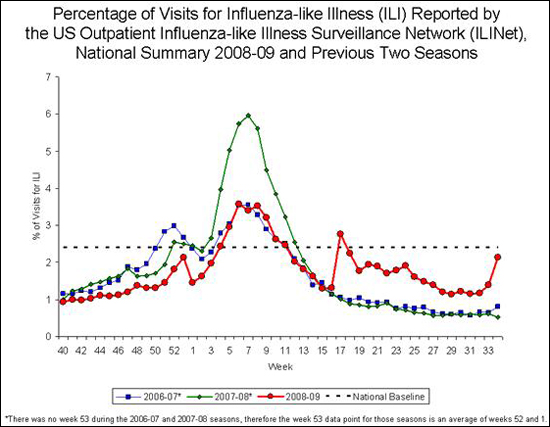
The Regional Graphs may be uploaded by selecting the Region that you would like to view, so that you could compare the National ILI and the 2009 H1N1 proportionate graphs to the regional ILI proportionate graphs. This comparison will allow you, as the user, to see how the FluWorkLoss generated graphs will align or differ from the National and Regional Percentage of ILI Visits.
Help features
Throughout FluWorkLoss Special Edition, you will find buttons labeled "Explain This Page" and "HELP". These buttons should be selected if you would like a detailed description about information that is presented on the particular page. You will also find some text boxes that will direct you as the user to the specific buttons that contains the description of information, as well as other hints that may be helpful to you in understanding how to enter the information and what information should be entered at specific steps throughout the FluWorkLoss Special Edition software program.
System Requirements
- Windows* operating system (MS Windows 2000 or newer)
- Microsoft Excel (MS Office 2000 or newer)
- 486 Pentium processor and at least 1GB RAM
- 15 MB of hard drive storage space
We have successfully loaded and run FluWorkLoss Special Edition on a variety of desktop and laptop computers using the Windows operating system, it is not designed to run on Apple* or machines that use other operating systems such as Linux*.
*MS Windows and Office is a copyrighted product produced by Microsoft Corporation, WA. Use of trade names and commercial sources is for identification only and does not imply endorsement by the U.S. Department of Health and Human Services.
Instructions for Downloading
Before loading and starting FluAid Special Edition, you must change Excel's security level.
You must first do the following steps:
- Open a blank Excel spreadsheet.
- Click Tools and then click Macro, choose Security
- Set Security Level to Medium.
- Click OK.
- Double click and open FluAid Special Edition file.
- When asked to Disable Macros or Enable Macros, click Enable Macros.
Downloading the Files
*We recommend downloading and saving the FluAid Special Edition spreadsheet to your computer, then open the spreadsheet from your computer. This will allow the spreadsheet to open in Excel instead of your web browser.
Download FluWorkLoss Special Edition Download Instructions
Download FluWorkLoss Special Edition software
Disclaimer
Please keep in mind that this is a beta test version of the software. The numbers generated through use of FluWorkLoss should not be considered predictions of what will actually occur during a pandemic. Rather, they should be treated as estimates of what could happen.
References
-
Flu Activity & Surveillance available at: www.cdc.gov/flu/weekly/fluactivity
Get email updates
To receive weekly email updates about this site, enter your email address:
Contact Us:
- Centers for Disease Control and Prevention
1600 Clifton Rd
Atlanta, GA 30333 - 800-CDC-INFO
(800-232-4636)
TTY: (888) 232-6348
24 Hours/Every Day - cdcinfo@cdc.gov
