Slide Presentation from the AHRQ 2009 Annual Conference
On September 15, 2009,Shannon Brownlee, MS made this presentation at the 2009 Annual Conference. Select to access the PowerPoint® presentation (1.5 MB) (Plugin Software Help).
Slide 1

Too Much Prevention: What Not to Do in the Primary Care Setting
Agency for Healthcare Research and Quality
Bethesda, MD September 15, 2009
Shannon Brownlee, MS
Senior Research Fellow, New America Foundation
Author: Overtreated : Why Too Much Medicine Is Making Us Sicker and Poorer
brownlee@newamerica.net
Slide 2

DISCLAIMER
No financial conflicts of interest to declare
Slide 3

Graph: Spending on Health Care as a Percentage of Gross Domestic Product Under an Assumption That Excess Cost Growth Continues at Historical Averages.
By 2052 healthcare accounts for 50 percent of the economy
Source: CBO
Slide 4

Graph: Sources of Growth in Projected Federal Spending on Medicare and Medicaid
Source: CBO
Slide 5

Busting state budgets
Cartoon of large fish labeled "Medicaid" eating smaller fish labeled "education," "roads."
Slide 6

The Solution?
70% of Americans consider PREVENTION the most important aspect of health care reform (other than covering everybody)
Slide 7
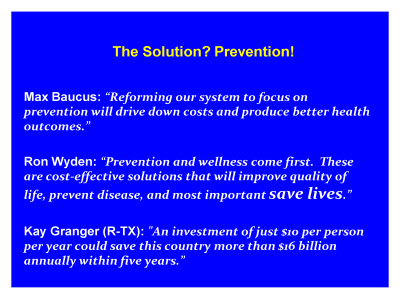
The Solution? Prevention!
Max Baucus: "Reforming our system to focus on prevention will drive down costs and produce better health outcomes."
Ron Wyden: "Prevention and wellness come first. These are cost-effective solutions that will improve quality of life, prevent disease, and most important save lives ."
Kay Granger (R-TX): "An investment of just $10 per person per year could save this country more than $16 billion annually within five years."
Slide 8
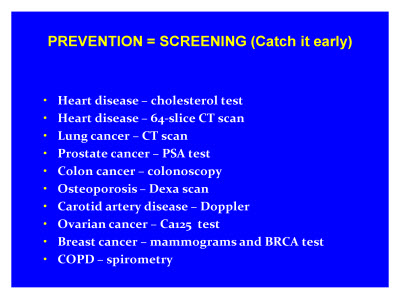
PREVENTION = SCREENING (Catch it early)
- Heart disease - cholesterol test
- Heart disease - 64-slice CT scan
- Lung cancer - CT scan
- Prostate cancer - PSA test
- Colon cancer - colonoscopy
- Osteoporosis - Dexa scan
- Carotid artery disease - Doppler
- Ovarian cancer - Ca125 test
- Breast cancer - mammograms and BRCA test
- COPD - spirometry
Slide 9

Prevention = Surgery (head it off at the pass)
- Silent gall stones
- Chronic stable angina
- Carotid artery stenosis
- Herniated disc
- Early prostate cancer
- Enlarged prostate (BPH)
Slide 10
Dr. Michael LeFevre
- USPSTF
- Evidence for screening tests
- Pressures on Physicians
Slide 11
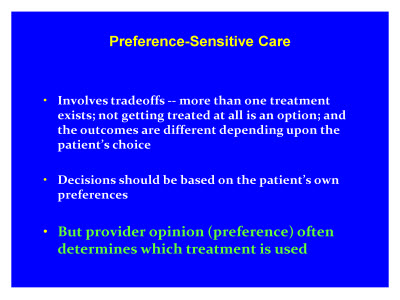
Preference-Sensitive Care
- Involves tradeoffs -- more than one treatment exists; not getting treated at all is an option; and the outcomes are different depending upon the patient's choice
- Decisions should be based on the patient's own preferences
- But provider opinion (preference) often determines which treatment is used
Slide 12

TURP for BPH per 1,000 male Medicare enrollees (2005)
|
| HRR |
Ratio to lowest |
| Providence, RI |
2.67 |
| Lubbock, TX |
2.63 |
| Bismarck, ND |
2.46 |
| Washington, DC |
2.07 |
| Burlington, VT |
2.05 |
| Hartford, CT |
1.92 |
| St. Paul, MN |
1.89 |
| Worcester, MA |
1.89 |
| Baltimore, MD |
1.85 |
| Minneapolis, MN |
1.79 |
| White Plains, NY |
1.74 |
| Bangor, ME |
1.74 |
| Manhattan, NY |
1.74 |
| Portland, ME |
1.57 |
| Seattle, WA |
1.48 |
| Salt Lake City, UT |
1.44 |
| Casper, WY |
1.43 |
| Wilmington, DE |
1.36 |
| Richmond, VA |
1.17 |
| Baton Rouge, LA |
1.03 |
| Lebanon, NH |
1.00 |
Slide 13

CABG surgery per 1,000 Medicare enrollees (2005)
|
|
| HRR |
Ratio to lowest |
| Lubbock, TX |
2.59 |
| Baton Rouge, LA |
2.34 |
| Baltimore, MD |
1.88 |
| |
|
| Providence, RI |
1.16 |
| Worcester, MA |
1.15 |
| Seattle, WA |
1.14 |
Slide 14

Percutaneous coronary intervention per 1,000 Medicare enrollees (2005)
|
|
| HRR |
Ratio to lowest |
| Lubbock, TX |
2.59 |
| Worcester, MA |
1.86 |
| Baltimore, MD |
1.77 |
| |
|
| Providence, RI |
1.21 |
| Seattle, WA |
1.09 |
| Baton Rouge, LA |
1.05 |
Slide 15

Back surgery per 1,000 Medicare enrollees (2005)
|
|
| HRR |
Ratio to lowest |
| Casper, WY |
5.41 |
| Lubbock, TX |
3.23 |
| Bismarck, ND |
3.17 |
| Salt Lake City, UT |
2.91 |
| Baltimore, MD |
2.81 |
| St. Paul, MN |
2.79 |
| Minneapolis, MN |
2.57 |
| Seattle, WA |
2.54 |
| Washington, DC |
2.41 |
| Richmond, VA |
2.25 |
| Portland, ME |
1.97 |
| Wilmington, DE |
1.85 |
| Hartford, CT |
1.63 |
| Worcester, MA |
1.63 |
| Bangor, ME |
1.48 |
| Baton Rouge, LA |
1.45 |
| White Plains, NY |
1.37 |
| Providence, RI |
1.36 |
| Burlington, VT |
1.24 |
| Lebanon, NH |
1.17 |
| Manhattan, NY |
1.00 |
Slide 16
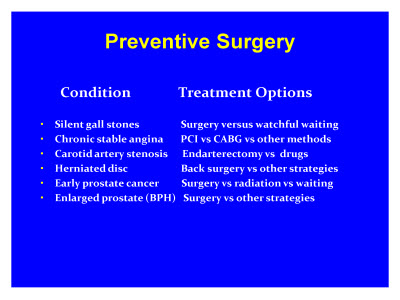
Preventive Surgery
|
|
| Condition |
Treatment Options |
| Silent gall stones |
Surgery versus watchful waiting |
| Chronic stable angina |
PCI vs CABG vs other methods |
| Carotid artery stenosis |
Endarterectomy vs drugs |
| Herniated disc |
Back surgery vs other strategies |
| Early prostate cancer |
Surgery vs radiation vs waiting |
| Enlarged prostate (BPH) |
Surgery vs other strategies |
Slide 17

Image of Journal Article: Decision aids for patients facing health treatment or screening decisions: systematic review
Slide 18

Which rate is right? Impact of improved decision quality on surgery rates: BPH
Knowledge of relevant treatment options and outcomes
Concordance between patient values and care received
Source: John E. Wennberg
Slide 19

Bottom Line Implications:
1. Clinical appropriateness should be based on sound evaluation of treatment options (comparative effectiveness and outcomes research)
2. Medical necessity should be based on Informed Patient Choice among clinically appropriate options -- high quality shared decision-making
Slide 20

Proportion of Medicare Spending Attributed to Each Category of Unwarranted Variation
Pie Chart
Preference Sensitive Care - 25%
Effective Care - 12%
Supply Sensitive Care - 63%
Source: John E. Wennberg and Dartmouth Atlas
Slide 21

THE HEALTH CARE TRAIN WRECK
We're wasting $600 - 800 BILLION annually on unnecessary care
Part of the solution requires rethinking prevention and clinical decision making
Current as of December 2009
Current as of December 2009
Internet Citation:
Too Much Prevention: What Not to Do in the Primary Care Setting. Slide Presentation from the AHRQ 2009 Annual Conference (Text Version). December 2009.
Agency for Healthcare Research and Quality, Rockville, MD. http://www.ahrq.gov/about/annualconf09/brownlee.htm


 540 Gaither Road Rockville, MD 20950