
2007 Economic Census
You are here: Census.gov › Business & Industry › 2007 Economic Census › Using American FactFinder › How do I add/remove data?
Using American FactFinder
How do I add/remove data?
When you view a table in AFF, one of following situations may occur:
- You are not seeing information that you need.
- You are seeing too much information.
Not seeing what you want? Expand the table.
Example: You are a marketing consultant and have a client that wants to identify new markets for growth by expanding their beer distribution by selling craft microbrews from small breweries at a premium price.
You are helping the client analyze the brewery market in all 50 states. They want to know where it is most common to find breweries with less than 5 employees.
You found the table EC0731SA11: Manufacturing: Subject Series: Location of Manufacturing Plants: Employment Size for Subsectors and Industries by U.S., State, County and Place: 2007 (view table); however, all you see is data for the United States. You know you should be able to see state data because the table title clearly says states are included.
To add state data to the table, follow these steps:
Step 1: Back to Search
Go back to search by clicking the Back to Search button located on the top left of the Table View page. This returns you to the Search results.
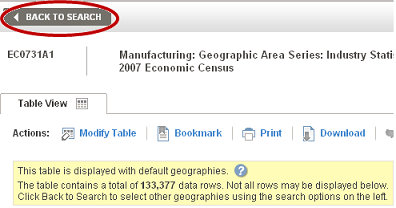
Helpful Hint
When a table has one or more default selections, the yellow box appears stating how many rows exist on this table. This shows you that more data rows can be added to the table.
For more tips, see the Using AFF Help Guide [pdf].
Step 2: Add to Your Selections
Use the Geography Menu to add All States within the United States to Your Selections. After adding the new geography, you will have to reselect the table to view. Once the table reloads, the table will appear with the additional geographies.
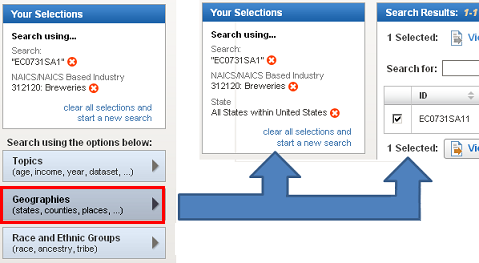
Helpful Hint
For more information on how to add industries and geographies, see How Do I Get Started? or see the Using AFF Help Guide [pdf].
Theres too much data, how do I make this more manageable?
In the previous section, you were helping a client analyze the brewery market in all 50 states, focusing on breweries that employ less than 5 people. After initally viewing EC0731SA11: Manufacturing: Subject Series: Location of Manufacturing Plants: Employment Size for Subsectors and Industries by U.S., State, County and Place: 2007 , with US level data, you returned to search to add All States within the United States to see data for each state.
Now that your table is broken out by state, you need some way to limit the 539 data rows to only the rows with data on establishments with 0 - 4 employees.
To narrow down the rows, follow these steps:
Step 1: Activate Table Tools
Click on the Modify Table button directly above the table. This activates Tables Tools, such as fitering and sorting rows.

Step 2: Filter Rows
- Select the Filter button
 on the Meaning of Employment size of establishment’s code column.
 - In the Filter Dimension overlay, select Establishments with 0 - 4 employees.
- Click OK.

Helpful Hint
For more tips on modifying tables, see the Using AFF Help Guide [pdf].
The table is now limited to states that have breweries with zero to 4 employees.
California has the most of these small brewery establishments, followed by Montana. Your client has decided to focus their efforts in developing business contacts in these two states.

 Facebook
 Twitter
 Flickr
 YouTube