News Release Information
12-1884-ATL
Friday, September 14, 2012
Contacts
Technical information:
Media contact:
Consumer Price Index, South Region – August 2012
Prices in the South up 0.6 percent over the month and 1.6 percent over the year
The Consumer Price Index for All Urban Consumers (CPI-U) for the South rose 0.6 percent in August, the U.S. Bureau of Labor Statistics reported today. Regional Commissioner Janet S. Rankin noted that energy prices increased 4.9 percent over the month. Food prices edged up 0.2 percent and the all items less food and energy index was unchanged since July. Within the all items less food and energy group, small price increases for components including shelter and education and communication were offset by declines in prices for others such as medical care and recreation. (Data in this report are not seasonally adjusted. Accordingly, month-to-month changes may reflect the impact of seasonal influences.)
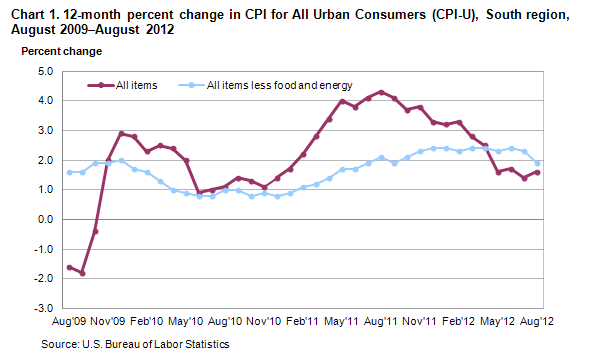
Over the last 12 months, the CPI-U advanced 1.6 percent. The index for all items less food and energy rose 1.9 percent over the year. (See chart 1.)
Food
Food prices increased 0.2 percent in August as prices for both food at home and food away from home edged up (0.2 percent each).
Since August 2011, the index for food advanced 2.1 percent. Prices for food away from home and food at home increased 2.7 and 1.7 percent, respectively.
Energy
The energy index increased 4.9 percent in August, dominated by an 8.3-percent rise in motor fuel prices. Utility (piped) gas service prices rose 4.2 percent, while prices for electricity inched down 0.1 percent over the month.
Over the year, energy prices decreased 1.6 percent, primarily reflecting declines in electricity and utility (piped) gas service, down 1.8 and 11.6 percent, respectively. Motor fuel prices edged down 0.2 percent over the year.
All items less food and energy
The index for all items less food and energy was unchanged in August, as small increases for a few components including shelter (0.1 percent) and education and communication (0.3 percent) were offset by price decreases led by medical care (-0.4 percent).
Over the year, the index for all items less food and energy advanced 1.9 percent, led by price increases for shelter (2.2 percent) and medical care (4.0 percent).
| Month |
2007 | 2008 | 2009 | 2010 | 2011 | 2012 | ||||||
|---|---|---|---|---|---|---|---|---|---|---|---|---|
| 1-month | 12-month | 1-month | 12-month | 1-month | 12-month | 1-month | 12-month | 1-month | 12-month | 1-month | 12-month | |
January |
0.1 | 1.8 | 0.5 | 4.9 | 0.4 | -0.1 | 0.3 | 2.8 | 0.5 | 1.7 | 0.5 | 3.2 |
February |
0.5 | 2.2 | 0.3 | 4.6 | 0.5 | 0.1 | 0.0 | 2.3 | 0.5 | 2.2 | 0.6 | 3.3 |
March |
1.0 | 2.6 | 0.8 | 4.4 | 0.3 | -0.3 | 0.6 | 2.5 | 1.2 | 2.8 | 0.7 | 2.8 |
April |
0.9 | 2.5 | 0.7 | 4.2 | 0.3 | -0.7 | 0.1 | 2.4 | 0.7 | 3.4 | 0.4 | 2.5 |
May |
0.6 | 2.7 | 0.9 | 4.6 | 0.3 | -1.3 | 0.0 | 2.0 | 0.5 | 4.0 | -0.4 | 1.6 |
June |
0.4 | 2.7 | 1.1 | 5.3 | 1.0 | -1.4 | -0.1 | 0.9 | -0.2 | 3.8 | -0.2 | 1.7 |
July |
-0.1 | 2.3 | 0.5 | 5.8 | -0.3 | -2.1 | -0.1 | 1.0 | 0.2 | 4.1 | -0.2 | 1.4 |
August |
-0.3 | 2.0 | -0.4 | 5.6 | 0.1 | -1.6 | 0.2 | 1.1 | 0.4 | 4.3 | 0.6 | 1.6 |
September |
0.3 | 3.0 | 0.1 | 5.4 | 0.0 | -1.8 | 0.2 | 1.4 | 0.0 | 4.1 | - | - |
October |
0.2 | 3.8 | -1.2 | 3.9 | 0.2 | -0.4 | 0.1 | 1.3 | -0.2 | 3.7 | - | - |
November |
0.6 | 4.7 | -2.2 | 1.0 | 0.2 | 2.0 | 0.0 | 1.1 | 0.0 | 3.8 | - | - |
December |
0.0 | 4.4 | -1.0 | 0.0 | -0.1 | 2.9 | 0.2 | 1.4 | -0.2 | 3.3 | - | - |
____________
The September 2012 Consumer Price Index for the South region is scheduled to be released on Tuesday, October 16, 2012 at 8:30 a.m. (ET).
Technical Note
The Consumer Price Index (CPI) is a measure of the average change in prices over time of goods and services purchased by households. The Bureau of Labor Statistics publishes CPIs for two population groups: (1) the CPI for Urban Wage Earners and Clerical Workers (CPI-W), which covers 29 percent of the total population and (2) the CPI for All Urban Consumers (CPI-U) and the Chained CPI for All Urban Consumers (C-CPI-U), which cover approximately 88 percent of the total population and include, in addition to wage earners and clerical worker households, groups such as professional, managerial, and technical workers, the self-employed, short-term workers, the unemployed, and retirees and others not in the labor force.
The CPIs are based on prices of food, clothing, shelter, and fuels, transportation fares, charges for doctors’ and dentists’ services, drugs, and the other goods and services that people buy for day-to-day living. Prices are collected each month in 87 urban areas across the country from about 4,000 housing units and approximately 26,000 retail establishments—department stores, supermarkets, hospitals, filling stations, and other types of stores and service establishments. All taxes directly associated with the purchase and use of items are included in the index.
In calculating the index, price changes for the various items in each location are averaged together with weights, which represent their importance in the spending of the appropriate population group. Local data are then combined to obtain a U.S. city average. For the CPI-U and CPI-W separate indexes are also published by size of city, by region of the country, for cross-classifications of regions and population-size classed, and for 27 local areas. Area indexes do not measure differences in the level of prices among cities; they only measure the average change in prices for each area since the base period. For the C-CPI-U, data are issued only at the national level. It is important to note that the CPI-U and CPI-W are considered final when released, but the C-CPI-U is issued in preliminary form and subject to two annual revisions.
The index measures price changes from a designated reference date. For the CPI-U and the CPI-W the reference base is 1982-84 equals 100. The reference base for the C-CPI-U is December 1999 equals 100. An increase of 16.5 percent from the reference base, for example, is shown as 116.500. This change can also be expressed in dollars as follows: the price of a base period market basket of goods and services in the CPI has risen from $10 in 1982-84 to $11.65.
The South region is comprised of Alabama, Arkansas, Delaware, District of Columbia, Florida, Georgia, Kentucky, Louisiana, Maryland, Mississippi, North Carolina, Oklahoma, South Carolina, Tennessee, Texas, Virginia, and West Virginia.
For further details visit the CPI home page on the Internet at www.bls.gov/cpi or contact our CPI Information and Analysis Section at (202) 691-7000.
Information in this release will be made available to sensory impaired individuals upon request. Voice phone: (202) 691-5200; TDD message referral phone number: (800) 877-8339.
| Item and Group |
Indexes |
Percent change from- | ||||
|---|---|---|---|---|---|---|
| Jun. 2012 |
Jul. 2012 |
Aug. 2012 |
Aug. 2011 |
Jun. 2012 |
Jul. 2012 |
|
Expenditure category |
||||||
All Items |
223.004 | 222.667 | 223.919 | 1.6 | 0.4 | 0.6 |
All items (December 1977=100) |
361.744 | 361.197 | 363.228 | |||
Food and beverages |
231.951 | 231.977 | 232.303 | 2.0 | 0.2 | 0.1 |
Food |
232.986 | 233.034 | 233.486 | 2.1 | 0.2 | 0.2 |
Food at home |
229.811 | 229.606 | 230.036 | 1.7 | 0.1 | 0.2 |
Food away from home |
240.314 | 240.756 | 241.247 | 2.7 | 0.4 | 0.2 |
Alcoholic beverages |
216.868 | 216.560 | 215.009 | 1.0 | -0.9 | -0.7 |
Housing |
207.997 | 208.087 | 208.260 | 1.5 | 0.1 | 0.1 |
Shelter |
230.470 | 231.018 | 231.197 | 2.2 | 0.3 | 0.1 |
Rent of primary residence (1) |
231.863 | 232.700 | 232.796 | 2.2 | 0.4 | 0.0 |
| 233.718 | 234.211 | 234.868 | 2.1 | 0.5 | 0.3 | |
| 233.703 | 234.195 | 234.854 | 2.1 | 0.5 | 0.3 | |
Fuels and utilities |
225.946 | 223.698 | 224.660 | -1.2 | -0.6 | 0.4 |
Household energy |
190.640 | 187.787 | 188.566 | -3.1 | -1.1 | 0.4 |
Energy services (1) |
190.530 | 187.611 | 188.379 | -3.2 | -1.1 | 0.4 |
Electricity (1) |
191.785 | 188.364 | 188.164 | -1.8 | -1.9 | -0.1 |
Utility (piped) gas service (1) |
166.529 | 167.119 | 174.145 | -11.6 | 4.6 | 4.2 |
Household furnishings and operations |
126.525 | 126.687 | 126.228 | 0.5 | -0.2 | -0.4 |
Apparel |
134.757 | 130.628 | 130.673 | -0.7 | -3.0 | 0.0 |
Transportation |
213.034 | 212.387 | 218.593 | 0.9 | 2.6 | 2.9 |
Private transportation |
211.190 | 210.708 | 217.218 | 1.1 | 2.9 | 3.1 |
New and used motor vehicles (3) |
102.441 | 102.371 | 102.167 | 0.3 | -0.3 | -0.2 |
New vehicles |
149.780 | 149.165 | 148.974 | 1.1 | -0.5 | -0.1 |
| 101.889 | 101.467 | 101.355 | 1.1 | -0.5 | -0.1 | |
New cars (4) |
153.525 | 152.850 | 152.604 | 0.2 | -0.6 | -0.2 |
Used cars and trucks |
153.513 | 154.020 | 153.174 | -0.1 | -0.2 | -0.5 |
Motor fuel |
290.491 | 288.059 | 311.984 | -0.2 | 7.4 | 8.3 |
Gasoline (all types) |
289.064 | 286.683 | 310.801 | -0.3 | 7.5 | 8.4 |
Unleaded regular (4) |
287.841 | 285.586 | 309.802 | -0.4 | 7.6 | 8.5 |
| 301.525 | 298.567 | 323.485 | -0.3 | 7.3 | 8.3 | |
Unleaded premium (4) |
286.322 | 283.928 | 307.045 | 0.4 | 7.2 | 8.1 |
Medical care |
397.266 | 397.983 | 396.445 | 4.0 | -0.2 | -0.4 |
Medical care commodities |
314.938 | 316.520 | 315.740 | 3.3 | 0.3 | -0.2 |
Medical care services |
425.349 | 425.666 | 423.823 | 4.2 | -0.4 | -0.4 |
Professional services |
343.929 | 343.948 | 345.137 | 2.6 | 0.4 | 0.3 |
Recreation (3) |
115.108 | 114.859 | 114.747 | 0.9 | -0.3 | -0.1 |
Education and communication (3) |
130.225 | 130.080 | 130.494 | 1.8 | 0.2 | 0.3 |
Other goods and services |
385.413 | 385.498 | 385.888 | 2.1 | 0.1 | 0.1 |
Commodity and service group |
||||||
All Items |
223.004 | 222.667 | 223.919 | 1.6 | 0.4 | 0.6 |
Commodities |
187.647 | 186.881 | 189.172 | 0.9 | 0.8 | 1.2 |
Commodities less food and beverages |
164.918 | 163.844 | 166.892 | 0.2 | 1.2 | 1.9 |
Nondurables less food and beverages |
216.525 | 214.331 | 221.052 | 0.5 | 2.1 | 3.1 |
Nondurables less food, beverages, and apparel |
266.640 | 265.471 | 276.044 | 0.8 | 3.5 | 4.0 |
Durables |
116.641 | 116.638 | 116.168 | -0.4 | -0.4 | -0.4 |
Services |
259.297 | 259.363 | 259.643 | 2.1 | 0.1 | 0.1 |
Rent of shelter (2) |
236.795 | 237.356 | 237.539 | 2.1 | 0.3 | 0.1 |
Transportation services |
285.464 | 285.620 | 286.428 | 2.2 | 0.3 | 0.3 |
Other services |
311.814 | 311.721 | 312.393 | 2.3 | 0.2 | 0.2 |
Special aggregate indexes |
||||||
All items less medical care |
213.180 | 212.801 | 214.159 | 1.4 | 0.5 | 0.6 |
All items less food |
221.242 | 220.845 | 222.221 | 1.5 | 0.4 | 0.6 |
All items less shelter |
221.527 | 220.816 | 222.527 | 1.3 | 0.5 | 0.8 |
Commodities less food |
166.682 | 165.624 | 168.563 | 0.2 | 1.1 | 1.8 |
Nondurables |
224.437 | 223.255 | 227.061 | 1.2 | 1.2 | 1.7 |
Nondurables less food |
216.356 | 214.258 | 220.558 | 0.6 | 1.9 | 2.9 |
Nondurables less food and apparel |
261.156 | 260.061 | 269.638 | 0.9 | 3.2 | 3.7 |
Services less rent of shelter (2) |
295.752 | 295.188 | 295.602 | 2.0 | -0.1 | 0.1 |
Services less medical care services |
244.309 | 244.358 | 244.760 | 1.9 | 0.2 | 0.2 |
Energy |
232.149 | 229.546 | 240.837 | -1.6 | 3.7 | 4.9 |
All items less energy |
222.610 | 222.541 | 222.605 | 1.9 | 0.0 | 0.0 |
All items less food and energy |
221.168 | 221.077 | 221.072 | 1.9 | 0.0 | 0.0 |
Commodities less food and energy commodities |
150.265 | 149.402 | 149.052 | 0.4 | -0.8 | -0.2 |
Energy commodities |
294.413 | 291.982 | 315.756 | -0.3 | 7.2 | 8.1 |
Services less energy services |
266.295 | 266.713 | 266.935 | 2.5 | 0.2 | 0.1 |
|
Footnotes |
||||||
|
- Data not available. |
||||||
Last Modified Date: September 14, 2012