The Flu Season
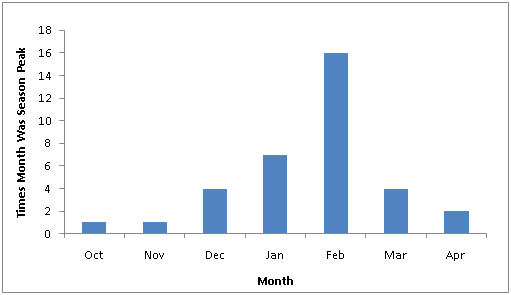
In the Northern hemisphere, winter is the time for flu, but the exact timing and duration of flu seasons vary. While flu outbreaks can happen as early as October, most of the time flu activity peaks in January or later.* The figure below shows peak flu activity for the United States by month for the 1976-77 through 2010-11 flu seasons. The "peak month of flu activity" is the month with the highest percentage of respiratory specimens testing positive for influenza virus infection. During this 35-year period, flu activity most often peaked in February (16 seasons, or 46% of the time), followed by January (7 seasons or 20% of the time), and March and December (which each peaked during 4 seasons, or 11% of the time).
Peak Month of Flu Activity
1976-77 through 2010-11

*During 2009-2010, flu activity peaked twice because of the 2009 H1N1 pandemic. Activity in the United States peaked once in the Spring, when the 2009 H1N1 virus first emerged, and again in October, when the country went through its regular flu season. CDC is considering October to be the peak of the 2009-2010 season because the April peak occurred outside the regular flu season (after the 2009-2009 flu season had ended).
Monitoring Flu Activity
CDC collects, compiles and analyzes information on influenza activity year round in the United States and produces a weekly report from October through mid-May. The U.S. influenza surveillance system is a collaborative effort between CDC and its many partners in state and local health departments, public health and clinical laboratories, vital statistics offices, physicians, and clinics and emergency departments. Information in five categories is collected from eight different data sources that allow CDC to:
- Find out when and where influenza activity is occurring
- Track influenza-related illness
- Determine what influenza viruses are circulating
- Detect changes in influenza viruses
- Measure the impact influenza is having on deaths in the United States
For more information about flu surveillance or to access these reports, visit Flu Activity & Surveillance.
Contact Us:
- Centers for Disease Control and Prevention
1600 Clifton Rd
Atlanta, GA 30333 - 800-CDC-INFO
(800-232-4636)
TTY: (888) 232-6348 - Contact CDC-INFO
- Pregunta con CDC-INFO


