|
September 2010
Back to College
Whether you're a bright-eyed freshman, an experienced upper-classman, a faithful alumnus, an educated professor, a capable administrator, or even a
 college-sports enthusiast, you are probably familiar with some of the numerous public and private colleges and universities spread across the United States. The establishment and growth of these institutions, and their contributions to the Nation, have long been one of the most notable aspects of U.S. history.
The first institutions of higher learning in colonial North America were founded to supply the demand for clergy and school teachers. In recent decades, colleges and universities have trained the workers that put men on the moon and created the Internet age.
In 2009, there were over 10,000 establishments (places of employment, whether campuses, offices, research facilities, or other locations) operated by colleges and universities in the United States. (Source: QCEW) This Spotlight presents BLS data related to college and university students and graduates, as well as colleges and universities as an industry and place of employment.
COLLEGE STUDENTS AND GRADUATES
For the College Educated: Increasing Employment ...
All of the increase in employment over the past two decades has been among workers who have taken at least some college classes or who have associate or bachelor's degrees—and mostly among workers with bachelor's degrees. The number of these college-educated workers has increased almost every year. Over the 1992–2009 period, the number of college-educated workers increased from 27 million to 44 million. In contrast, the number of employed people with only a high school diploma or without a high school diploma has remained steady or decreased.
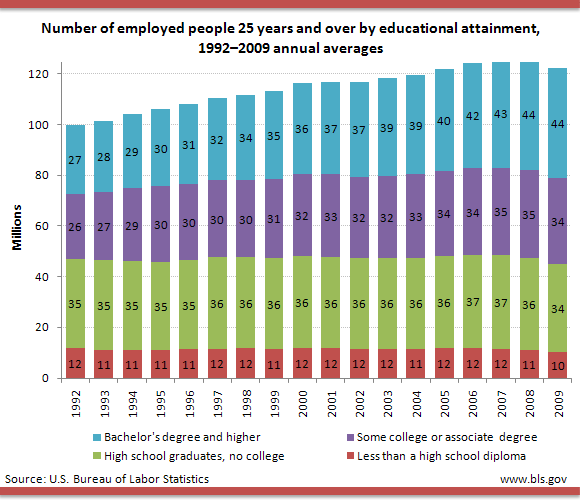
Source: Current Population Survey | Chart Data
... Lower Unemployment ...
Business cycles run their course and the economy goes from expansion to recession—but regardless of whether the economy is booming or contracting, an inverse relationship exists between education and unemployment: more education is associated with less unemployment. In 2009, the unemployment rate for workers with college degrees was 4.6 percent. The rate for workers without a high school diploma was 10 points higher.
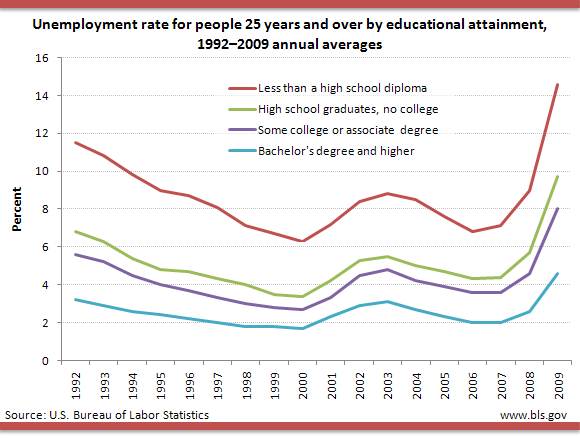
Source: Current Population Survey | Chart Data
... and Higher Earnings
If you think what people say about higher education leading to higher earnings is a cliché, you might want to consider that sometimes clichés are true. In 2009, the median weekly earnings of workers with bachelor's degrees were $1,137. This amount is 1.8 times the average amount earned by those with only a high school diploma, and 2.5 times the earnings of high school dropouts.

Source: Current Population Survey | Chart Data
Degree Attainment by Age 22
In October when they were 22 years old, 9.7 percent of young adults had bachelor's degrees and 27.0 percent were enrolled in college during the 2002–2007 period. Young women were more likely to have finished their degrees or be enrolled than young men.

Source: National Longitudinal Surveys | Chart Data
Time to Sleep, Learn, and Play
On average, college students slept 8.4 hours, engaged in educational activities (such as attending classes or studying) for 3.6 hours, and enjoyed leisure and sports activities for 3.5 hours on a typical weekday during the school year over the 2005–2009 period.

NOTE: Data include individuals, ages 15 to 49, who were enrolled full time at a university or college. Data include non-holiday weekdays and are averages for the traditional school year (September through May) 2005–09.
Source: American Time Use Survey | Chart Data
Around the World
In the United States, 40 percent of adults between the ages of 25 and 64 had bachelor's degrees in 2007. In Canada, 48 percent had bachelor's degrees.

Source: International Labor Comparisons | Chart Data
The Price of Tuition
Since 1981, the cost of college tuition has consistently increased faster than the overall inflation rate.

Source: Consumer Price Index | Chart Data
THE COLLEGE AND UNIVERSITY WORKPLACE
College and University Employment Increasing ...
Over the past five decades, college and university employment—both in terms of absolute numbers and as a percentage of total employment—has increased significantly. In 1960, about 850,000 people were employed in colleges and universities; in 2009 the number was over 3.9 million. Over the same period, the percentage of all workers who were employed by colleges and universities has doubled, increasing from 1.5 percent in 1960 to 3.0 percent in 2009.

NOTE: Employment in colleges and universities is the sum of private sector employment in colleges and universities and State government employment in education. Federal and local government college and university employment, which is relatively small, is not included. State employment in education may include some employees that are not employed in colleges and universities.
Source: Current Employment Statistics | Chart Data
... And Expected to Continue Increasing
In 2008, about 1.7 million of the people employed on campus were postsecondary teachers (that is, college professors and instructors). Their number is projected to increase to over 1.9 million—an increase of over 15 percent—from 2008 to 2018. Over the same period, employment in all occupations is projected to increase about 10 percent.

Source: Employment Projections | Chart Data
College Compensation Costs
Employer costs for employee compensation averaged $44.82 per hour worked for colleges and universities in the civilian sector in March 2010. Of this amount, $31.12 went towards wages and salaries, and $13.70 for benefits.
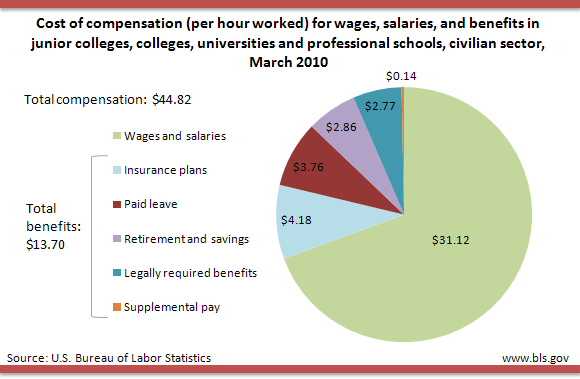
Source: National Compensation Survey | Chart Data
Professor Pay
The earnings of postsecondary teachers, and the number employed, varied by subject and specialty. Health specialties teachers, with employment of over 130,000 in May 2009, were more numerous than any other type of college or university postsecondary teacher. The number of postsecondary health specialties teachers is more than 10 times greater than the number of physics, economics, law, criminal justice and law enforcement, or agricultural science teachers. Law teachers and health specialties teachers were the highest paid postsecondary teachers; both had average annual earnings over $100,000 in 2009.

Source: Occupational Employment Statistics | Chart Data
Worker Safety
Colleges and universities are relatively safe workplaces. In 2008, the incidence rate of nonfatal occupational injuries and illnesses involving days away from work (per 10,000 full-time workers) was 64.5 in colleges and universities, compared with 113.3 in all private industry. The three most common events or exposures that caused injuries—fall on the same level, contact with object or equipment, and overexertion—were the same in both colleges and universities and private industry, albeit in different order.

Source: Injuries, Illnesses, and Fatalities | Chart Data
Note: Data in text, charts and tables are the latest available at the time of publication. Internet links may lead to more recent data.
General Information: (202) 691-5200
Media Contact: (202) 691-5902
|