|
May 2010
Employment Situation of Veterans
In honor of those who have served in the U.S. Armed Forces, this Spotlight presents information about the employment situation of veterans.

In the charts that follow, veterans are defined as men and women who previously served on active duty in the U.S. Armed Forces and who were civilians at the time they were surveyed. Nonveterans are those who never served on active duty in the U.S. Armed Forces. Veterans are grouped according to the era during which they served. Veterans who served in more than one wartime period are classified in the most recent one, and those who served during a wartime period and another period are classified in the wartime period.
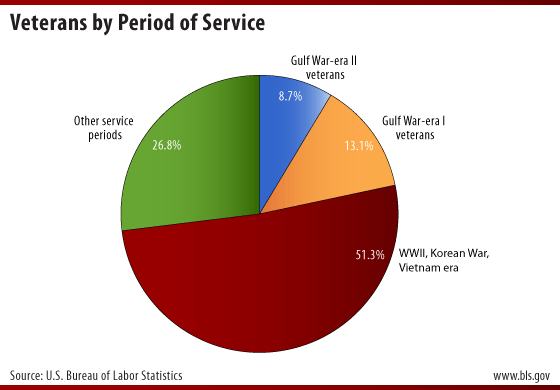
In 2009, there were 22 million veterans among the civilian population age 18 and over. About half of them served during World War II, the Korean War, and the Vietnam era. Gulf War-era II veterans—those who served sometime since September 2001—accounted for nearly 1 in 10 of all veterans.
Source: Current Population Survey, annual averages 2009 | Chart Data
NOTE: Gulf War-era II veterans served anywhere on active duty since September 2001. Gulf War-era I veterans served anywhere between August 1990 and August 2001.
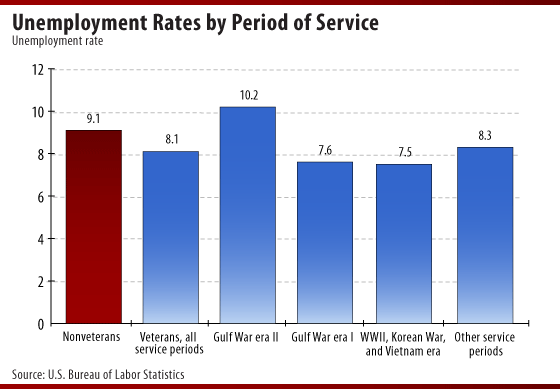
The unemployment rate for Gulf War-era II veterans is higher than the rates for other period-of-service groups, reflecting the fact that many of the more recent veterans are under the age of 35, and younger workers—whether veterans or nonveterans—are more likely to be unemployed than older workers.
Source: Current Population Survey, annual averages 2009 | Chart Data
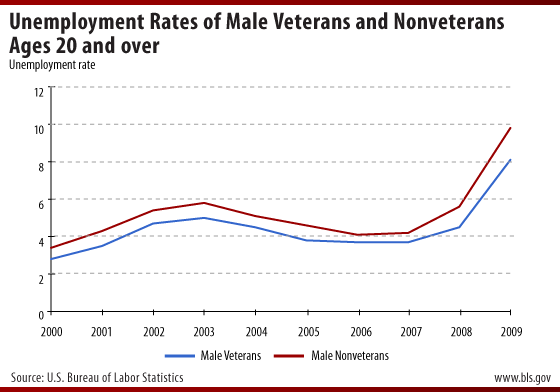
The unemployment rates of male veterans and nonveterans move in similar directions, with nonveterans having a slightly higher rate. The unemployment rates of both groups have increased recently. In 2007, the year the current recession began, the unemployment rate for male veterans age 20 and over was 3.7 percent, and for their nonveteran counterparts it was 4.2 percent. By 2009, the unemployment rates of male veterans rose to 8.1 percent, compared with 9.8 percent for male nonveterans.
Age and gender are significant factors to consider when comparing unemployment rates of veterans and nonveterans. As a group, veterans are overwhelmingly men (92 percent in 2009). Unemployment rates for men and women differ; thus, this chart focuses on unemployment rates for male veterans and nonveterans. Also, male veterans on average are older than male nonveterans. For instance, 66 percent of male veterans are at least 55 years old, compared with 22 percent of male nonveterans.
Source: Current Population Survey, annual averages 2000-09 | Chart Data
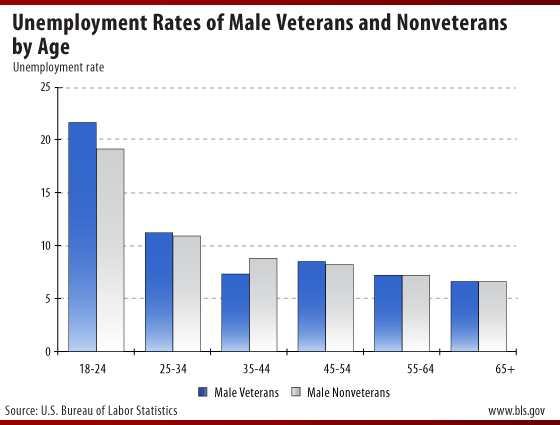
Unemployment rates of male veterans and nonveterans by age are similar. Young male veterans (those ages 18 to 24) who served during Gulf War era II had an unemployment rate of 21.6 percent in 2009, about the same as the jobless rate of young male nonveterans (19.1 percent).
Source: Current Population Survey, annual averages 2009 | Chart Data
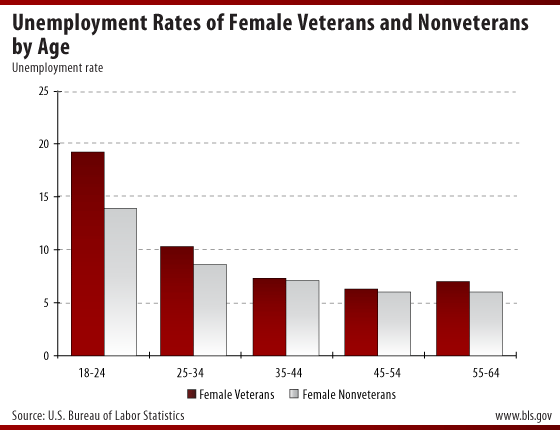
As with men, the unemployment rates of female veterans and nonveterans by age are similar.
Source: Current Population Survey, annual averages 2009 | Chart Data
NOTE: The unemployment rates of female veterans and nonveterans 18-24 years old are not statistically different due to the small sample size of female veterans 18-24 years old. Estimates with small sample sizes have large standard errors. The unemployment rate for female veterans 65 years and over does not meet publication standards because of the small sample size.
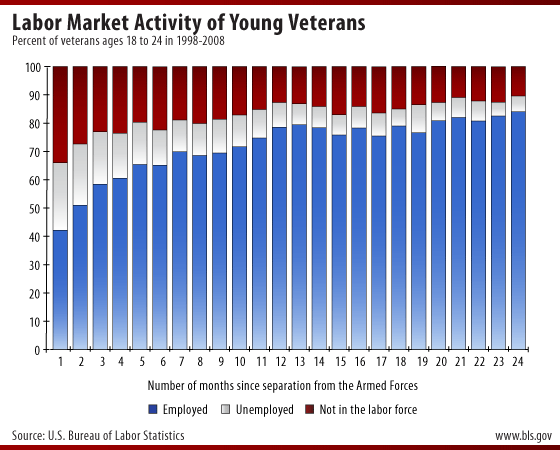
Forty-two percent of young veterans held a job in the first month following separation from the Armed Forces; this percentage rose to 84 percent after 2 years. This group includes veterans who were 18 to 24 years old in 1998 to 2008. The proportion of veterans in this age group who were unemployed fell by about three-quarters in the 2 years following discharge. Over the same 2-year period, the proportion of those out of the labor force declined from 34 percent to 10 percent.
Source: National Longitudinal Survey of Youth 1997 | Chart Data
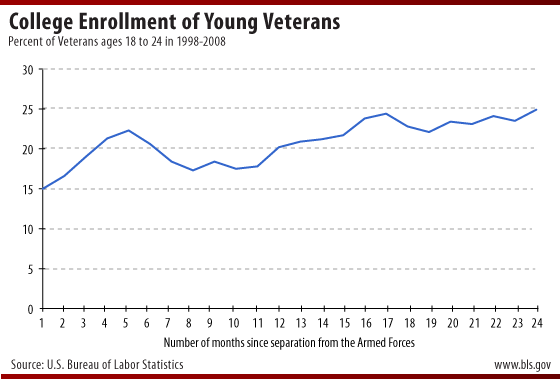
Many young veterans enroll in college after leaving the Armed Forces. In the first month after separation from the Armed Forces, 15 percent of young veterans age 18 to 24 are enrolled in college. Two years after separating, nearly a quarter of veterans ages 18 to 24 are enrolled in college.
Source: National Longitudinal Survey of Youth 1997 | Chart Data
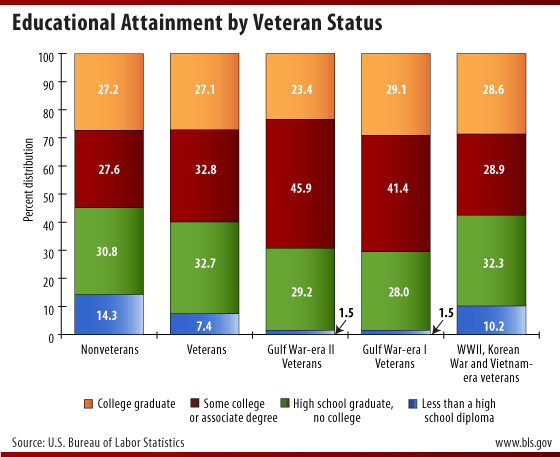
Educational attainment varies by veteran status and period of service. About the same proportion of veterans and nonveterans were college graduates in 2009, 27.1 and 27.2 percent, respectively. Gulf War-era I veterans and World War II, Korean War, and Vietnam-era veterans were more likely to be college graduates than were Gulf War-era II veterans, reflecting the younger age profile of recent veterans. In 2009, nearly half of Gulf War-era II veterans had some college or an associate degree, compared with nearly 30 percent of nonveterans. Fewer than 2 percent of recent veterans had not completed high school, compared with about 14 percent of nonveterans.
Source: Current Population Survey, annual averages 2009 | Chart Data
In 2009, veterans were more likely than nonveterans to work in production, transportation, and material moving occupations; installation, maintenance, and repair occupations; and protective service occupations. In part, this reflects the fact that most veterans are men, and men are more likely than women to be employed in these occupations. Nonveterans were more likely than veterans to work in service occupations, excluding protective service; and in sales and office occupations.

Source: Current Population Survey, annual averages 2009 | Chart Data
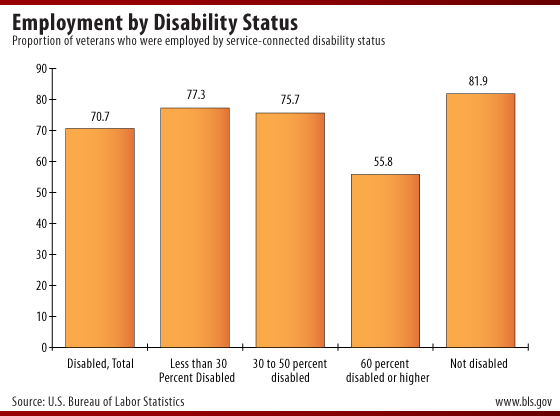
Among veterans who served sometime since August 1990, those with a service-connected disability were less likely to be employed than those without such a disability. In August 2009, 70.7 percent of disabled veterans who served since August 1990 held a job, compared with 81.9 percent of veterans without a disability related to their military service. On average, the greater the severity of the disability, the lower the proportion employed.
Source: Current Population Survey, August 2009 veterans supplement | Chart Data
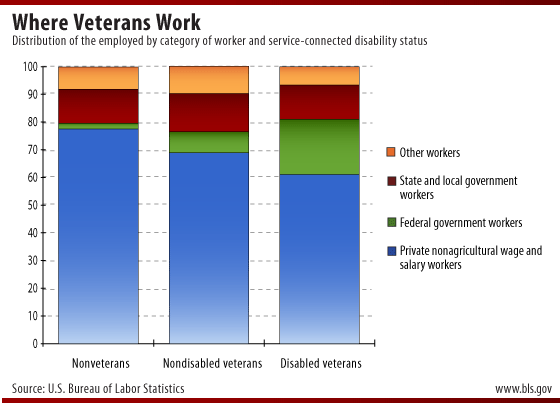
A greater share of disabled veterans worked in government (federal, state, and local) than did nondisabled veterans. About one-third of disabled veterans who held a job worked for the government (19.9 percent for the federal government and 12.4 percent for state and local governments). Among veterans without a service-connected disability, 21.4 percent worked in government; among nonveterans, this proportion was 14.3 percent.
Source: Current Population Survey, August 2009 veterans supplement | Chart Data
More Information
More information from BLS related to veterans.
Note: Data in text, charts and tables are the latest available at the time of publication. Internet links may lead to more recent data.
General Information: (202) 691-5200
Media Contact: (202) 691-5902
|


