
|
| July 2, 2012 |
|
In 2010, there were 4.9 million drug-related ED visits (Table 1). About one half (46.8 percent, or 2.3 million visits) were attributed to drug misuse or abuse with a nearly equal percentage (47.4 percent) attributed to adverse drug reactions.3,4 Of the 2.3 million ED visits involving drug misuse or abuse, 1.3 million visits involved pharmaceuticals, 1.2 million involved illicit drugs, 0.6 million involved alcohol in combination with drugs, and 0.2 million involved underage drinking.5,6,7
| Type of Visit | Number of ED Visits* |
Percent* |
|---|---|---|
| Total Drug-Related ED Visits | 4,916,328 | 100.0% |
| Drug Misuse or Abuse | 2,301,050 | 46.8% |
| Pharmaceuticals | 1,345,645 | 27.4% |
| Illicit Drugs | 1,171,024 | 23.8% |
| Alcohol** | 687,574 | 14.0% |
| In Combination with Other Drugs | 564,796 | 11.5% |
| Underage Drinking*** | 189,060 | 3.8% |
| Adverse Reactions | 2,329,221 | 47.4% |
| * Because a visit may involve multiple drugs, the sum of visits by drug will be greater than the total, and the sum of percentages will be greater than 100. ** Alcohol in combination with other drugs for patients of all ages and alcohol only for patients aged 20 or younger are recorded by DAWN. ***Underage drinking includes both use of alcohol in combination with other drugs and use of alcohol only for patients aged 20 or younger. Source: 2010 SAMHSA Drug Abuse Warning Network (DAWN). |
Patients aged 20 or younger accounted for 18.8 percent (922,953 visits) of all drug-related ED visits in 2010 (data not shown). About one half (45.3 percent, or 417,856 visits) of these visits involved drug misuse or abuse, representing a rate of 476.1 ED visits per 100,000 population aged 20 or younger. The majority of drug-related ED visits were made by patients aged 21 or older (81.2 percent, or 3,992,113 visits). Of these, about one half (47.2 percent, or 1,882,539 visits) involved drug misuse or abuse, reflecting a rate of 849.4 visits per 100,000 population aged 21 or older.
In 2010, ED visits resulting from the misuse or abuse of pharmaceuticals occurred at a rate of 434.9 visits per 100,000 population (Table 2). About half of ED visits for misuse or abuse of pharmaceuticals involved pain relievers (213.3 visits per 100,000 population). With 137.4 visits per 100,000 population, narcotic pain relievers (e.g., oxycodone and hydrocodone products) were the type of pain reliever most commonly involved. About one third of ED visits for misuse or abuse of pharmaceuticals involved anti-anxiety and insomnia drugs (152.8 visits per 100,000 population).
| Drug | Number of ED Visits* |
ED Visits per 100,000 Population |
|---|---|---|
| Alcohol—In Combination with Other Drugs | 564,796 | 182.5 |
| Alcohol—Underage Drinking** | 189,060 | 215.4 |
| Illicit Drugs | 1,171,024 | 378.5 |
| Cocaine | 488,101 | 157.8 |
| Heroin | 224,706 | 72.6 |
| Marijuana | 461,028 | 149.0 |
| Pharmaceuticals | 1,345,645 | 434.9 |
| Anti-anxiety and Insomnia Drugs | 472,769 | 152.8 |
| Benzodiazepines | 408,021 | 131.9 |
| Antidepressants | 105,229 | 34.0 |
| Pain Relievers | 659,969 | 213.3 |
| Narcotic Pain Relievers | 425,247 | 137.4 |
| Hydrocodone Products | 115,739 | 37.4 |
| Oxycodone Products | 182,748 | 59.1 |
| * Because a visit may involve multiple drugs, the sum of visits by drug will be greater than the total. **Underage drinking includes both use of alcohol in combination with other drugs and use of alcohol only for patients aged 20 or younger. Source: 2010 SAMHSA Drug Abuse Warning Network (DAWN). |
ED visits resulting from use of illicit drugs occurred at a rate of 378.5 visits per 100,000 in 2010 (Table 2). Cocaine and marijuana had the highest rates of involvement at 157.8 and 149.0 visits per 100,000 population, respectively. ED visits involving alcohol in combination with other drugs occurred at a rate of 182.5 visits per 100,000 population, whereas ED visits resulting from underage drinking occurred at a rate of 215.4 visits per 100,000 population aged 20 or younger.
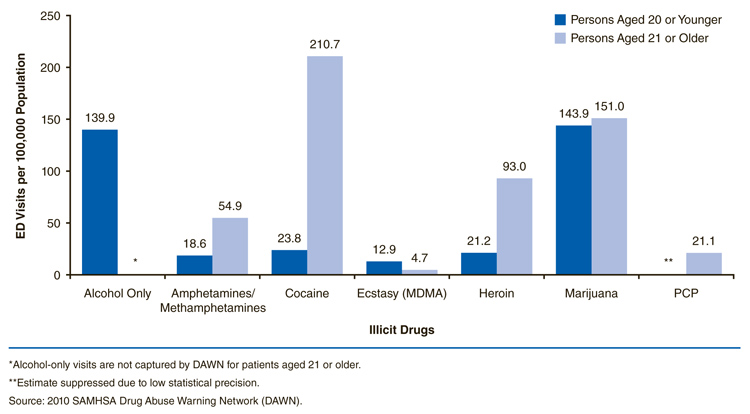
Out of the 4.0 million drug-related ED visits made by patients aged 21 or older, 1.9 million (47.2 percent or 849.4 visits per 100,000 population aged 21 or older) involved drug misuse or abuse. Cocaine was the most commonly involved illicit drug (210.7 visits per 100,000 population aged 21 or older), followed by marijuana (151.0 visits), heroin (93.0 visits), and amphetamines/methamphetamines (54.9 visits) (Figure 1). Among pharmaceuticals, benzodiazepines were involved in 168.8 visits per 100,000 population aged 21 or older (Figure 2). Narcotic pain relievers were involved in 177.4 visits with oxycodone and hydrocodone appearing in 74.5 and 48.5 visits per 100,000 population aged 21 or older, respectively. Antidepressants appeared in 41.8 visits per 100,000 population aged 21 or older and antipsychotics in 27.1 visits.
|
| Drug | Persons Aged 20 or Younger |
Persons Aged 21 or Older |
|---|---|---|
| Alcohol Only | 139.9 | * |
| Amphetamines/Methamphetamines | 18.6 | 54.9 |
| Cocaine | 23.8 | 210.7 |
| Ecstasy (MDMA) | 12.9 | 4.7 |
| Heroin | 21.2 | 93.0 |
| Marijuana | 143.9 | 151.0 |
| PCP | ** | 21.1 |
| *Alcohol-only visits are not captured by DAWN for patients aged 21 or older. **Estimate suppressed due to low statistical precision. Source: 2010 SAMHSA Drug Abuse Warning Network (DAWN). |
Out of the 922,953 visits made by patients aged 20 or younger, 417,856 (45.3 percent) involved drug misuse or abuse. This is the equivalent of 476.1 visits per 100,000 population aged 20 or younger. Slightly less than one third of these visits, or 139.9 visits per 100,000 population aged 20 or younger, involved just alcohol (Figure 1). Marijuana was also involved in about a third of visits, or 143.9 visits per 100,000 population aged 20 or younger. Rates for other illicit drugs did not exceed 25 visits per 100,000 population for this age group. Considered collectively, benzodiazepines and narcotic pain relievers occurred at rates of 38.6 and 36.3 visits per 100,000 population aged 20 or younger, respectively (Figure 2). Rates for specific benzodiazepines or narcotic pain relievers did not exceed 20 visits per 100,000 population aged 20 or younger.

|
| Drug | Persons Aged 20 or Younger |
Persons Aged 21 or Older |
|---|---|---|
| Benzodiazepines | 38.6 | 168.8 |
| Narcotic Pain Relievers | 36.3 | 177.4 |
| Hydrocodone Products | 9.5 | 48.5 |
| Oxycodone Products | 19.8 | 74.5 |
| Antidepressants | 14.3 | 41.8 |
| Antipsychotics | 10.2 | 27.1 |
| Source: 2010 SAMHSA Drug Abuse Warning Network (DAWN). |
The total number of drug-related ED visits increased 94 percent from 2004 (2.5 million visits) to 2010 (4.9 million visits). ED visits involving misuse or abuse of pharmaceuticals increased 115 percent between 2004 and 2010, going from 626,472 visits in 2004 to 1,345,645 visits in 2010 (Figure 3); the corresponding rates were 213.9 visits per 100,000 population in 2004 and 434.9 visits in 2010 (Table 3). Ranging from 0.9 to 1.2 million visits, the overall level of ED visits involving illicit drug use did not change significantly across the time period (Figure 3). ED visits resulting from alcohol involvement with drug use and underage drinking also did not change significantly (Table 3).

|
| Year | Adverse Reactions* | Misuse or Abuse of Pharmaceuticals |
Misuse or Abuse of Illicit Drugs |
|---|---|---|---|
| 2004 | * | 626,472 | 991,640 |
| 2005 | 1,250,377 | 765,314 | 922,013 |
| 2006 | 1,526,010 | 859,136 | 958,864 |
| 2007 | 1,908,928 | 984,894 | 974,631 |
| 2008 | 2,157,128 | 1,126,407 | 994,508 |
| 2009 | 2,287,273 | 1,243,633 | 974,384 |
| 2010 | 2,329,221 | 1,345,645 | 1,171,024 |
| * Estimate for 2004 suppressed due to low statistical precision. Note: Estimates may be slightly different from those reported in previous years due to updating of DAWN's drug categorization system and resultant reassignment of drugs to drug codes. Rates may change due to changes in intercensal population estimates. For further information on the DAWN drug lexicon and updating process, see http://www.samhsa.gov/data/DAWN.aspx. Source: 2010 SAMHSA Drug Abuse Warning Network (DAWN). |
| Type of Visit | 2004 | 2005 | 2006 | 2007 | 2008 | 2009 | 2010 | Percent Change, 2004 to 2010* |
|---|---|---|---|---|---|---|---|---|
| Total Drug-Related ED Visits | 866.7 | 1,018.2 | 1,153.6 | 1,326.8 | 1,441.2 | 1,497.9 | 1,589.0 | 94% |
| Accidental Ingestion (Aged 5 or Younger) |
220.8 | 192.7 | 244.7 | 275.8 | 288.3 | 259.4 | 300.2 | NC |
| Adverse Reactions | ** | 423.1 | 511.5 | 633.5 | 709.2 | 745.6 | 752.8 | 86% |
| Drug Misuse or Abuse | 552.9 | 547.0 | 584.2 | 624.9 | 657.5 | 674.9 | 743.7 | NC |
| Illicit Drugs | 338.7 | 312.0 | 321.4 | 323.4 | 327.0 | 317.6 | 378.5 | NC |
| Alcohol*** | 230.5 | 178.4 | 193.6 | 210.6 | 216.0 | 214.6 | 222.2 | NC |
| In Combination with Other Drugs |
178.9 | 141.0 | 151.1 | 165.0 | 172.3 | 169.4 | 182.5 | NC |
| Underage Drinking+ | 238.8 | 183.9 | 212.0 | 225.8 | 217.8 | 227.9 | 215.4 | NC |
| Pharmaceuticals | 213.9 | 259.0 | 287.9 | 326.8 | 370.4 | 405.4 | 434.9 | 115% |
| * Percent change is measured as difference in the estimated number of visits (not rates) between 2004 and 2010 except for Adverse Reactions where change is measured from 2005 to 2010. Reported changes are significant at the .05 level; "NC" signifies no significant change. ** Estimate suppressed due to low statistical precision. ***Alcohol in combination with other drugs for patients of all ages and alcohol only for patients aged 20 or younger are recorded by DAWN. + Underage drinking includes both use of alcohol in combination with other drugs and use of alcohol alone for patients aged 20 or younger. Note: Estimates may be slightly different from those reported in previous years due to updating of DAWN's drug categorization system and resultant reassignment of drugs to drug codes. Rates may change due to changes in intercensal population estimates. For further information on the DAWN drug lexicon and updating process, see http://www.samhsa.gov/data/DAWN.aspx. Source: 2010 SAMHSA Drug Abuse Warning Network (DAWN). |
Visits involving two illicit drugs and several types of pharmaceuticals showed significant increases over this 7-year period (Table 4). Oxycodone products had the largest increase in terms of the absolute number of visits; there were 131,330 more visits in 2010 than in 2004. The second largest increase was for visits involving hydrocodone products, for which there were 69,203 more visits 2010 than 2004.
| Drug | ED Visits, 2004 | ED Visits, 2010 | Percent Change, 2004 to 2010* |
|---|---|---|---|
| Illicit Drugs | 991,640 | 1,171,024 | NC |
| Marijuana | 281,619 | 461,028 | 64% |
| MDMA (Ecstasy) | 10,227 | 21,836 | 114% |
| Pharmaceuticals | 626,472 | 1,345,645 | 115% |
| Anti-anxiety and Insomnia Drugs | 210,711 | 472,769 | 124% |
| Benzodiazepines | 170,471 | 408,021 | 139% |
| Antipsychotics | 41,930 | 69,149 | 65% |
| CNS Stimulants (e.g., ADHD Drugs) | 10,656 | 31,507 | 196% |
| Muscle Relaxants | 29,014 | 58,783 | 103% |
| Pain Relievers | 282,275 | 659,969 | 134% |
| Narcotic Pain Relievers | 166,338 | 425,247 | 156% |
| Hydrocodone Products | 46,536 | 115,739 | 149% |
| Oxycodone Products | 51,418 | 182,748 | 255% |
| * Percent change is measured as difference in the estimated number of visits between 2004 and 2010. Reported changes are significant at the .05 level; "NC" signifies no significant change. Source: 2010 SAMHSA Drug Abuse Warning Network (DAWN). |
Among anti-anxiety and insomnia drugs, involvement of benzodiazepines increased 139 percent, with 237,550 more visits in 2010 than in 2004. Among other types of drugs, ED visits involving muscle relaxants increased by 103 percent, with about 30,000 more visits; visits involving central nervous system stimulants (e.g., ADHD drugs) increased 196 percent, with about 20,000 more visits. Visits related to antipsychotics increased 65 percent, with 27,219 more visits in 2010.
Although there was no significant change between 2004 and 2010 in the number of visits involving illicit drugs as a whole, visits involving marijuana increased 64 percent, reflecting 179,409 more visits, and visits related to MDMA (Ecstasy) increased 114 percent, with 11,609 more visits.
For patients aged 20 or younger, ED visits resulting from misuse or abuse of pharmaceuticals increased 45 percent between 2004 and 2010 (116,176 to 168,409 visits, respectively); among patients aged 21 or older, there was an increase of 131 percent (509,067 to 1,176,842 visits, respectively) (data not shown). There were no significant changes overall in ED visits involving illicit drugs for either age group or for ED visits involving underage drinking by those aged 20 or younger. Visits involving marijuana increased for both age groups. Visits by patients aged 20 or younger also saw a 189 percent increase in Ecstasy involvement between 2004 and 2010.
ED visits involving adverse reactions to pharmaceuticals taken as prescribed or indicated increased 86 percent between 2005 and 2010, from 1,250,377 visits in 2005 to 2,329,221 visits in 2010 (Figure 3).8 The rate for adverse reactions ranged from 423.1 visits per 100,000 population in 2005 to 752.8 visits in 2010 (Table 3).
In 2010, the highest rates of drug-related adverse reactions was found among patients aged 65 or older with 1,678.9 visits per 100,000 population (data not shown). Drugs to treat cardiovascular conditions are often involved in adverse reactions for patients aged 65 or older (300.3 visits per 100,000 population aged 65 or older). Other drugs found at higher levels for older adults were anticoagulants (270.6 visits per 100,000 population aged 65 or older), pain relievers (263.7 visits), drugs to treat infections (215.7 visits), drugs to treat diabetes (167.4 visits), and cancer drugs (116.6 visits).
DAWN data demonstrate the increasing involvement of pharmaceuticals in ED visits related to both drug misuse or abuse and adverse reactions. When used either as directed or recreationally, pharmaceuticals can sometimes produce life-threatening health conditions. It falls to the public health community to raise awareness of possible serious consequences of prescription as well as over-the-counter drugs. This objective is especially challenging because pharmaceuticals are perceived as being safe because they are legally manufactured and dispensed. Effective educational efforts will emphasize the difference between appropriate therapeutic use and drug misuse or abuse. Clear communication of possible interactions with other drugs and alcohol is critical. Drug packaging and labeling can be designed so that possible side effects are obvious even to those with low literacy levels. Raising awareness among first responders, such as emergency medical technicians and emergency department staff, about the possible effects of pharmaceuticals and appropriate treatments can also help reduce the negative effects of these drugs on patients' health and well-being.
Pharmacists have been using technology—such as software that allows them to record a patient's medications and potential interactions or contraindications—as another avenue toward increased drug safety. Patients also can reduce the potential for adverse effects by showing an updated list of all their drugs and supplements to doctors and pharmacists when they are prescribed a new medication.
Additional suggestions for methods to increase public awareness, reduce nonmedical use, and control access to pharmaceuticals are provided in the Centers for Disease Control and Prevention's 2011 publication Policy Impact: Prescription Painkiller Overdoses.9
|
The Drug Abuse Warning Network (DAWN) is a public health surveillance system that monitors drug-related morbidity and mortality. DAWN uses a probability sample of hospitals to produce estimates of drug related emergency department (ED) visits for the United States and selected metropolitan areas annually. DAWN also produces annual profiles of drug related deaths reviewed by medical examiners or coroners in selected metropolitan areas and States. Any ED visit related to recent drug use is included in DAWN. All types of drugs—licit and illicit—are covered. Alcohol involvement is documented for patients of all ages if it occurs with another drug. Alcohol is considered an illicit drug for minors and is documented even if no other drug is involved. The classification of drugs used in DAWN is derived from the Multum Lexicon, copyright 2010 Lexi-Comp, Inc. and/or Cerner Multum, Inc. The Multum Licensing Agreement governing use of the Lexicon can be found at http://www.samhsa.gov/data/DAWN.aspx. DAWN is one of three major surveys conducted by the Substance Abuse and Mental Health Services Administration's Center for Behavioral Health Statistics and Quality (SAMHSA/CBHSQ). For more information on other CBHSQ surveys, go to http://www.samhsa.gov/data/. SAMHSA has contracts with Westat (Rockville, MD) and RTI International (Research Triangle Park, NC) to operate the DAWN system and produce publications. For publications and additional information about DAWN, go to http://www.samhsa.gov/data/DAWN.aspx. |
| The DAWN Report is published periodically by the Center for Behavioral Health Statistics and Quality (formerly the Office of Applied Studies), Substance Abuse and Mental Health Services Administration (SAMHSA). All material appearing in this report is in the public domain and may be reproduced or copied without permission from SAMHSA. Additional copies of this report or other reports from the Center for Behavioral Health Statistics and Quality are available online: http://www.samhsa.gov/data/. Citation of the source is appreciated. For questions about this report, please e-mail: shortreports@samhsa.hhs.gov.
DAWN_096 |

|