Subscribe
to the OES Update
|
Overview
Office and administrative support occupations made up more than one out of every six jobs
in the United States.
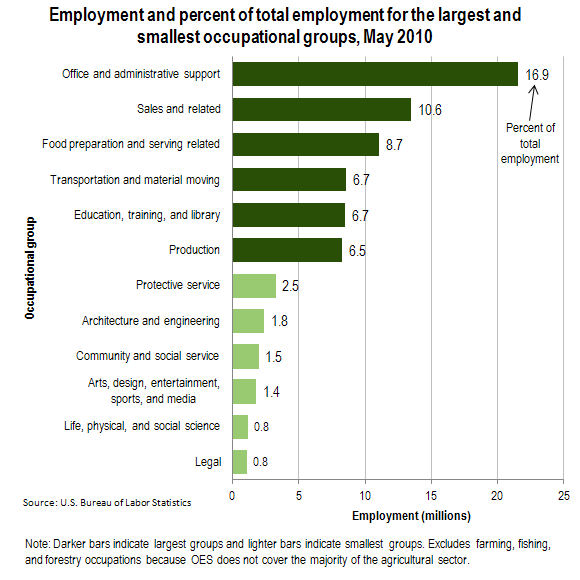
- Office and administrative support was the largest occupational group in the United States, making up 17 percent of employment. Three of the 10 largest occupations were in this group: general office clerks; customer service representatives; and secretaries and administrative assistants, except legal, medical, and executive. Sales and related occupations was the second largest occupational group, and included the two largest individual occupations, retail salespersons and cashiers.
- The smallest occupational groups each made up 3 percent or less of U.S. employment. Several of these groups consisted primarily of occupations requiring postsecondary education, such as architects, social workers, and scientists.
- Four of the six smallest
occupational groups had annual mean wages above the U.S. all-occupations average of $44,410; all of the largest occupational
groups, except the education,
training, and library group, had below-average wages.
The average wage for the highest paying occupational group was nearly five
times that of the lowest paying group.
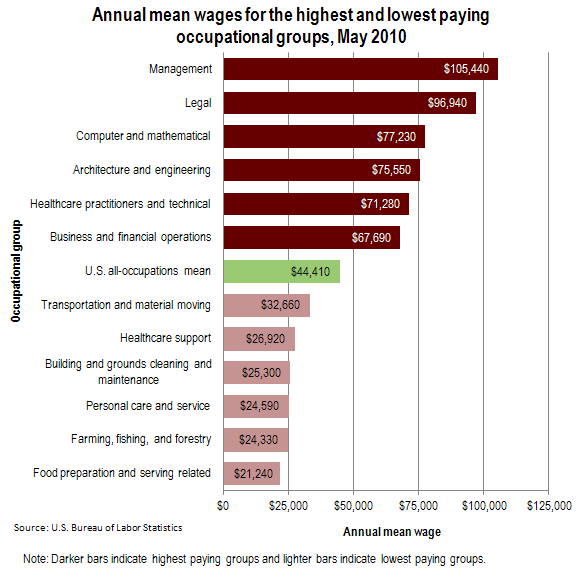
- Annual mean wages by
occupational group ranged from
$21,240 for food preparation
and serving related occupations
to $105,440 for management
occupations. Nearly every
management occupation had an
average wage above the U.S. all-occupations mean of $44,410, while
nearly all food preparation and
serving related occupations had
an annual mean wage of less than
$25,000.
- Although healthcare practitioners
and technical occupations included some of the highest paying
individual occupations, this group also included occupations with more moderate wages, such as
dietetic technicians ($28,820).
- Among the low-paying
occupational groups, transportation
and material moving had the highest paying individual occupations, including air traffic
controllers ($110,280). However, the
largest occupation in this group—
laborers and hand freight, stock,
and material movers—had an
average wage of $25,710.
The types of jobs found in the private sector were different from those found in the public sector.
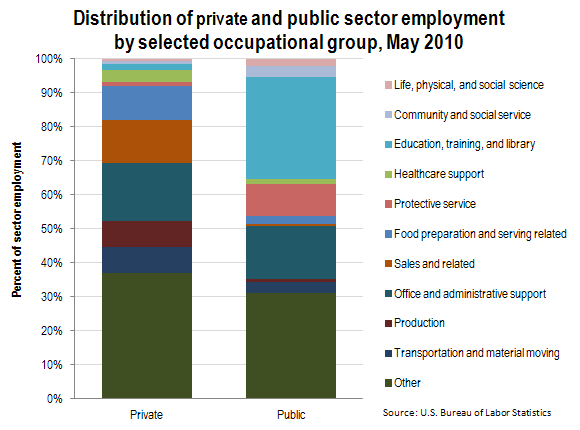
- Occupational groups with below-average wages made up more
than two-thirds of private sector
employment, but less than one-third of public sector employment.
- Sales and related occupations
was the second-largest
occupational group in the private
sector, but it was one of the
smallest occupational groups in the
public sector. The private sector
also had higher employment shares of most other occupational groups
that had below-average wages,
including food preparation and serving related occupations and
production occupations.
- Education, training, and library was the largest occupational
group in the public sector,
making up 30 percent of public
sector employment, but less
than 2 percent of private sector
employment.
Ten occupations made up nearly a quarter of private sector employment.
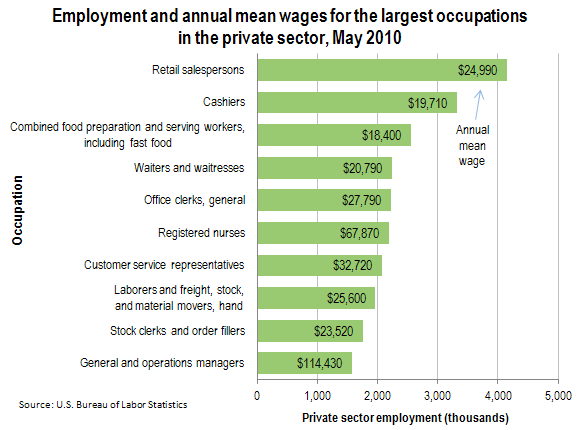
- Retail salespersons and cashiers were the two largest private sector occupations, making up about 7 percent of private sector employment.
- Ninety-four percent of employment in the 10 occupations shown in figure 4 was in the private sector. Among the individual occupations shown, private sector employment ranged from 79 percent of general office clerks to nearly 100 percent of retail salespersons and waiters and waitresses.
- All of the 10 largest private
sector occupations also were
among the 10 largest occupations
overall, except for stock clerks
and order fillers and general and
operations managers, which
were the 11th and 12th largest
occupations overall.
- Most of the largest private sector
occupations were relatively low
paying. Of the 10 largest private
sector occupations, only general
and operations managers and
registered nurses had annual
mean wages above the U.S. all-occupations average of $44,410.
Different types of teachers and teacher assistants made up 5 of the 10 largest
public sector occupations.
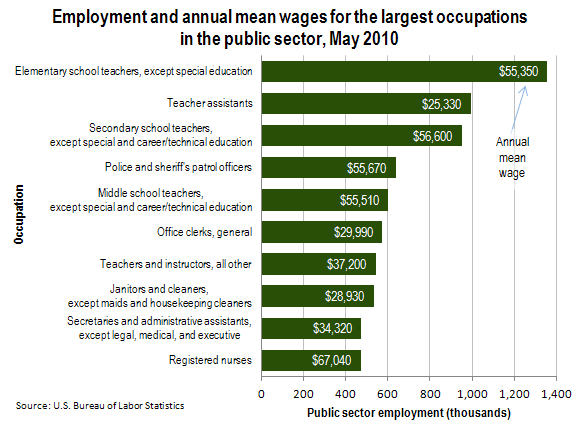
- Teacher assistants and elementary, secondary, and middle school teachers, except special and career/technical education made up about 18 percent of public sector employment. These occupations were found primarily in local government, where they made up over one-quarter of total employment.
- Police and sheriff’s patrol
officers, general office clerks, and
janitors were among the largest
occupations in both state and local
government, and registered nurses
was among the largest occupations
at all levels of government.
- In addition to the occupations shown in the chart, the largest occupations in local government included firefighters and school or special client bus drivers. Correctional officers was the largest individual occupation in state government. Four occupations specific to the U.S. Postal Service made up about 21 percent of federal government employment; compliance officers and management analysts also were among the largest federal government occupations.
Four occupations made up over 60 percent of retail trade employment.
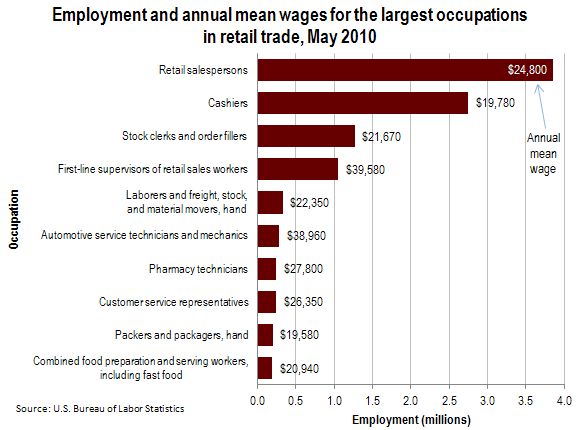
- Jobs in retail trade businesses
accounted for nearly 12 percent
of U.S. jobs, making it one of
the largest industry sectors,
along with healthcare and social assistance, educational services,
manufacturing, and accommodation
and food services.
- More than 60 percent of
retail trade jobs were in just four
occupations: retail salespersons,
cashiers, stock clerks and order
fillers, and first-line supervisors of
retail sales workers.
- All of the 10 largest retail
trade occupations had annual mean wages below the U.S. all-occupations average of $44,410.
The high share of lower paying jobs
in retail trade helped account for
this sector’s relatively low overall
average wage of $28,980.
Next: STEM
(science, technology,
engineering, and
mathematics)
Last Modified Date: October 24, 2011
|