Contact Us:
- CDC Diabetes Public Inquiries
- 800-CDC-INFO
(800-232-4636)
TTY: (888) 232-6348
8am-8pm ET
Monday-Friday
Closed Holidays - cdcinfo@cdc.gov
Studies on the Cost of Diabetes
Historical
This webpage is archived for historical purposes and is no longer being maintained or updated.
Thomas J Songer, PhD, MSc
Lorraine Ettaro, BS
and the Economics of Diabetes Project Panel
Prepared for Centers for Disease Control and Prevention
National Center for Chronic Disease Prevention and Health Promotion
Division of Diabetes Translation
Atlanta, GA
June 1998
Appendices
- Appendix A – Price inflation and diabetes prevalence adjusters
- Appendix B – Direct costs, adjusted for price inflation, using Gross Domestic Product deflator, and diabetes prevalence
- Appendix C – Direct costs, adjusted for price inflation, using Consumer Price Index all items, and diabetes prevalence
- Appendix D – Direct costs, adjusted for price inflation, using Consumer Price Index medical care, and diabetes prevalence
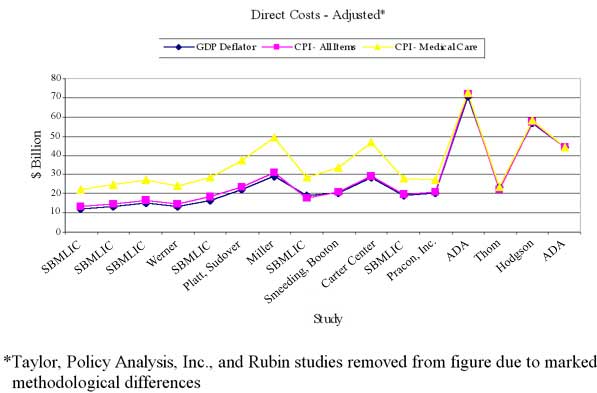
- Appendix E – Direct costs, adjusted
- Appendix F – Economics of Diabetes Project. Summary and Key Findings of Panel Meeting. April 6-7, 1998, Atlanta, GA
Appendix A
Price inflation and diabetes prevalence adjusters
| Year | Diabetes prevalence* (millions) |
GDP deflator** | CPI - all items *** | CPI - medical care*** |
|---|---|---|---|---|
| 1969 | 3.378^ | 0.2843 | 36.7 | 31.9 |
| 1973 | 4.191 | 0.3442 | 44.4 | 38.8 |
| 1975 | 4.780 | 0.4071 | 53.8 | 47.5 |
| 1977 | 5.084^ | 0.4697 | 60.6 | 57.0 |
| 1979 | 5.466 | 0.5444 | 72.6 | 67.5 |
| 1980 | 5.466 | 0.5928 | 82.4 | 74.9 |
| 1984 | 6.053 | 0.7576 | 103.9 | 106.8 |
| 1987 | 6.641 | 0.8293 | 113.6 | 130.1 |
| 1992 | 7.417 | 1.0000 | 140.3 | 190.1 |
| 1993 | 7.813 | 1.0264 | 144.5 | 201.4 |
| 1995 | 9.057 | 1.0782 | 152.4 | 220.5 |
| 1997 | 10.300^^ | 1.1274 | 160.5 | 234.6 |
* Source: National Health Interview Survey, Diabetes in America, chapter 4, references 15-27
** Source:
*** Source: U.S. Bureau of Economic Analysis, Survey of Current Business (fiscal year 1992 = 1.0000).
^ Prevalence estimates extrapolated from Source 1.
^^ Source: Centers for Disease Control and Prevention, 1997, in The American Diabetes Association. Economic consequences of diabetes mellitus in the United States in 1997. Diabetes Care 1998; 2:296-309.
Appendix B
Direct costs, adjusted for price inflation, using GDP deflator, and diabetes prevalence
| Study | Year |
As Reported ($ billion) |
Adjusted for Inflation ($ billion - 1997) |
Adjusted for Inflation and Diabetes Prevalence ($ billion - 1997) |
|---|---|---|---|---|
| Statistical Bureau of the Metropolitan Life Insurance Company (SBMLIC) | 1969 | 1.00 | 3.95 | 12.04 |
| SBMLIC | 1973 | 1.65 | 5.4 | 13.28 |
| SBMLIC | 1975 | 2.52 | 6.98 | 15.04 |
| Werner | 1975 | 2.25 | 6.23 | 13.42 |
| SBMLIC | 1977 | 3.40 | 8.16 | 16.53 |
| Taylor | 1977 | 6.94 | 16.66 | 33.74 |
| Policy Analysis, Inc. | 1977 | 10.80 | 25.92 | 52.52 |
| Platt, Sudover | 1979 | 5.64 | 11.68 | 22.01 |
| Miller | 1979 | 7.46 | 15.44 | 29.09 |
| SBMLIC | 1980 | 4.80 | 9.13 | 18.73 |
| Smeeding, Booton | 1980 | 5.66 | 10.76 | 20.28 |
| Carter Center | 1980 | 7.85 | 14.93 | 28.14 |
| SBMLIC | 1984 | 7.43 | 11.06 | 18.81 |
| Pracon, Inc. | 1987 | 9.60 | 13.05 | 20.24 |
| Rubin | 1992 | 85.71 | 96.63 | 134.19 |
| ADA | 1992 | 45.22 | 50.98 | 70.80 |
| Thom | 1993 | 15.10 | 16.59 | 23.04 |
| Hodgson | 1995 | 47.87 | 50.06 | 56.93 |
| ADA | 1997 | 44.14 | 44.14 | 44.14 |
Appendix C
Direct costs, adjusted for price inflation, using CPI - all items, and diabetes prevalence
| Study | Year |
As Reported ($ billion) |
Adjusted for Inflation ($ billion - 1997) |
Adjusted for Inflation and Diabetes Prevalence ($ billion - 1997) |
|---|---|---|---|---|
| Statistical Bureau of the Metropolitan Life Insurance Company (SBMLIC) | 1969 | 1.00 | 4.36 | 13.28 |
| SBMLIC | 1973 | 1.65 | 5.96 | 14.66 |
| SBMLIC | 1975 | 2.52 | 7.52 | 16.20 |
| Werner | 1975 | 2.25 | 6.71 | 14.46 |
| SBMLIC | 1977 | 3.40 | 9.00 | 18.24 |
| Taylor | 1977 | 6.94 | 18.38 | 37.23 |
| Policy Analysis, Inc. | 1977 | 10.80 | 28.60 | 57.95 |
| Platt, Sudover | 1979 | 5.64 | 12.47 | 23.50 |
| Miller | 1979 | 7.46 | 16.48 | 31.06 |
| SBMLIC | 1980 | 4.80 | 9.35 | 17.62 |
| Smeeding, Booton | 1980 | 5.66 | 11.02 | 20.77 |
| Carter Center | 1980 | 7.85 | 15.29 | 28.82 |
| SBMLIC | 1984 | 7.43 | 11.48 | 19.53 |
| Pracon, Inc. | 1987 | 9.60 | 13.56 | 21.03 |
| Rubin | 1992 | 85.71 | 98.05 | 136.16 |
| ADA | 1992 | 45.22 | 51.73 | 71.84 |
| Thom | 1993 | 15.10 | 16.77 | 22.11 |
| Hodgson | 1995 | 47.87 | 50.42 | 57.33 |
| ADA | 1997 | 44.14 | 44.14 | 44.14 |
Appendix D
Direct costs, adjusted for price inflation, using CPI - medical care, and diabetes prevalence
| Study | Year |
As Reported ($ billion) |
Adjusted for Inflation ($ billion - 1997) |
Adjusted for Inflation and Diabetes Prevalence ($ billion - 1997) |
|---|---|---|---|---|
| Statistical Bureau of the Metropolitan Life Insurance Company (SBMLIC) | 1969 | 1.00 | 7.32 | 22.33 |
| SBMLIC | 1973 | 1.65 | 9.98 | 24.50 |
| SBMLIC | 1975 | 2.52 | 12.45 | 26.82 |
| Werner | 1975 | 2.25 | 11.11 | 23.94 |
| SBMLIC | 1977 | 3.40 | 13.99 | 28.35 |
| Taylor | 1977 | 6.94 | 28.56 | 57.86 |
| Policy Analysis, Inc. | 1977 | 10.80 | 44.45 | 90.06 |
| Platt, Sudover | 1979 | 5.64 | 19.61 | 36.94 |
| Miller | 1979 | 7.46 | 25.91 | 48.82 |
| SBMLIC | 1980 | 4.80 | 15.03 | 28.33 |
| Smeeding, Booton | 1980 | 5.66 | 17.73 | 33.41 |
| Carter Center | 1980 | 7.85 | 24.59 | 46.34 |
| SBMLIC | 1984 | 7.43 | 16.32 | 27.85 |
| Pracon, Inc. | 1987 | 9.60 | 17.31 | 26.85 |
| Rubin | 1992 | 85.71 | 105.77 | 146.88 |
| ADA | 1992 | 45.22 | 52.11 | 72.36 |
| Thom | 1993 | 15.10 | 17.59 | 23.19 |
| Hodgson | 1995 | 47.87 | 50.93 | 57.92 |
| ADA | 1997 | 44.14 | 44.14 | 44.14 |
|
|
Appendix F
The goal of the economics of diabetes project was to conduct a critical review of the literature regarding the cost of diabetes in the United States and to develop a research agenda for future diabetes economics studies. This report was contracted as part of this project. In addition, a panel of experts (economists, health services researchers, and epidemiologists) was convened on April 6-7, 1998 in Atlanta, GA to assess the current knowledge about the costs of diabetes, assess the strengths and limitations of the currently available diabetes cost studies, and identify future research strategies. The following is a summary of the discussions from this meeting as well as a list of panel members.
Summary and Key Findings of Panel Meeting
April 6-7, 1998, Atlanta, GA
The meeting was attended by 10 expert panel members and several CDC staff (see attached agenda, panel members and CDC participant list)
Robert Rubin, M.D., presented his study (Rubin RJ et al. Health care expenditures for people with diabetes mellitus, 1992. J Clin Endocrin Met 1994; 78: 809A-809F) noting that the cost of care on persons with diabetes was $105 billion in the U.S. in 1992. He clearly explained that the purpose of his study was to examine cost in persons with diabetes, not the portion attributable to diabetes. The study took a health services perspective and determined the extent to which health care resources were disproportionately consumed in the diabetic population. He found that a major portion of costs was incurred in the hospital. These findings resulted in further investigations attempting to improve the use of hospital resources.
Thomas Hodgson, Ph.D., presented his recently completed (and unpublished) diabetes cost-of-illness (COI) study. He found that the total direct costs of diabetes in the U.S. were $48 billion in 1995. He used several data sources, determined the degree of variability in the estimates, scaled the total cost to the total expenditures, and used both the attributable fraction and population attributable fraction to determine the diabetes contribution to various other chronic and acute conditions.
Nancy Fox, Ph.D., presented her 1997 American Diabetes Association-sponsored COI study (The American Diabetes Association. Economic consequences of diabetes mellitus in the U.S. in 1997. Diabetes Care 1997; 21: 296-309) which estimated $44 billion in direct costs and $54 billion in indirect costs for diabetes in 1997. She used several datasets and the population attributable fraction to determine the diabetes fraction when it was listed as secondary and tertiary diagnoses. Compared to her 1992 ADA-sponsored COI study, the direct costs were slightly less in the 1997 study due to shorter hospital stays and a shift from inpatient care to outpatient care.
Partha Deb, Ph.D., presented some preliminary analyses examining the attributable fraction methodology and found that including simple demographic variables in models to determine the attributable fractions dramatically changed the values.
Thomas Songer, Ph.D., gave an overview of several COI studies. There is an apparent trend showing the cost of diabetes increasing dramatically from $3 billion in 1969 to over $100 billion in 1997. However, during this period the data and methods have changed dramatically making direct comparisons between studies over this time period difficult. The major increase in cost noted in the 1980s and 1990s was due to inclusion of attributable fractions and indirect costs.
Cameron Donaldson, Ph.D., discussed the value of COI studies. He noted that COI studies are used to set health priorities and research priorities. He questioned whether this was an appropriate use of the COI results because of the paradox where the most expensive disease will get more resources. This strategy disregards further understanding of why the disease is expensive. He discussed the challenges in measuring the indirect costs (premature mortality, short term and long term disability, pain/suffering, and quality of life), and that good methods do not currently exist.
Key points in subsequent discussions and group sessions were:
- Further diabetes COI studies are not needed currently. It was
suggested that none are needed for at least 5 years. Determination of
when to repeat COI studies may be dictated by dramatic changes in the
future of either the natural history of the disease or its treatment.
- COI studies have usually been conducted following requests from
Congress, political officials, and advocacy groups.
- COI studies may be used inappropriately for policy decisions. They
may provide crude understanding of which conditions are costly. For
specific diseases, they help in understanding where most costs are
incurred (which can be target areas for further research and
interventions).
- There is a need to better understand the quality of economic
information needed to make policy decisions. A "perfect" study is not
always necessary.
- Indirect costs (premature mortality, productivity loss, long/short
term disability, and quality of life) are very important to all economic
studies. However, there are major challenges as to what should be
measured, how to measure it, and how to assign a monetary value.
- The attributable fraction of expenditures (i.e., the portion of
expenditures that are solely attributable to diabetes) account for a
major portion of the direct costs. However, limitations in the datasets,
incomplete coding, and undiagnosed diabetes make a precise, accurate,
and valid attributable fraction difficult to determine. Multi-discipline
approaches (economists, health services researchers, and
epidemiologists) need to refine the methods.
- There is a need for uniform economic data. For diabetes, a data
panel routinely administered in national surveys would be of great
benefit.
- Methods for economic studies should be standardized for identifying
diabetes from various datasets. However, the analytic strategies should
not be restricted. Studies need to describe the methods better. Detailed
supplemental reports are necessary for subsequent investigators to
duplicate and extend previous findings.
- Cost-effectiveness studies are important to make policy decisions on
health care delivery.
- All health care intervention studies should have cost-effectiveness
studies planned and conducted concomitantly.
In summary, economic information is of great importance for defining the burden and developing public health policies for diabetes. The current focus of further research for the Division of Diabetes Translation and the greater diabetes community should be in refining economics methods, specifically for attributable fractions and indirect costs, and in conducting cost-effectiveness assessments of interventions as they are tested.
April 6, 1998
| Time | Session | Presenter | Minutes |
|---|---|---|---|
| 9:00 a.m. | Introduction/Orientation Overview, goals and objectives |
CDC | 10 min. |
| 9:10 a.m. | Cost of care for person with diabetes | Rubin | 20 min. |
| Q and A, Discussion | 10 min. | ||
| 9:40 a.m. | Cost of diabetes | Hodgson | 20 min. |
| Q and A, Discussion | 10 min. | ||
| 10:10 a.m. | Cost of diabetes and cost of care for diabetes | Fox | 20 min. |
| Q and A, Discussion | 10 min. | ||
| 10:40 a.m. | Break | 15 min | |
| 10:55 a.m. | Cost of diabetes ¾ new methods | 20 min. | |
| Q and A, Discussion | 10 min. | ||
| 11:25 a.m. | Other diabetes cost studies ¾ overview | Songer | 20 min. |
| Q and A, Discussion | 10 min. | ||
| 1:00 p.m. | Value of various economic studies | Donaldson | 10 min. |
| 1:10 p.m. | Breakout groups ¾ Groups A and B Topics*:
|
Donaldson | 10 min. |
| 3:30 p.m. | Group A report | | |
| 4:15 p.m. | Group B report | | |
| 5:00 p.m. | Discussion | | |
| 5:15 p.m. | Adjourn | |
*Specific questions to address will be presented
April 7, 1998
| 9:00 a.m. | Comments on draft of literature review | Songer | 90 min. |
|---|---|---|---|
| 10:30 a.m. | Additional recommendations | CDC | 90 min. |
| 12:00 p.m. | Manuscript development process | CDC | 30 min. |
| 12:30 p.m. | Adjourn |
|
Economics of Diabetes Project Panel
|
CDC Staff
| Michael M. Engelgau, M.D. |
Theodore Thompson, M.S. |
| Anne Fagot, M.D. |
Kabayam Venkat-Narayan, M.D. |
| Linda Geiss, M.A. |
Frank Vinicor, M.D. |
| Ed Gregg, Ph.D. |
David F. Williamson, Ph.D. |
| Stephen Sorensen, Ph.D. |
Abdiaziz Yassin, Ph.D. |
