On This Page
- Findings
- The Analysis
- New Data Can Help Pave the Way to Reduce Burden
- The Cost of Obesity, and Diabetes in the United States
- U.S. Rates of Physical Inactivity, Obesity, and Diabetes
- County-Level Map for Leisure-Time Physical Inactivity, 2008
- County-Level Map for Leisure-Time Physical Inactivity, Obesity and Diagnosed Diabetes, 2008
- For Additional Information
Facts About County-Level Estimates of Leisure-Time Physical Inactivity, 2008
Findings
Estimates of leisure-time physical inactivity are now available for all 3,141 counties or county equivalents, such as boroughs and parishes, in the United States.
- County-level estimates of age-adjusted rates of leisure-time physical inactivity range from 10.1% to 43.0% in the United States. These rates reflect adults who report no physical activity or exercise other than at their regular job.
- Counties on the high end and low end of leisure-time physical inactivity, after adjusting for population age differences, are listed below in alphabetical order. County rankings have great variability, and should not be used for direct comparison.
| High end (less active) Carter County, Kentucky Magoffin County, Kentucky McCreary County, Kentucky McDowell County, West Virginia Pike County, Kentucky |
Low end (more active) Boulder County, Colorado Douglas County, Colorado Eagle County, Colorado Routt County, Colorado Teton County, Wyoming |

- States that have at least 70% of their counties in the highest quartile (29.2% or greater) for leisure-time physical inactivity were Alabama, Kentucky, Louisiana, Mississippi, Oklahoma, and Tennessee.
- States that have at least 70% of their counties in the lowest quartile (23.2% or lower) for leisure-time physical inactivity were California, Colorado, Hawaii, Minnesota, Oregon, Vermont, and Washington.
- Combining county-level estimates for leisure time physical inactivity, diagnosed diabetes, and obesity for 2008 show that counties with high levels of all three conditions are primarily concentrated in the South and Appalachia, while counties with low levels of all three conditions are primarily concentrated in the Northeast and West.
The Analysis
- The estimates for leisure-time physical inactivity were derived using data from the census and the Behavioral Risk Factor Surveillance System (BRFSS) for 2007, 2008, and 2009.
- BRFSS is an ongoing, state-based, random-digit–dialed telephone survey of the U.S. civilian, non-institutionalized population aged 18 years and older. The analysis was based on self-reported data, and estimates were age-adjusted on the basis of the 2000 U.S. standard population. For more information about the methodology and ranking, see Other Data Applications, Tools and Resources at www.cdc.gov/diabetes/statistics.
New Data Can Help Pave the Way to Reduce Burden
- Physical inactivity is a risk factor for developing type 2 diabetes and obesity. These data provide additional information to help address the burden of diabetes and obesity.
- The county-level estimates help identify counties with high estimated numbers and percentages of people who are not physically active in their leisure time, and supplement existing county-level estimates available for obesity and diagnosed diabetes.
- County-level estimates of leisure-time physical inactivity, diabetes, and obesity can help maximize use of existing resources for chronic disease management and prevention efforts, including health policy.
- Combined with other resources, these data can assist in allocating funds to help areas that are high in leisure-time physical inactivity and that are hardest hit with diabetes and obesity. This focused attention may help reduce rates of complications of obesity and diabetes, such as heart disease, stroke, and some cancers, as well as specific complications of diabetes such as kidney disease, blindness, and amputations of the feet and legs.
- County-level estimates of leisure-time physical inactivity can foster public support to make physical activity an easier choice in neighborhoods. Research shows that adults are willing to take action and support policy changes that make walking and biking easier in their neighborhoods. The estimates can inform states designing policies that promote bicycling, walkable pathways, and active transportation.
- They can also inform communities as people work together to create and maintain safe neighborhoods for physical activity and improve access to parks and playgrounds.
The Cost of Obesity and Diabetes in the United States
- The medical costs of obesity were as high as
$147 billion in 2008. The average annual medical
costs for an obese person are $1,429 more than those
of a normal weight person.
- The medical costs of diabetes were $116 billion in 2007. The average medical expenditures among people with diagnosed diabetes were 2.3 times higher than what expenditures would be in the absence of diabetes.
U.S. Rates of Physical Inactivity, Obesity, and Diabetes
- In 2008, 25.4% of U.S. adults reported no leisure time physical activity.
- The proportion of U.S. adults who are obese was 33.9% in 2007-2008.
- In 2010, 11.3% of the population aged 20 years or older, or 25.6 million people, had diabetes. Of these, 7 million were undiagnosed.
County-Level Map for Leisure-Time Physical Inactivity, 2008
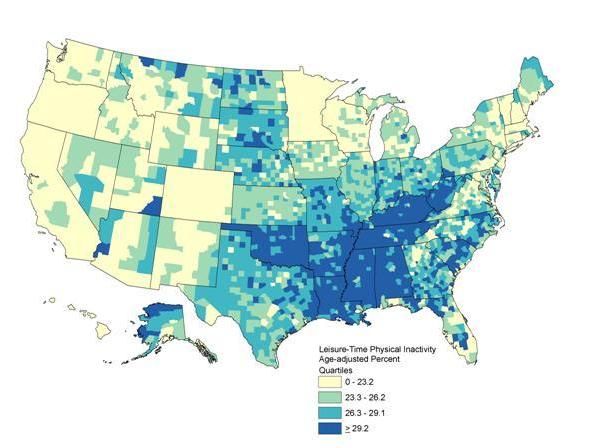
Detailed information about this map is available.
County-Level Map for Leisure-Time Physical Inactivity, Obesity, and Diagnosed Diabetes, 2008
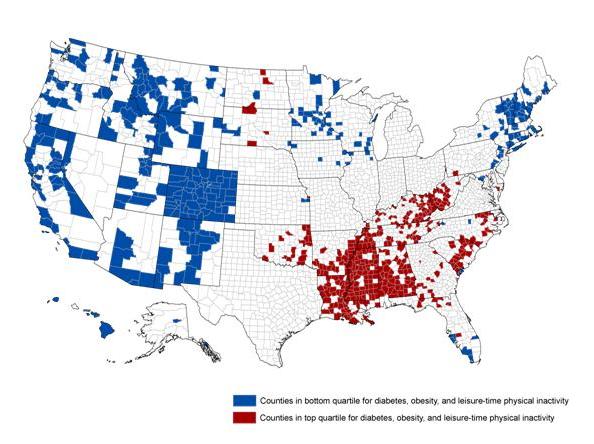
Detailed information about this map is available.
For Additional Information
To see county-level estimates of leisure-time physical inactivity, obesity, and diagnosed diabetes, visit www.cdc.gov/diabetes/statistics.
For more information on diabetes and preventing type 2 diabetes, visit www.cdc.gov/diabetes.
To learn more about CDC′s efforts in the fight against obesity or for more information about nutrition, physical activity, and maintaining a healthy weight, visit www.cdc.gov/nccdphp/dnpao.
Contact Us:
- CDC Diabetes Public Inquiries
- 800-CDC-INFO
(800-232-4636)
TTY: (888) 232-6348
8am-8pm ET
Monday-Friday
Closed Holidays - cdcinfo@cdc.gov
