Slide Presentation from the AHRQ 2010 Annual Conference
On September 28, 2010, David Grossman made this presentation at the 2010 Annual Conference. Select to access the PowerPoint® presentation (1 MB). (Plugin Software Help).
Slide 1
Screening for Obesity in Pediatric Primary Care: Recommendations from the U.S. Preventive Service Task Force
David Grossman, MD, MPH
Group Health Research Institute
Member, U.S. Preventive Services Task Force (USPSTF)
Slide 2

Disclosures
- No financial disclosures.
- Member of USPSTF.
Slide 3

Figure 1. Overweight trends among children and adolescents
Image: Line graph shows percent of overweight children and adolescents rising from around 5 percent in 1963-1965 up to 15 percent by 1999-2002 for ages 6 to 11, 12 to 19 years, and up to 10 percent for ages 2-5 years.
Source: Whitlock EP, et al. Pediatrics 2005;116:e125-e144.
Copyright ©2005 American Academy of Pediatrics.
Slide 4

Background
- 2005: USPSTF stated that there was 'insufficient evidence' to recommend screening.
- Rationale:
- Body Mass Index (BMI) effective screening tool.
- Evidence for effective interventions inadequate.
Slide 5

Definitions
- Obese: age/gender specific BMI >95th percentile.
- Overweight: age/gender specific BMI between 85th-95th percentile.
Slide 6
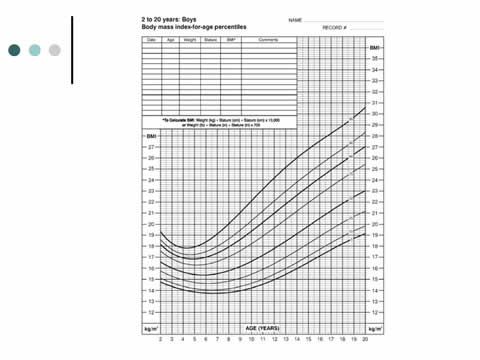
BMI-for-Age Percentiles for Boys Ages 2 to 20 Years
Image: Line graph shows BMI-for-age percentiles for boys ages 2 to 20 years rising with age.
Slide 7

Analytic Model: Child Obesity
Image: The analytic model depicts the framework for screening for obesity in children and adolescents. The diagram starts on the left with "Children or adolescents ages 2 to 18 years old identified as obese or overweight according to age-and sex-specific criteria." An arrow numbered 1 leads to the right and is captioned "Intervention." This arrow forks in three directions. The first part, numbered 2 proceeds up and to the right to a box labeled "BMI maintenance." The second part, numbered 3 curves down and points to an oval labeled "Adverse effects." The third fork proceeds to the right, to a box labeled "BMI reduction or stabilization." From there, another arrow numbered 2 proceeds to the right to the box labeled "BMI maintenance." Another arrow numbered 3 points down at the oval reading "Adverse effects." On the other side of "BMI maintenance," arrow 2 becomes a dashed line and proceeds to the final box of the diagram. The box contains three outcomes: "Decreased childhood morbidity," "Improved childhood functioning," and "Reduced adult morbidity and mortality."
Slide 8

Key Question 1
- Do weight-management programs (behavioral, pharmacologic) lead to BMI, weight, or adiposity stabilization or reduction in children and adolescents who are obese (≥95th BMI percentile) or overweight (85–94th percentile)?
- KQ1a. Do these programs lead to other positive outcomes (e.g., improved behavioral or physiologic measures, decreased childhood morbidity,improved childhood functioning, or reduced adult morbidity and mortality)?
- KQ1b. Do specific components of the programs influence the effectiveness of the programs?
- KQ1c. Are there population or environmental factors that influence the effectiveness of the programs?
Slide 9

Key Question 2
- Do weight-management programs (behavioral, pharmacologic) help children and adolescents who were initially obese or overweight maintain BMI, weight, or adiposity improvements after the completion of an active intervention?
- KQ2a. Do these programs lead to other positive outcomes (e.g., improved behavioral or physiologic measures, decreased childhood morbidity, improved childhood functioning, or reduced adult morbidity and mortality)?
- KQ2b. Do specific components of the programs influence the effectiveness of the programs?
- KQ2c. Are there population or environmental factors that influence the effectiveness of the programs?
Slide 10

Key Question 3
- What are the adverse effects of weight-management programs (behavioral, pharmacologic) attempting to stabilize, reduce, or maintain BMI?
Slide 11

Methods
- Systematic literature review conducted by Oregon Evidence-based Practice Center.
- 2786 abstracts and 369 articles reviewed.
- Behavioral interventions classified by 'intensity'.
- Meta-analyses conducted for short-term and maintenance outcomes.
- Primary outcome was BMI change.
Slide 12
Methods
- USPSTF team assisted with development of analytic model, review scope and resolution of methodologic issues.
- Evidence synthesis reviewed by 8 external peer-reviewers.
Slide 13
Findings: Behavioral interventions
- New information available.
- 11 fair/good quality trials:
- Only 2 were available during last review.
- Study participants: BMI >95th percentile.
- High degree of consistency of direction of benefit in behavioral trials.
- Magnitude of effect varied by intensity.
Slide 14
Content of Behavioral Intervention
- All but 3 were comprehensive.
- Dietary weight loss counseling.
- Physical activity counseling.
- Behavioral modification techniques.
- Many involved families.
Slide 15

Figure 3. Pooled analysis: short-term weight change effect size (ES) of behavioral interventions (KQ1)
Image: A table compares studies analyzing short-term changes in weight in children after behavioral interventions.
Source: Whitlock EP, et al. Pediatrics 2010;125:e396-e418.
Copyright ©2010 American Academy of Pediatrics.
Slide 16

Other Outcomes
- Lipids decreased.
- Blood pressure decreased.
- Glucose/insulin decreased.
- Psychosocial measures were insufficient
- Clinical significance unknown
(n=7 trials)
Slide 17

| Level Care |
Time (hr) |
Prim |
| 1. Very low |
<10 |
Yes |
| 2. Low |
10-25 |
Yes |
| 3. Medium |
26-75 |
? |
| 4. High |
>75 |
No |
Slide 18

Combined Behavioral and Pharmacologic Studies
- 7 trials fair/good quality (total N=1294):
- (Sibutramine or orlistat) + counseling.
- Age 12-19 years.
- >95th percentile BMI.
- 6/7 funded by industry.
- Variable trial sizes; all showed BMI reductions.
- Two largest trials showed significant reductions (Δ BMI 0.85-2.6).
- Poor evidence that weight loss maintained after stopping medication.
Slide 19
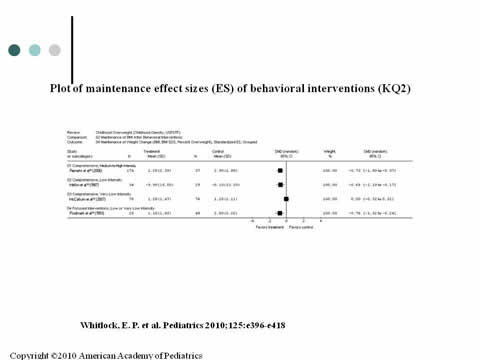
Plot of maintenance effect sizes (ES) of behavioral interventions (KQ2)
Image: A table compares studies analyzing maintenance of weight change in children after behavioral interventions.
Source: Whitlock EP, et al. Pediatrics 2010;125:e396-e418.
Copyright ©2010 American Academy of Pediatrics.
Slide 20

Harms
- Few serious adverse effects.
- Exercise injury (small).
- Sibutramine (small):
- Increased heart rate.
- Blood pressure rise.
- Orlistat (small):
- Gastrointestinal side effects common:
- 20%-30% spotting, abdominal pain, urgency.
- 6/13 behavioral trials reporting.
- 5/7 combined trials reporting.
Slide 21
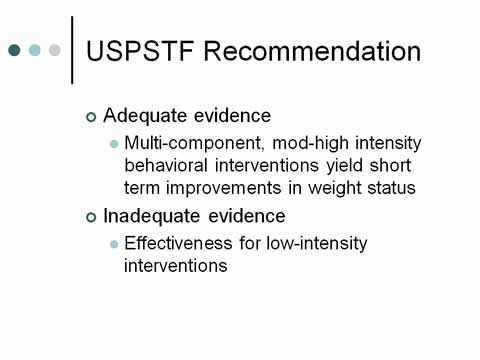
USPSTF Recommendation
- Adequate evidence:
- Multi-component, moderate-to-high-intensity behavioral interventions yield short term improvements in weight status.
- Inadequate evidence:
- Effectiveness for low-intensity interventions.
Slide 22

Harms
- Adequate evidence that harms are no greater than small.
Slide 23

Net benefit
Moderate benefit –
very small harms
= moderate net benefit.
Level of Certainty: Moderate.
Slide 24

Recommendation Grade Formula
| Certainty of Net Benefit |
Magnitude of Net Benefit
(Benefit Minus Harms) |
| Substantial |
Moderate |
Small |
Zero/Negative |
| High |
A |
B |
C |
D |
| Moderate |
B |
B |
C |
D |
| Low |
I Statement |
| Do: |
A & B: recommend routinely |
| Depends: |
C: recommend individual decision |
| Don't do |
D: recommend against |
| Don't know |
I statement: insufficient evidence |
Slide 25

Clinical Considerations
- BMI chart acceptable measure for screening.
- Applies to:
- Children and teens ages 6-18 years.
- Obese children but not overweight.
- Long-term outcomes unknown.
- Most interventions in referral settings.
Slide 26

Clinical Considerations
- Medications:
- Harms data based on small numbers.
- Effects may be limited to duration of use.
- Approved for ages:
- Orlistat: ≥12 years.
- Sibutramine: ≥16 years.
Slide 27

Clinical Considerations
- Screening intervals.
- Research needs and gaps:
- Which components of multi-component interventions work?
- Long-term follow-up needed for benefits and harms.
- Primary care based interventions.
- Interventions for young children.
Slide 28

Dissemination
- From recommendations to practice.
- HEDIS measure:
- Use of electronic medical record tools to promote screening.
- Need for behavioral intervention programs.
Slide 29

Questions?
Email: grossman.d@ghc.org
Current as of April 2012
Internet Citation:
Screening for Obesity in Pediatric Primary Care: Recommendations from the U.S. Preventive Service Task Force. Slide Presentation from the AHRQ 2010 Annual Conference (Text Version). April 2012.
Agency for Healthcare Research and Quality, Rockville, MD. http://www.ahrq.gov/about/annualconf10/grossman/grossman.htm


 540 Gaither Road Rockville, MD 20950