< This page uses javascripts, but your browser is not currently supporting java
scripts. Please turn ON scripting in your web browser.
Skip
To Content
2004
National Survey on Drug Use & Health: Results
Results from the 2004 National
Survey on Drug Use and Health: National Findings
REVISIONS AS OF 9/8/2005
NOTE: Several updates have been
incorporated into this report since it was published. These changes were made
in the Web documents and are listed below, indicating the relevant page and
paragraph in the published version.
In several places, the published version of this
report indicates that 2004 estimates are similar to 2002 estimates. However,
statistical testing indicates a significant difference between 2004 and 2002,
so the text in this updated Web document was revised to remove the reference
to no change from the 2002 data. This occurs on the following pages in the published
report: page 1 in bullets 3 and 6; page 12 in bullets 1 and 2; page 30
in bullet 3; and page 61 in bullet 1 under Feelings about Peer Substance Use.
In addition, the following changes were also made in the web document, with
the relevant page in the published version indicated:
On page 35: bullet 1 was changed to correct the
statement; there was only one exception (not two) to the stable trend.
On page 69: in bullet 2 the estimate for persons
who drank before age 21 was changed from 9.2 to 9.6.
On page 161: in the definition of Ecstasy
Use, the spelling of "methylenedioxymethamphetamine" was corrected.
DEPARTMENT OF HEALTH AND HUMAN
SERVICES
Substance Abuse and Mental Health Services Administration
Office of Applied Studies
Acknowledgments
This report was prepared by the Division of Population
Surveys, Office of Applied Studies, SAMHSA, and by RTI International, a trade
name of Research Triangle Institute, Research Triangle Park, North Carolina.
Work by RTI was performed under Contract No. 283-03-9028. Contributors
and reviewers at RTI listed alphabetically include Jeremy Aldworth, Katherine
R. Bowman, Walter R. Boyle, Allison Burns, Sara L. Calvin, Jessica Duncan Cance,
Patrick Chen, James R. Chromy, Andrew Clarke, Elizabeth Copello, David B. Cunningham,
Teresa R. Davis, Steven L. Emrich, Ralph E. Folsom, Jr., Misty Foster, G. G.
Frick, Eric A. Grau, David C. Heller, Erica Hirsch, Susan Hunter, B. Kathleen
Jordan, Larry A. Kroutil, Judith T. Lessler, Bing Liu, Mary Ellen Marsden, Peilan
Martin, Breda Munoz, Christine Murtha, Scott Novak, Lisa E. Packer, Michael
R. Pemberton, Lanny Piper, Jeremy Porter, Tania Robbins, Kathryn Spagnola, Thomas
G. Virag (Project Director), Michael Vorburger, Jill Webster, Matthew Westlake,
and Li-Tzy Wu. Contributors at SAMHSA listed alphabetically, with chapter authorship
noted, include Peggy Barker (Chapter 8),
James Colliver (Chapters 4 and 6),
Joan Epstein (Chapters 7 and 8),
Joseph Gfroerer (Chapters 1, 2,
5, and 9),
Joe Gustin, Arthur Hughes (Project Officer), Joel Kennet (Chapter 3),
Sharon Larson (Chapters 7 and 8),
Pradip Muhuri, Dicy Painter, and Doug Wright (Chapter 6).
At RTI, Richard S. Straw edited the report with assistance from Jason Guder
and Claudia Clark. Also at RTI, Diane G. Eckard and Danny Occoquan prepared
the graphics; Brenda K. Porter and Tracy Woodall formatted the tables; Joyce
Clay-Brooks, Debbie Bond, and Judy Cannada formatted and word processed the
report; and Pamela Couch Prevatt, Teresa F. Gurley, Kim Cone, David Belton,
and Shari B. Lambert prepared its press and Web versions. Final report production
was provided by Beatrice A. Rouse, Coleen Sanderson, and Jane Feldmann at SAMHSA.
Public Domain Notice
All material appearing in this report is in the
public domain and may be reproduced or copied without permission from the Substance
Abuse and Mental Health Services Administration. However, this publication may
not be reproduced or distributed for a fee without specific, written
authorization of the Office of Communications, SAMHSA, U.S. Department of Health
and Human Services. Citation of the source is appreciated. Suggested citation:
Substance Abuse and Mental Health Services
Administration. (2005). Results from the 2004 National Survey on Drug Use
and Health: National Findings (Office of Applied Studies, NSDUH Series
H-28, DHHS Publication No. SMA 05-4062). Rockville, MD.
2004
National Survey on Drug Use & Health: Results
Table of Contents
Note: We recommend that the PDF
format of this report be used for printing the contents of this report.
If comparing the web version to the published
hard copy, please note that several updates have been incorporated into the
web version since the report was published; click
here for the note regarding the updates.
This report presents the first information from
the 2004 National Survey on Drug Use and Health (NSDUH). This survey, formerly
called the National Household Survey on Drug Abuse (NHSDA), is a project of
the Substance Abuse and Mental Health Services Administration (SAMHSA). This
survey was initiated in 1971 and is the primary source of information on the
use of illicit drugs, alcohol, and tobacco by the civilian, noninstitutionalized
population of the United States aged 12 years old or older. The survey interviews
approximately 67,500 persons each year.
Illicit Drug Use
In 2004, 19.1 million Americans, or 7.9 percent
of the population aged 12 or older, were current illicit drug users. Current
drug use means use of an illicit drug during the month prior to the survey
interview.
The rate of illicit drug use among persons
aged 12 or older in 2004 was similar to the rates in 2002 and 2003 (8.3 and
8.2 percent). Among youths aged 12 to 17, the rate declined between 2002 and
2004 (11.6 percent in 2002, 11.2 percent in 2003, and 10.6 percent in 2004).
Marijuana was the most commonly used illicit
drug in 2004, with a rate of 6.1 percent (14.6 million current users). There
were 2.0 million current cocaine users, 467,000 of whom used crack. Hallucinogens
were used by 929,000 persons, and there were an estimated 166,000 heroin users.
All of these estimates are similar to estimates for 2003.
Between 2002 and 2004, past month marijuana
use declined for male youths aged 12 to 17 (9.1 percent in 2002, 8.6 percent
in 2003, and 8.1 percent in 2004), but it remained level for female youths
(7.2, 7.2, and 7.1 percent, respectively) during the same time span.
The number of current users of Ecstasy had
decreased between 2002 and 2003, from 676,000 to 470,000, but the number did
not change between 2003 and 2004 (450,000).
In 2004, 6.0 million persons were current
users of psychotherapeutic drugs taken nonmedically (2.5 percent). These include
4.4 million who used pain relievers, 1.6 million who used tranquilizers, 1.2
million who used stimulants, and 0.3 million who used sedatives. These estimates
are all similar to the corresponding estimates for 2003.
There were significant increases in the lifetime
prevalence of use from 2003 to 2004 in several categories of pain relievers
among those aged 18 to 25. Specific pain relievers with statistically significant
increases in lifetime use were Vicodin®, Lortab®,
or Lorcet® (from 15.0 to 16.5 percent); Percocet®,
Percodan®, or Tylox® (from 7.8 to 8.7 percent);
hydrocodone products (from 16.3 to 17.4 percent); OxyContin®
(from 3.6 to 4.3 percent); and oxycodone products (from 8.9 to 10.1 percent).
Among youths aged 12 to 17, rates of current
illicit drug use varied significantly by major racial/ethnic groups in 2004.
The rate was highest among American Indian or Alaska Native youths (26.0 percent).
Rates were 12.2 percent for youths reporting two or more races, 11.1 percent
for white youths, 10.2 percent for Hispanic youths, 9.3 percent for black
youths, and 6.0 percent for Asian youths.
In 2004, 19.2 percent of unemployed adults
aged 18 or older were current illicit drug users compared with 8.0 percent
of those employed full time and 10.3 percent of those employed part time.
However, of the 16.4 million illicit drug users aged 18 or older in 2004,
12.3 million (75.2 percent) were employed either full or part time.
Alcohol Use
121 million Americans aged 12 or older were
current drinkers of alcohol in 2004 (50.3 percent). 55 million (22.8 percent)
participated in binge drinking, defined as five or more drinks on at least
one occasion in the 30 days prior to the survey. 16.7 million (6.9 percent)
were heavy drinkers, defined as binge drinking on 5 or more days in the past
month. These numbers are all similar to the corresponding estimates for 2002
and 2003.
The highest prevalence of binge and heavy
drinking in 2004 was for young adults aged 18 to 25 (41.2 and 15.1 percent,
respectively). The peak rate of both measures occurred at age 21 (48.2 and
19.2 percent, respectively).
The rate of underage drinking remained the
same in 2004 as in 2002 and 2003. About 10.8 million persons aged 12 to 20
reported drinking alcohol in the month prior to the survey interview in 2004
(28.7 percent of this age group). Of these, nearly 7.4 million (19.6 percent)
were binge drinkers, and 2.4 million (6.3 percent) were heavy drinkers.
Among persons aged 12 to 20 in 2004, past
month alcohol use rates were 16.4 percent among Asians, 19.1 percent among
blacks, 24.3 percent among American Indians or Alaska Natives, 26.4 percent
among those reporting two or more races, 26.6 percent among Hispanics, and
32.6 percent among whites.
Among pregnant women aged 15 to 44, 11.2 percent
reported past month alcohol use and 4.5 percent reported past month binge
drinking, based on combined 2003 and 2004 data.
32.5 million persons aged 12 or older in 2004
(13.5 percent) drove under the influence of alcohol at least once in the 12
months prior to the interview. This was similar to the rate in 2003.
Young adults aged 18 to 22 enrolled full time
in college were more likely than their peers not enrolled full time (this
category includes part-time college students and persons not enrolled in college)
to use alcohol, binge drink, and drink heavily in 2004. Binge and heavy use
rates for college students were 43.4 and 18.6 percent, respectively, compared
with 39.4 and 13.5 percent, respectively, for other persons aged 18 to 22.
Tobacco Use
70.3 million Americans were current users
of a tobacco product in 2004. This is 29.2 percent of the population aged
12 or older. 59.9 million (24.9 percent) smoked cigarettes, 13.7 million (5.7
percent) smoked cigars, 7.2 million (3.0 percent) used smokeless tobacco,
and 1.8 million (0.8 percent) smoked tobacco in pipes.
The rate of tobacco use declined between 2002
and 2004, from 30.4 to 29.2 percent, primarily due to a decline in cigarette
use from 26.0 to 24.9 percent. The rate of cigar use remained steady, but
smokeless tobacco use dropped from 3.3 to 3.0 percent.
Young adults aged 18 to 25 continued to have
the highest rate of past month cigarette use (39.5 percent). The rate did
not change significantly between 2002 and 2004. The rate of cigarette use
among youths aged 12 to 17 declined from 13.0 percent in 2002 to 11.9 percent
in 2004.
A higher proportion of males than females
aged 12 or older smoked cigarettes in 2004 (27.7 vs. 22.3 percent). Among
youths aged 12 to 17, however, girls (12.5 percent) were more likely than
boys (11.3 percent) to smoke.
Based on 2003 and 2004 data combined, 18.0
percent of pregnant women aged 15 to 44 smoked cigarettes in the past month
compared with 30.0 percent of women in that age group who were not pregnant.
However, among those aged 15 to 17, this pattern did not hold. The rate of
cigarette smoking among pregnant women aged 15 to 17 was 26.0 percent compared
with 19.6 percent among nonpregnant women of that age (not a statistically
significant difference).
In completely rural nonmetropolitan counties,
current cigarette use among persons aged 12 or older declined from 31.8 percent
in 2002 to 22.8 percent in 2004.
Among the 93.4 million persons who had ever
smoked cigarettes daily in their lifetime, nearly half (46.2 percent) had
stopped smoking in 2004; that is, they did not smoke at all in the past 30
days. The remaining 53.8 percent were still current smokers.
Initiation of Substance Use (Incidence)
Based on a new approach to estimating incidence,
the 2004 NSDUH shows that the illicit drug category with the largest number
of new users was nonmedical use of pain relievers. 2.4 million persons used
pain relievers nonmedically for the first time within the past 12 months.
The average age at first use among these new initiates was 23.3 years.
In 2004, 2.1 million persons had used marijuana
for the first time within the past 12 months. This estimate was not significantly
different from the number in 2003 (2.0 million). The average age at first
use among the 2.1 million recent marijuana initiates was 18.0 years. Most
(63.8 percent) of the recent initiates were younger than age 18 when they
first used.
In 2004, 4.4 million persons had used alcohol
for the first time within the past 12 months. The number of alcohol initiates
increased from 3.9 million in 2002 and 4.1 million in 2003. Most (86.9 percent)
of the 4.4 million recent alcohol initiates in 2004 were younger than age
21 at the time of initiation.
The number of persons who smoked cigarettes
for the first time within the past 12 months was 2.1 million in 2004, not
significantly different from the estimates in 2002 (1.9 million) or 2003 (2.0
million). About two thirds of new smokers in 2004 were under the age of 18
when they first smoked cigarettes (67.8 percent).
Youth Prevention-Related Measures
The percentage of youths aged 12 to 17 indicating
that smoking marijuana once a month was a great risk increased from 32.4 percent
in 2002 to 34.9 percent in 2003, but did not change between 2003 and 2004
(35.0 percent). There were declines between 2003 and 2004 in the percentages
of youths perceiving a great risk in using cocaine and heroin. Perceived risk
of cigarette use increased between 2003 and 2004, but there was no change
in the perceived risk of having four or five drinks of alcohol nearly every
day or having five or more drinks once or twice a week.
The percentage of youths reporting that it
would be easy to obtain marijuana declined between 2002 and 2003, from 55.0
to 53.6 percent, and again between 2003 and 2004, to 52.2 percent. The percentage
of youths reporting that LSD would be easy to obtain also decreased between
2002 and 2004, from 19.4 to 16.9 percent, as did the perceived availability
of heroin (15.8 to 14.0 percent).
Most youths (89.8 percent) reported that their
parents would strongly disapprove of their trying marijuana or hashish once
or twice. Among these youths, only 5.1 percent had used marijuana in the past
month. However, among youths who perceived that their parents would only somewhat
disapprove or neither approve nor disapprove of their trying marijuana, 30.0
percent used marijuana.
Substance Dependence, Abuse, and Treatment
22.5 million Americans aged 12 or older in
2004 were classified with past year substance dependence or abuse (9.4 percent
of the population), about the same number as in 2002 and 2003. Of these, 3.4
million were classified with dependence on or abuse of both alcohol and illicit
drugs, 3.9 million were dependent on or abused illicit drugs but not alcohol,
and 15.2 million were dependent on or abused alcohol but not illicit drugs.
In 2004, 19.9 percent of unemployed adults
aged 18 or older were classified with dependence or abuse, while 10.5 percent
of full-time employed adults and 11.9 percent of part-time employed adults
were classified as such. However, most adults with substance dependence or
abuse were employed either full or part time. Of the 20.3 million adults classified
with dependence or abuse, 15.7 million (77.6 percent) were employed.
In 2004, 3.8 million people aged 12 or older
(1.6 percent of the population) received treatment in the past 12 months for
a drug or alcohol use problem. Of these, 2.3 million received treatment at
a specialty facility for substance use treatment, including 1.7 million at
a rehabilitation facility as an outpatient, 947,000 at a rehabilitation facility
as an inpatient, 775,000 at a hospital as an inpatient, and 982,000 at a mental
health center as an outpatient. Nonspecialty treatment locations were self-help
groups (2.1 million persons), private doctor's offices (490,000 persons),
emergency rooms (453,000 persons), and prisons or jails (310,000 persons).
(Note that the estimates of treatment by location include persons reporting
more than one location.)
Persons dependent on or abusing a substance
in the past 12 months, or who received specialty treatment for a substance
use problem within the past 12 months, are classified as needing treatment.
In 2004, the number of persons aged 12 or older needing treatment for an alcohol
or illicit drug use problem was 23.48 million (9.8 percent). Of these, 2.33
million received treatment at a specialty facility in the past year. Thus,
21.15 million people needed but did not receive treatment at a specialty facility
in 2004. The number needing but not receiving treatment did not change significantly
from 2002 to 2004.
Of the 21.1 million people who needed but
did not receive treatment in 2004, an estimated 1.2 million (5.8 percent)
reported that they felt they needed treatment for their alcohol or drug use
problem. Of the 1.2 million persons who felt they needed treatment, 441,000
(35.8 percent) reported that they made an effort but were unable to get treatment,
and 792,000 (64.2 percent) reported making no effort to get treatment.
Among people who needed but did not receive
treatment and felt they needed treatment for a substance use problem, the
most often reported reasons for not receiving treatment were not ready to
stop using (40.0 percent) and cost or insurance barriers (34.5 percent). However,
among the people who made an effort but were unable to get treatment, 42.5
percent reported cost or insurance barriers, and only 25.3 percent reported
that they were not ready to stop using. These results are based on 2003 and
2004 combined data.
The number of persons needing treatment for
an illicit drug use problem in 2004 (8.1 million) was higher than the number
needing treatment in 2003 (7.3 million); similarly, the number of persons
receiving treatment for drug use at a specialty facility was higher in 2004
(1.4 million) than in 2003 (1.1 million). These 2004 estimates were similar
to the corresponding estimates in 2002 (7.7 million needing treatment, 1.4
million receiving treatment).
6.6 million people needed but did not receive
treatment for an illicit drug use problem in 2004. Of these, 598,000 (9.0
percent) felt they needed treatment. This number increased from 362,000 in
2002 and from 426,000 in 2003. Of the 598,000 persons who felt they needed
treatment in 2004, 194,000 (32.4 percent) reported that they made an effort
but were unable to get treatment, and 404,000 (67.6 percent) reported making
no effort to get treatment.
Prevalence and Treatment of Mental Health
Problems
In 2004, there were 35.1 million (14.7 percent)
persons aged 12 or older who had at least one major depressive episode (MDE)
in their lifetime. Of these, 19.3 million persons (8.1 percent of the population)
had an MDE in the past 12 months, including 2.2 million youths aged 12 to
17 and 17.1 million adults aged 18 or older.
The past year prevalence of MDE was highest
for persons aged 18 to 25 (10.1 percent) and lowest for those aged 26 or older
(7.6 percent). The rate among youths aged 12 to 17 was 9.0 percent. Females
were more likely than males to have MDE in the past year (10.6 vs. 5.5 percent).
Persons with past year MDE were more likely
than those without MDE to have used an illicit drug in the past year (28.8
vs. 13.8 percent). Similarly, substance dependence or abuse was more prevalent
among persons with MDE than among those without MDE (22.0 vs. 8.6 percent,
respectively).
Among persons aged 12 or older with past year
MDE, 62.3 percent received treatment (i.e., saw or talked to a medical doctor
or other professional or used prescription medication) for depression within
the past 12 months.
While MDE estimates describe persons with
a specific mental disorder, the survey also produces estimates of serious
psychological distress (SPD), which describe persons with a high level of
distress due to any type of mental problem. In 2004, there were 21.4 million
adults aged 18 or older with SPD. This represents 9.9 percent of all adults,
a rate that increased since 2002 when it was 8.3 percent.
SPD was highly correlated with substance dependence
or abuse. Among adults with SPD in 2004, 21.3 percent (4.6 million) were dependent
on or abused alcohol or illicit drugs, while the rate among adults without
SPD was 7.9 percent.
Among the 21.4 million adults with SPD in
2004, 10.3 million, or 48.1 percent, received treatment for a mental health
problem in the past year.
Among the 4.6 million adults with SPD and
a substance use disorder in 2004, 47.5 percent (about 2.2 million) received
treatment for mental health problems, and 11.0 percent (503,000) received
specialty substance use treatment. Only 6.0 percent (274,000) received both
types of treatment.
In 2004, 27.5 million adults (12.8 percent)
received treatment for mental health problems in the past year. This estimate
is similar to the estimates in 2002 and 2003.
The most prevalent type of treatment for mental
health problems among adults in 2004 was prescription medication (10.5 percent
of the population), followed by outpatient treatment (7.1 percent). 1.9 million
adults (0.9 percent) received inpatient care for mental health problems at
some time within the past 12 months.
In 2004, 5.7 million youths aged 12 to 17
(22.5 percent) received treatment or counseling for emotional or behavior
problems in the year prior to the interview. This is higher than the estimates
for 2002 (19.3 percent) and 2003 (20.6 percent).
1. Introduction
This report presents the first information from
the 2004 National Survey on Drug Use and Health (NSDUH), an annual survey of
the civilian, noninstitutionalized population of the United States aged 12 years
old or older. Prior to 2002, the survey was called the National Household Survey
on Drug Abuse (NHSDA). This initial report on the 2004 data presents national
estimates of rates of use, numbers of users, and other measures related to illicit
drugs, alcohol, and tobacco products. Measures related to mental health problems
also are presented, including data on the co-occurrence of substance use and
mental health problems, and new data on depression among youths and adults.
State-level and SubState-level estimates from NSDUH will be presented in separate
reports.
A major focus of this report is changes in substance
use between 2003 and 2004. Trends since 2002 also are discussed in a few instances.
Because of improvements to the survey in 2002, the 2002 data constitute a new
baseline for tracking trends in substance use and other measures. Therefore,
estimates from the 2002, 2003, and 2004 NSDUHs should not be compared with estimates
from the 2001 and earlier NSDUHs to assess changes in substance use and mental
health problems over time. A discussion of long-term trends is included in the
final chapter of this report.
1.1. Summary of NSDUH
NSDUH is the primary source of statistical information
on the use of illegal drugs by the U.S. population. Conducted by the Federal
Government since 1971, the survey collects data by administering questionnaires
to a representative sample of the population through face-to-face interviews
at their places of residence. The survey is sponsored by the Substance Abuse
and Mental Health Services Administration (SAMHSA) of the U.S. Department of
Health and Human Services and is planned and managed by SAMHSA's Office of Applied
Studies (OAS). Data collection is conducted under contract with RTI International,
Research Triangle Park, North Carolina.1
This section briefly describes the survey methodology; a more complete description
is provided in Appendix A.
NSDUH collects information from residents of
households, noninstitutional group quarters (e.g., shelters, rooming houses,
dormitories), and civilians living on military bases. The survey does not include
homeless persons who do not use shelters, military personnel on active duty,
and residents of institutional group quarters, such as jails and hospitals.
Appendix E describes surveys that
cover populations outside the NSDUH target population.
Since 1999, the NSDUH interview has been carried
out using computer-assisted interviewing (CAI). Most of the questions are administered
with audio computer-assisted self-interviewing (ACASI). ACASI is designed to
provide the respondent with a highly private and confidential means of responding
to questions to increase the level of honest reporting of illicit drug use and
other sensitive behaviors. Less sensitive items are administered by interviewers
using computer-assisted personal interviewing (CAPI).
Consistent with the 2002 and 2003 surveys, the
2004 NSDUH employed a 50-State sample design with an independent, multistage
area probability sample for each of the 50 States and the District of Columbia.
The eight States with the largest population (which together account for 48
percent of the total U.S. population aged 12 or older) were designated as large
sample States (California, Florida, Illinois, Michigan, New York, Ohio, Pennsylvania,
and Texas). For these States, the design provided a sample sufficient to support
direct State estimates. For the remaining 42 States and the District of Columbia,
smaller, but adequate, samples were selected to support State estimates using
small area estimation (SAE) techniques. The design also oversampled youths and
young adults, so that each State's sample was approximately equally distributed
among three major age groups: 12 to 17 years, 18 to 25 years, and 26 years or
older.
Nationally, 130,130 addresses were screened for
the 2004 survey, and 67,760 completed interviews were obtained. The survey was
conducted from January through December 2004. Weighted response rates for household
screening and for interviewing were 90.9 and 77.0 percent, respectively. See
Appendix B for more information
on NSDUH response rates.
1.2. Trend Measurement
Although the design of the 2002, 2003, and 2004
NSDUHs is similar to the design of the 1999 through 2001 surveys, there are
important methodological differences that have an impact on the comparability
of the 2002-2004 estimates with estimates from prior surveys. In addition
to the name change, each NSDUH respondent is now given an incentive payment
of $30. These changes, both implemented in 2002 and continued in 2003 and 2004,
resulted in a substantial improvement in the survey response rate. The changes
also affected respondents' reporting of many critical items that are the basis
of prevalence measures reported by the survey each year. Comparability also
could be affected by improved data collection quality control procedures that
were introduced beginning in 2001 and by incorporation of new population data
from the 2000 decennial census into NSDUH sample weighting procedures. Analyses
of the effects of each of these factors on NSDUH estimates have shown that 2002
and later data should not be compared with 2001 and earlier data from the survey
series to assess changes over time. Appendix C of
this report discusses this issue in more detail.
Limited trend assessment can be done using information
on prior substance use collected in the 2002-2004 NSDUHs. Specifically,
questions on age at first use of substances, in conjunction with respondents'
ages and interview dates, provide data that can be used to estimate the rates
of first-time use (incidence) for years prior to 2002. Trends for 1965 to 2003
in these incidence measures for youths and young adults are discussed in Chapter 5.
However, these estimates are interpreted cautiously because they may be subject
to significant bias due to long recall periods (Gfroerer, Hughes, Chromy, Heller,
& Packer, 2004). Improved measures of recent patterns and trends in substance
use initiation are included in Chapter 5
of this report. Long-term trends in some key measures of substance use, such
as marijuana and cocaine, are assessed in Chapter 9
using data from prior NSDUHs by separately examining trends within periods during
which the survey data are comparable. These periods are 1971-1998, 1999-2001,
and 2002-2004.
1.3. Format of Report and Explanation of Tables
The results from the 2004 NSDUH are given in
this report, which has separate chapters that discuss the national findings
on seven topics: use of illicit drugs; use of alcohol; use of tobacco products;
trends in initiation of substance use; prevention-related issues; substance
dependence, abuse, and treatment; and mental health. A final chapter summarizes
the results and discusses key findings in relation to other research and survey
results, including trends prior to 2002. Technical appendices describe the survey
(Appendix A), provide technical
details on the statistical methods and measurement (Appendix B),
discuss issues related to the methods changes in 2002 (Appendix C),
offer key NSDUH definitions (Appendix D),
discuss other sources of related data (Appendix E),
list the references cited in the report (as well as other relevant references)
(Appendix F), and present selected
tabulations of estimates (Appendices G
and H).
Tables, text, and figures present prevalence
measures for the population in terms of both the number of substance users and
the rate of use for illicit drugs, alcohol, and tobacco products. Tables show
estimates of drug use prevalence by lifetime (i.e., ever used), past year, and
past month use. Analyses focus primarily on past month use, which also is referred
to as "current use." Tables and figures have footnotes indicating
whether the 2003 and 2004 estimates were significantly different; in addition,
figures have footnotes indicating whether the 2002 and 2004 estimates were significantly
different.
Data are presented for racial/ethnic groups in
several categorizations, based on current standards for collecting and reporting
race and ethnicity data (Office of Management and Budget [OMB], 1997) and on
the level of detail permitted by the sample. Because respondents were allowed
to choose more than one racial group, a "two or more races" category
is presented that includes persons who reported more than one category among
the seven basic groups listed in the survey question (white, black/African American,
American Indian or Alaska Native, Native Hawaiian, Other Pacific Islander, Asian,
Other). It should be noted that, except for the "Hispanic or Latino"
group, the racial/ethnic groups discussed in this report include only non-Hispanics.
The category "Hispanic or Latino" includes Hispanics of any race.
Also, more detailed categories describing specific subgroups were obtained from
survey respondents if they reported either Asian race or Hispanic ethnicity.
Data on Native Hawaiians and Other Pacific Islanders are combined in this report.
Data also are presented for four U.S. geographic
regions and nine geographic divisions within these regions. These regions and
divisions, defined by the U.S. Bureau of the Census, consist of the following
groups of States:
Northeast Region
- New England Division: Connecticut, Maine, Massachusetts, New Hampshire,
Rhode Island, Vermont; Middle Atlantic Division: New Jersey, New York,
Pennsylvania.
Midwest Region - East North Central Division: Illinois,
Indiana, Michigan, Ohio, Wisconsin; West North Central Division: Iowa,
Kansas, Minnesota, Missouri, Nebraska, North Dakota, South Dakota.
South Region - South Atlantic Division: Delaware,
District of Columbia, Florida, Georgia, Maryland, North Carolina, South Carolina,
Virginia, West Virginia; East South Central Division: Alabama, Kentucky,
Mississippi, Tennessee; West South Central Division: Arkansas, Louisiana,
Oklahoma, Texas.
West Region - Mountain Division: Arizona, Colorado,
Idaho, Montana, Nevada, New Mexico, Utah, Wyoming; Pacific Division:
Alaska, California, Hawaii, Oregon, Washington.
Geographic comparisons for 2003 and 2004 also
are made based on county type, which reflects different levels of urbanicity
and metropolitan area inclusion of counties, based on metropolitan area definitions
issued by OMB in June 2003 (OMB, 2003). For this purpose, counties are grouped
based on the 2003 rural-urban continuum codes. These codes were originally developed
by the U.S. Department of Agriculture (Butler & Beale, 1994). Each county
is either inside or outside a metropolitan statistical area (MSA), as defined
by the OMB.
Large metropolitan areas have a population of
1 million or more. Small metropolitan areas have a population of fewer than
1 million. Small metropolitan areas are further classified based on whether
they have a population of 250,000 or more. Nonmetropolitan areas are areas outside
MSAs. Counties in nonmetropolitan areas are further classified based on the
number of people in the county who live in an urbanized area, as defined by
the Census Bureau at the subcounty level. "Urbanized" counties have
20,000 or more population in urbanized areas, "less urbanized" counties
have at least 2,500 but fewer than 20,000 population in urbanized areas, and
"completely rural" counties have fewer than 2,500 population in urbanized
areas.
1.4. Other NSDUH Reports and Data
This report provides a comprehensive summary
of the 2004 NSDUH, including results, technical appendices, and selected data
tables. A companion report, Overview of Findings from the 2004 National
Survey on Drug Use and Health, is a shorter, more concise report that highlights
the most important findings of the survey and includes only a brief discussion
of the methods. A report on State-level estimates for 2004 will be available
in early 2006.
In addition to the tables included in Appendices G
and H of this report, a more extensive
set of tables, including standard errors, is available upon request from OAS
or through the Internet at http://www.oas.samhsa.gov.
Tables included in Appendices G
and H can be mapped back to the more
extensive set of tables by using the table number in parentheses in the upper
left corner of each table (e.g., Table G.1
in Appendix G is Table 8.1N in
the detailed tables). Additional methodological information on NSDUH, including
the questionnaire, is available electronically at the same Web address. Brief
descriptive reports and in-depth analytic reports focusing on specific issues
or population groups also are produced by OAS. A complete listing of previously
published reports from NSDUH and other data sources is available from OAS. Most
of these reports also are available through the Internet (http://www.oas.samhsa.gov).
In addition, OAS makes public use data files available to researchers through
the Substance Abuse and Mental Health Data Archive (SAMHDA, 2005) at http://www.icpsr.umich.edu/SAMHDA/index.html.
Currently, files are available from the 1979 to 2003 surveys. The 2004 NSDUH
public use file will be available by the end of 2005.
2. Illicit Drug Use
The National Survey on Drug Use and Health (NSDUH)
obtains information on nine different categories of illicit drug use: any use
of marijuana, cocaine, heroin, hallucinogens, and inhalants; and the nonmedical
use of prescription-type pain relievers, tranquilizers, stimulants, and sedatives.
In these categories, hashish is included with marijuana, and crack is considered
a form of cocaine. Several drugs are grouped under the hallucinogens category,
including LSD, PCP, peyote, mescaline, mushrooms, and "Ecstasy" (MDMA).
Inhalants include a variety of substances, such as amyl nitrite, cleaning fluids,
gasoline, paint, and glue. The four categories of prescription-type drugs (pain
relievers, tranquilizers, stimulants, and sedatives) cover numerous drugs available
through prescriptions as well as drugs within these groupings that may be manufactured
illegally, such as methamphetamine, which is included under stimulants. Respondents
are asked to report only uses of drugs that were not prescribed for them or
drugs they took only for the experience or feeling they caused; therefore, over-the-counter
drugs and legitimate uses of prescription drugs are not included. NSDUH reports
combine the four prescription-type drug groups into a category referred to as
"psychotherapeutics."
Estimates of "illicit drug use" reported
from NSDUH reflect the use of any of the nine drug categories listed above.
Use of alcohol and tobacco products, while illegal for youths, is not included
in these estimates, but is discussed in Chapters 3
and 4.
NSDUH now collects more extensive data on respondents'
history of drug use, including age at first use, age at last use, and use during
the year prior to the past 12 months (i.e., during the period from 12 to 23
months ago). These data are useful in tracking trends over time in that they
allow year-to-year changes in new use (incidence), continuing use, and discontinuation
of use (quitting) to be measured separately in order to assess their impact
on past year use rates. Results for marijuana use based on these new data are
included in this chapter. Additional analysis of incidence for all substances
is presented in Chapter 5.
In 2004, an estimated 19.1 million Americans
aged 12 or older were current (past month) illicit drug users, meaning they
had used an illicit drug during the month prior to the survey interview. This
estimate represents 7.9 percent of the population aged 12 years old or older.
The overall rate of current illicit drug use
among persons aged 12 or older in 2004 (7.9 percent) was similar to the rate
in 2003 (8.2 percent) and in 2002 (8.3 percent).
Marijuana was the most commonly used illicit
drug (14.6 million past month users). In 2004, it was used by 76.4 percent
of current illicit drug users. An estimated 56.8 percent of current illicit
drug users used only marijuana, 19.7 percent used marijuana and another illicit
drug, and the remaining 23.6 percent used only an illicit drug other than
marijuana in the past month (Figure 2.1).
Figure 2.1 Types of Drugs Used by Past Month
Illicit Drug Users Aged 12 or Older: 2004
Among persons aged 12 or older, the overall
rate of past month marijuana use was about the same in 2004 (6.1 percent)
as it was in 2003 (6.2 percent) and 2002 (6.2 percent).
In 2004, an estimated 2.0 million persons
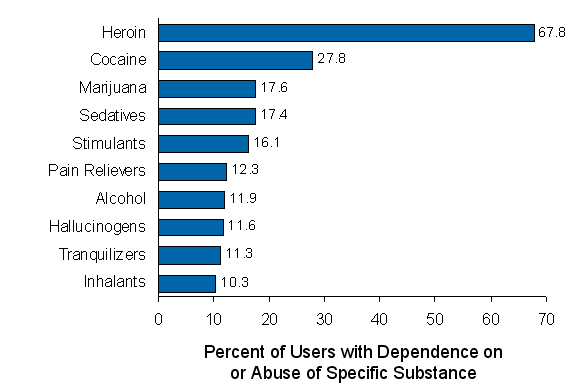
(0.8 percent) were current cocaine users (Figure 2.2);
of these, 467,000 used crack during the same time period (0.2 percent). Hallucinogens
were used by 929,000 persons (0.4 percent). There were an estimated 166,000
current heroin users (0.1 percent). All of these estimates are similar to
estimates for 2003.
Figure 2.2 Past Month Use of Selected Illicit
Drugs among Persons Aged 12 or Older: 2002-2004
An estimated 8.2 million people (3.4 percent
of the population) were current users of illicit drugs other than marijuana
in 2004. Most (6.0 million, 2.5 percent of the population) used psychotherapeutic
drugs nonmedically (Figure 2.2).
An estimated 4.4 million used pain relievers, 1.6 million used tranquilizers,
1.2 million used stimulants (including 583,000 using methamphetamine), and
0.3 million used sedatives. These estimates are all similar to the corresponding
estimates for 2003.
The number of current users of Ecstasy remained
the same in 2004 (450,000) as it had been in 2003 (470,000), after it had
decreased significantly between 2002 (676,000) and 2003. There were no significant
changes in the past month use of other hallucinogens between 2003 and 2004.
Although an estimated 23.4 million persons had tried LSD in their lifetime,
only 141,000 were current users in 2004.
There was no significant change in past month,
past year, or lifetime nonmedical use of pain relievers among persons aged
12 or older between 2003 and 2004. The rate of past month use was 2.0 percent
in 2003 and 1.8 percent in 2004.
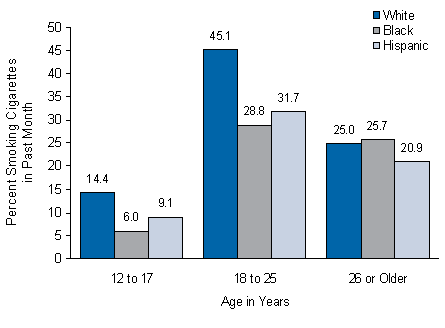
Age
Rates of drug use showed substantial variation
by age. For example, 3.8 percent of youths aged 12 or 13 reported current
illicit drug use in 2004 (Figure 2.3).
As in prior years, illicit drug use in 2004 tended to increase with age among
young persons, peaking among 18 to 20 year olds (21.7 percent) and generally
declining after that point with increasing age.
Figure 2.3 Past Month Illicit Drug Use among
Persons Aged 12 or Older, by Age: 2004
Among youths, the types of drugs used differed
by age in 2004, as was the case in prior years. Among 12 or 13 year olds,
1.7 percent used prescription-type drugs nonmedically, 1.2 percent used inhalants,
and 1.1 percent used marijuana. Among 14 or 15 year olds, marijuana was the
dominant drug used (7.3 percent), followed by prescription-type drugs used
nonmedically (4.1 percent) and inhalants (1.6 percent). Marijuana also was
the most commonly used drug among 16 or 17 year olds (14.5 percent), followed
by prescription-type drugs used nonmedically (5.1 percent), hallucinogens
(1.7 percent), and cocaine (1.1 percent). Only 0.9 percent of youths aged
16 or 17 used inhalants.
Among all youths aged 12 to 17 in 2004, 10.6
percent were current illicit drug users: 7.6 percent used marijuana, 3.6 percent
used prescription-type drugs nonmedically, 1.2 percent used inhalants, 0.8
percent used hallucinogens, and 0.5 percent used cocaine.
The rate of current illicit drug use among
youths aged 12 to 17 gradually declined between 2002 and 2004. The rate was
11.6 percent in 2002, 11.2 percent in 2003, and 10.6 percent in 2004 (Figure 2.4).
This represents a statistically significant change between 2002 and 2004,
but not between 2002 and 2003 or between 2003 and 2004.
Figure 2.4 Past Month Use of Selected Illicit
Drugs among Youths Aged 12 to 17: 2002-2004
The rate of current marijuana use among youths
was 8.2 percent in 2002, 7.9 percent in 2003, and 7.6 percent in 2004, indicating
a steady but not statistically significant decline. However, declines in past
year and lifetime use of marijuana among youths from 2002 to 2004 were statistically
significant.
Young Adults Aged 18 to 25
Rates of current use of illicit drugs were
highest for the young adult age group (18 to 25 years) at 19.4 percent, with
16.1 percent using marijuana, 6.1 percent using prescription-type drugs nonmedically,
2.1 percent using cocaine, and 1.5 percent using hallucinogens.
There were no changes in past month use of
any drugs among young adults between 2003 and 2004. However, declines between
2002 and 2004 occurred for marijuana (17.3 percent in 2002, 17.0 percent in
2003, and 16.1 percent in 2004) and hallucinogens (1.9, 1.7, and 1.5 percent,
respectively).
Past year use of Ecstasy among young adults
declined from 5.8 percent in 2002 to 3.7 percent in 2003 and to 3.1 percent
in 2004.
Current nonmedical use of prescription-type
drugs showed no signs of decreasing among young adults, remaining at 6.1 percent
in 2004, compared with 6.0 percent in 2003 and 5.4 percent in 2002. There
were increases in lifetime prevalence of use from 2002 to 2004 of several
categories of pain relievers among those aged 18 to 25: Vicodin®,
Lortab®, or Lorcet®; Percocet®,
Percodan®, or Tylox®; hydrocodone products;
OxyContin®; and oxycodone products (Figure 2.5).
Figure 2.5 Lifetime Nonmedical Use of Selected
Pain Relievers among Young Adults Aged 18 to 25: 2002-2004
Among adults aged 26 or older, 5.5 percent
reported current illicit drug use in 2004: 4.1 percent used marijuana, and
1.7 percent used prescription-type drugs. In this age group, less than 1 percent
used cocaine (0.7 percent), hallucinogens (0.1 percent), and inhalants (0.1
percent). Rates of lifetime, past year, and past month illicit drug use for
adults aged 26 or older were unchanged between 2003 and 2004.
Gender
As in 2002 and 2003, males were more likely
in 2004 to report current illicit drug use than females (9.9 vs. 6.1 percent,
respectively). Males were almost twice as likely to use marijuana as females
(8.0 vs. 4.3 percent). However, rates of nonmedical use of any prescription-type
psychotherapeutic were similar for males (2.6 percent) and females (2.4 percent).
Among youths aged 12 to 17, the rate of current
illicit drug use was similar for boys and girls (10.6 percent for both). While
boys aged 12 to 17 had a higher rate of marijuana use than girls (8.1 vs.
7.1 percent) (Figure 2.6), the
rate for nonmedical use of prescription-type psychotherapeutics was higher
for girls (4.1 vs. 3.2 percent).
Figure 2.6 Past Month Marijuana Use among
Youths Aged 12 to 17, by Gender: 2002-2004
Between 2002 and 2004, past month marijuana
use declined for male youths (9.1 percent in 2002, 8.6 percent in 2003, and
8.1 percent in 2004), but it remained level for female youths (7.2, 7.2, and
7.1 percent) during the same time span.
Pregnant Women
Among pregnant women aged 15 to 44 years,
an estimated 4.6 percent reported using illicit drugs in the past month based
on combined 2003 and 2004 NSDUH data. This rate was significantly lower than
the rate among women aged 15 to 44 who were not pregnant (10.2 percent). The
combined 2002-2003 rate of illicit drug use among pregnant women (4.3
percent) was not significantly different from the 2003-2004 combined
rate.
Race/Ethnicity
Rates of current illicit drug use varied significantly
among the major racial/ethnic groups in 2004. The rate was highest among persons
reporting two or more races (13.3 percent) and American Indians or Alaska
Natives (12.3 percent). Rates were 8.1 percent for whites, 7.2 percent for
Hispanics, and 8.7 percent for blacks. Asians had the lowest rate at 3.1 percent.
Among youths aged 12 to 17, the rate of current
illicit drug use was highest among American Indians or Alaska Natives, more
than twice the overall rate among youths (26.0 vs. 10.6 percent). Rates for
other groups were 12.2 percent among those reporting two or more races, 11.1
percent among whites, 10.2 percent among Hispanics, 9.3 percent among blacks,
and 6.0 percent among Asians.
There were no statistically significant changes
between 2003 and 2004 in the rates of current illicit drug use for any racial/ethnic
subgroup. This was the case both for all persons aged 12 or older and for
youths aged 12 to 17.
The overall decline in current marijuana use
among male youths from 2002 to 2004 was consistent across major racial/ethnic
groups. Among white male youths, rates were 9.7, 9.5, and 8.5 percent in 2002,
2003, and 2004, respectively. Rates were 8.7, 6.8, and 7.6 percent for black
male youths and 8.6, 7.2, and 7.3 percent among Hispanic male youths in those
3 years.
Education
Illicit drug use rates in 2004 were correlated
with educational status. Among adults aged 18 or older, the rate of current
illicit drug use was lower among college graduates (5.6 percent) compared
with those who did not graduate from high school (8.6 percent), high school
graduates (7.8 percent), and those with some college (8.7 percent). However,
adults who had completed 4 years of college were more likely to have tried
illicit drugs in their lifetime when compared with adults who had not completed
high school (51.8 vs. 37.2 percent).
College Students
In the college-aged population (persons aged
18 to 22 years old), the rate of current illicit drug use was slightly lower
among full-time undergraduate college students (20.2 percent) than among other
persons aged 18 to 22 years, including part-time students, students in other
grades, and nonstudents (22.3 percent). The rate of current illicit drug use
among college students and other 18 to 22 year olds did not change between
2002 and 2003 or between 2003 and 2004.
Employment
Current employment status was correlated with
rates of illicit drug use in 2004. An estimated 19.2 percent of unemployed
adults aged 18 or older were current illicit drug users compared with 8.0
percent of those employed full time and 10.3 percent of those employed part
time. These rates are all similar to the corresponding rates in 2003.
Although the rate of drug use was higher among
unemployed persons compared with those from other employment groups, most
drug users were employed. Of the 16.4 million illicit drug users aged 18 or
older in 2004, 12.3 million (75.2 percent) were employed either full or part
time.
Geographic Area
Among persons aged 12 or older, the rate of
current illicit drug use in 2004 was 8.9 percent in the West, 8.4 percent
in the Northeast, 7.5 percent in the Midwest, and 7.3 percent in the South.
Similar patterns were evident in 2003 and 2002.
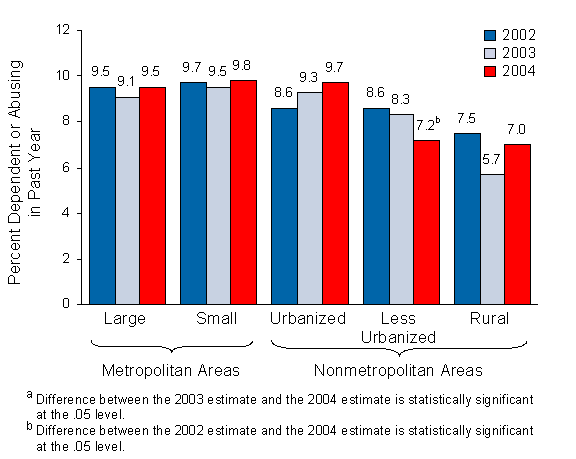
The rate of illicit drug use in metropolitan
areas was higher than the rate in nonmetropolitan areas in 2004. Rates were
8.1 percent in large metropolitan counties, 8.5 percent in small metropolitan
counties, and 6.3 percent in nonmetropolitan counties as a group (Figure 2.7).
Within nonmetropolitan areas, counties that were urbanized had a rate of 7.6
percent, less urbanized counties had a rate of 5.6 percent, while completely
rural counties had a rate of 4.6 percent.
Figure 2.7 Past Month Illicit Drug Use among
Persons Aged 12 or Older, by County Type: 2002-2004
The rate of current illicit drug use in completely
rural counties had declined between 2002 and 2003, from 6.7 to 3.1 percent,
but was 4.6 percent in 2004. The rate in 2004 was not significantly different
from the rate in 2003 or 2002.
Among youths aged 12 to 17, there was evidence
of regional differences in trends of marijuana use between 2002 and 2004.
Rates of current marijuana use were lower in 2004 than in 2002 in the Northeast,
Midwest, and South (although the decrease was not statistically significant
in the Northeast and Midwest) (Figure 2.8).
However, in the West, rates were 8.0 percent in 2002, 8.7 percent in 2003,
and 9.3 percent in 2004.
Figure 2.8 Past Month Marijuana Use among
Youths Aged 12 to 17, by Geographic Region: 2002-2004
In 2004, among the estimated 1.5 million adults
aged 18 or older on parole or other supervised release from prison during
the past year, 25.3 percent were current illicit drug users compared with
7.5 percent among adults not on parole or supervised release.
Among the estimated 4.7 million adults on
probation at some time in the past year, 26.2 percent reported current illicit
drug use in 2004. This compares with a rate of 7.2 percent among adults not
on probation in 2004.
Frequency of Use
In 2004, 12.7 percent of past year marijuana
users used marijuana on 300 or more days in the past 12 months. This translates
into 3.2 million persons using marijuana on a daily or almost daily basis
over a 12-month period, similar to the estimates in 2002 and 2003.
The number of youths aged 12 to 17 using marijuana
daily or almost daily in the past year declined from 358,000 in 2002 to 282,000
in 2003, but the estimate for 2004 was 342,000, which was not significantly
different from the estimates for 2002 or 2003. Similarly, the number of youths
using marijuana on 20 or more days in the past month declined from 603,000
in 2002 to 482,000 in 2003, but was 536,000 in 2004.
The number of past month daily or almost daily
cocaine users increased from 133,000 in 2003 to 263,000 in 2004. Most of these
daily users were aged 26 or older (96,000 in 2003, 203,000 in 2004).
Association with Cigarette and Alcohol Use
In 2004, the rate of current illicit drug
use was approximately 8 times higher among youths aged 12 to 17 who smoked
cigarettes (47.5 percent) than it was among youths who did not smoke cigarettes
(5.6 percent).
Illicit drug use also was associated with
the level of alcohol use. Among youths aged 12 to 17 who were heavy drinkers
(i.e., drank five or more drinks on the same occasion on at least 5 different
days in the past 30 days), 65.6 percent also were current illicit drug users,
whereas among nondrinkers, the rate was only 5.0 percent.
Among youths who were both smokers and heavy
drinkers, 70.1 percent used illicit drugs compared with only 3.5 percent among
youths who did not drink or smoke.
Driving Under the Influence of Illicit Drugs
In 2004, an estimated 10.6 million persons
reported driving under the influence of an illicit drug during the past year.
This corresponds to 4.4 percent of the population aged 12 or older, which
was similar to the rates in 2002 (4.7 percent) and 2003 (4.6 percent). In
2004, the rate was highest (13.3 percent) among young adults aged 18 to 25,
a decrease from 14.7 percent in 2002.
How Marijuana Is Obtained
NSDUH includes questions asking marijuana
users how, from whom, and from where they obtained the marijuana they used
most recently. In 2004, most users (55.1 percent) got the drug for free or
shared someone else's marijuana. About 40 percent of marijuana users bought
it.
Most marijuana users obtained the drug from
a friend; 76.0 percent of those who bought their marijuana and 81.1 percent
of those who obtained the drug for free had acquired it from a friend.
More than half (52.7 percent) of users who
bought their marijuana purchased it inside a home, apartment, or dorm. This
also was the most common location for obtaining marijuana for free (65.1 percent).
Among youths aged 12 to 17, 60.4 percent got
the drug for free and 33.1 percent bought it. Among youths who bought their
marijuana, 33.6 percent bought it inside a home, apartment, or dorm. Among
youths who obtained their marijuana for free, 47.4 percent obtained it inside
a home, apartment, or dorm.
Among youths aged 12 to 17 who bought their
marijuana, 10.5 percent obtained it inside a school building, and 4.0 percent
bought it outside on school property.
Prior Marijuana Use History
Among the 25.5 million past year users of
marijuana in 2004, an estimated 2.1 million (8.4 percent) were first-time
users during the past year and 19.2 million (75.5 percent) were "continuing"
users (i.e., they had used during the prior year, which is the period from
12 to 23 months ago, and had continued to use in the past year). Additionally,
4.1 million (16.1 percent) "resumed" use in the past 12 months (i.e.,
they had used marijuana prior to 24 months ago, did not use during the prior
year, but did use in the past 12 months). These percentages are similar to
the percentages among past year marijuana users in 2003 (7.8 percent first-time
users, 77.0 percent "continuing" users, and 15.1 percent "resumed"
users).
Among the 3.7 million past year marijuana
users aged 12 to 17 in 2004, an estimated 1.3 million (34.2 percent) were
first-time users, 2.1 million (57.0 percent) were "continuing" users,
and 0.3 million (8.7 percent) had "resumed" their marijuana use
in the past 12 months. These percentages are similar to the percentages among
past year marijuana users in 2003.
A measure of "discontinuation" of
marijuana use is obtained as the percentage of those who did not use marijuana
in the past 12 months among those who did use in the prior year. Based on
this calculation, marijuana discontinuation rates in 2004 were 27.2 percent
among persons aged 12 or older, and 19.9 percent among youths aged 12 to 17.
These rates are essentially the same as the rates in 2003.
3. Alcohol Use
The National Survey on Drug Use and Health (NSDUH)
includes questions about the recency and frequency of consumption of alcoholic
beverages, such as beer, wine, whiskey, brandy, and mixed drinks. Prior to the
administration of the alcohol use questions, an extensive list of examples of
the kinds of beverages included is given to respondents. A "drink"
is defined as a can or bottle of beer, a glass of wine or a wine cooler, a shot
of liquor, or a mixed drink with liquor in it. Times when the respondent only
had a sip or two from a drink are not considered as consumption. For this report,
estimates for the prevalence of alcohol use are reported primarily at the following
three levels for males and females and all ages:
Current (past month) use -
At least one drink in the past 30 days (includes binge and heavy use).
Binge use - Five or more drinks on the same occasion (i.e., at the same
time or within a couple of hours of each other) at least once in the past 30
days (includes heavy use).
Heavy use - Five or more drinks on the same occasion on at least 5 different
days in the past 30 days.
About half (50.3 percent) of Americans aged
12 or older reported being current drinkers of alcohol in 2004. This translates
to an estimated 121 million people and is similar to the 2002 and 2003 estimates.
More than one fifth (22.8 percent) of persons
aged 12 or older participated in binge drinking at least once in the 30 days
prior to the survey in 2004. This translates to about 55 million people, comparable
with the 2002 and 2003 estimates.
In 2004, heavy drinking was reported by 6.9
percent of the population aged 12 or older, or 16.7 million people. These
figures are similar to those of 2002 and 2003, when 6.7 and 6.8 percent, respectively,
reported heavy drinking.
Age
Among young people, the prevalence of current
alcohol use in 2004 increased with age, from 2.3 percent at age 12 to 69.8
percent of persons at age 21 (Figure 3.1).
Among older persons, the prevalence of alcohol use decreased with increasing
age, from 63.2 percent among 26 to 29 year olds to 49.9 percent among 60 to
64 year olds and 35.3 percent among persons aged 65 or older.
Figure 3.1 Current, Binge, and Heavy Alcohol
Use among Persons Aged 12 or Older, by Age: 2004
Rates of binge alcohol use also increased
with age among young people, from 1.1 percent at age 12 to 26.6 percent at
age 17. Binge alcohol use peaked at age 21 (48.2 percent) and then decreased
beyond young adulthood (Figure 3.1).
Both binge and heavy drinking in 2004 were
highest for the 18- to 25-year-old age group compared with other
age groups, with the peak rate for both measures occurring at age 21. The
rate of binge drinking was 41.2 percent for young adults aged 18 to 25 and
48.2 percent at age 21. Heavy alcohol use was reported by 15.1 percent of
young adults aged 18 to 25 and by 19.2 percent of 21 year olds.
Rates of binge and heavy drinking were relatively
low among people aged 65 or older, with rates of 6.9 and 1.8 percent, respectively.
Among youths aged 12 to 17, an estimated 17.6
percent used alcohol in the month prior to the survey interview (i.e., were
current drinkers). An estimated 11.1 percent of youths aged 12 to 17 were
binge drinkers, and 2.7 percent were heavy drinkers. These percentages for
current, binge, and heavy drinking were similar to those obtained in 2002
and 2003.
Underage Alcohol Use
In 2004, about 10.8 million underage persons
aged 12 to 20 (28.7 percent) reported drinking alcohol in the past month.
Nearly 7.4 million (19.6 percent) were binge drinkers, and 2.4 million (6.3
percent) were heavy drinkers. These figures were similar to the 2002 and 2003
estimates.
More males than females aged 12 to 20 reported
binge drinking (22.1 vs. 17.0 percent) and heavy drinking (8.2 vs. 4.3 percent)
in 2004.
Among persons aged 12 to 20, past month alcohol
use rates ranged from 16.4 percent among Asians to 19.1 percent among blacks,
24.3 percent among American Indians or Alaska Natives, 26.4 percent among
those reporting two or more races, 26.6 percent among Hispanics, and 32.6
percent among whites.
Among persons aged 12 to 20, binge drinking
was reported by 22.8 percent of whites, 19.0 percent of American Indians or
Alaska Natives, 19.3 percent of Hispanics, and 18.0 percent of persons reporting
two or more races. However, binge drinking was reported by only 9.9 percent
of blacks and 8.0 percent of Asians. The binge drinking rate among underage
Hispanics increased significantly from the 2003 rate of 16.9 percent.
Across geographic regions in 2004, underage
current alcohol use rates were higher in the Northeast (32.3 percent) and
Midwest (31.4 percent) than in the South and the West (26.2 and 27.3 percent,
respectively) (Figure 3.2). This
pattern was similar to that in 2002 and 2003.
Figure 3.2 Past Month Alcohol Use among
Persons Aged 12 to 20, by Geographic Region: 2003 and 2004
In 2004, underage current alcohol use rates
were higher in small metropolitan areas than in large metropolitan areas.
Rates were 31.6 percent in small metropolitan areas, 27.0 percent in large
metropolitan areas, and 28.8 percent in nonmetropolitan areas. The rate in
nonmetropolitan rural areas was 28.7 percent.
Gender
In general, males were more likely than females
to report past month alcohol use. In 2004, 56.9 percent of males aged 12 or
older were current drinkers compared with 44.0 percent of females. However,
among youths aged 12 to 17, the rates of past month alcohol use were not significantly
different (17.2 percent for males vs. 18.0 percent for females).
Among young adults aged 18 to 25, an estimated
56.0 percent of females reported current drinking in 2004, unchanged from
2003. However, 64.9 percent of 18- to 25-year-old males reported
current alcohol use in 2004, which was 2 percent lower than the 2003 estimate
of 66.9 percent, but not significantly lower than the 2002 estimate of 65.2
percent.
Pregnant Women
Among pregnant women aged 15 to 44, an estimated
11.2 percent reported past month alcohol use and 4.5 percent reported past
month binge drinking. These rates were significantly lower than the rates
for nonpregnant women of that age (52.8 and 23.3 percent, respectively). Heavy
alcohol use was relatively rare (0.5 percent) among pregnant women. These
estimates were based on data averaged over 2003 and 2004.
Race/Ethnicity
Among persons aged 12 or older, whites and
persons reporting two or more races were more likely than other racial/ethnic
groups to report current use of alcohol in 2004. An estimated 55.2 percent
of whites and 52.4 percent of persons reporting two or more races used alcohol
in the past month (Figure 3.3).
The rates were 40.2 percent for Hispanics, 37.4 percent for Asians, 37.1 percent
for blacks, and 36.2 percent for American Indians or Alaska Natives.
Figure 3.3 Current, Binge, and Heavy Alcohol
Use among Persons Aged 12 or Older, by Race/Ethnicity: 2004
The rate of binge alcohol use was lowest among
Asians (12.4 percent). Rates for other racial/ethnic groups were 18.3 percent
for blacks, 23.8 percent for whites, 24.0 percent for Hispanics, and 25.8
percent for American Indians or Alaska Natives.
Among youths aged 12 to 17 in 2004, blacks
and Asians reported the lowest rate of past month alcohol use. Only 9.4 percent
of Asian youths and 9.8 percent of black youths were current drinkers, while
rates were at or above 18 percent for whites, American Indians or Alaska Natives,
Hispanics, and youths reporting two or more races.
Education
The rate of past month alcohol use increased
with increasing levels of education. Among adults aged 18 or older with less
than a high school education, 36.4 percent were current drinkers in 2004,
while 67.6 percent of college graduates were current drinkers.
Rates of heavy drinking increased among college
graduates from 2003 to 2004 (6.4 percent in 2004 vs. 5.3 percent in 2003)
and decreased among adults with less than a high school education (6.2 percent
in 2004 vs. 7.9 percent in 2003). Binge drinking also increased among college
graduates, from 20.2 percent in 2003 to 21.9 percent in 2004.
College Students
Young adults aged 18 to 22 enrolled full time
in college were more likely than their peers not enrolled full time (i.e.,
part-time college students and persons not enrolled in college) to use alcohol,
binge drink, and drink heavily. Past month alcohol use was reported by 62.4
percent of full-time college students compared with 55.7 percent of persons
aged 18 to 22 who were not currently enrolled full time. Binge and heavy use
rates for college students were 43.4 and 18.6 percent, respectively, compared
with 39.4 and 13.5 percent, respectively, for other persons aged 18 to 22.
There were no significant changes in rates
of past month, binge, or heavy alcohol use between 2003 and 2004 among full-time
college students aged 18 to 22.
Among persons aged 18 to 22, full-time college
students were more likely to be heavy drinkers than others (18.6 vs. 13.5
percent) (Figure 3.4). However,
at later ages (26 or older), those who had graduated from college had rates
of heavy drinking similar to those who had not graduated from college (i.e.,
those who had some college or less) (5.5 vs. 6.3 percent).
Figure 3.4 Heavy Alcohol Use among Adults
Aged 18 or Older, by College Attendance and Age: 2004
Rates of current alcohol use were 61.3 percent
for full-time employed adults aged 18 or older in 2004 compared with 56.6
percent of their unemployed peers (Figure 3.5).
However, the patterns were different for binge and heavy alcohol use; rates
were higher for unemployed persons (34.0 and 13.6 percent, respectively, for
binge and heavy use) than for full-time employed persons (29.2 and 8.9 percent,
respectively).
Figure 3.5 Current, Binge, and Heavy Alcohol
Use among Adults Aged 18 or Older, by Employment Status: 2004
Most binge and heavy alcohol users were employed.
Among the 51.9 million adult binge drinkers in 2004, 41.2 million (79.3 percent)
were employed either full or part time. Similarly, 12.7 million (79.5 percent)
of the 16.0 million adult heavy drinkers were employed.
Geographic Area
The rate of past month alcohol use for people
aged 12 or older in 2004 was lower in the South (45.1 percent) than in the
Northeast (55.5 percent), Midwest (53.7 percent), or West (50.8 percent).
This pattern was similar to that in 2002 and 2003.
Among people aged 12 or older, the rate of
past month alcohol use in large metropolitan areas was 52.7 percent compared
with 49.7 percent in small metropolitan areas and 43.7 percent in nonmetropolitan
areas. There was less variation across county types in rates of binge and
heavy drinking. The rate of heavy alcohol use was 6.4 percent in large metropolitan
areas, 7.9 percent in small metropolitan areas, and 7.0 percent in nonmetropolitan
areas.
Among youths aged 12 to 17, the rate of past
month binge alcohol use varied by population density. In nonmetropolitan areas,
the rate was 13.4 percent compared with 11.7 percent in small metropolitan
areas and 10.0 percent in large metropolitan areas. In completely rural counties
of nonmetropolitan areas, 16.9 percent of youths reported binge drinking.
Association with Illicit Drug and Tobacco Use
The level of alcohol use was strongly associated
with illicit drug use in 2004. Among the 16.7 million heavy drinkers aged
12 or older, 32.2 percent were current illicit drug users. Persons who did
not use alcohol in the past month were less likely to have used illicit drugs
in the past month (3.0 percent) than those who reported current, binge, or
heavy use of alcohol in the past month.
Drinking levels also were associated with
tobacco use. Among heavy alcohol users aged 12 or older, 61.2 percent smoked
cigarettes in the past month, while only 21.1 percent of non-binge current
drinkers and 16.3 percent of persons who did not drink alcohol in the past
month were current smokers. Smokeless tobacco and cigar use also were more
prevalent among heavy drinkers than among non-binge drinkers and nondrinkers.
Driving Under the Influence of Alcohol
In 2004, an estimated 13.5 percent of persons
aged 12 or older drove under the influence of alcohol at least once in the
past year. This percentage was similar to that reported in 2003. The 2004
estimate corresponds to approximately 32.5 million persons.
Driving under the influence varied by age
group in 2004. An estimated 10.2 percent of 16 or 17 year olds, 20.2 percent
of 18 to 20 year olds, and 28.2 percent of 21 to 25 year olds reported driving
under the influence of alcohol (Figure 3.6).
Beyond age 25, these rates declined with increasing age.
Figure 3.6 Driving Under the Influence of
Alcohol in the Past Year among Persons Aged 16 or Older, by Age: 2004
Males were nearly twice as likely as females
(17.9 vs. 9.4 percent, respectively) to drive under the influence of alcohol.
4. Tobacco Use
The National Survey on Drug Use and Health (NSDUH)
includes a series of questions about the use of tobacco products, including
cigarettes, chewing tobacco, snuff, cigars, and pipe tobacco. Cigarette use
is defined as smoking "part or all of a cigarette." For analytic purposes,
data for chewing tobacco and snuff are combined as "smokeless tobacco."
Questions to determine nicotine dependence among current cigarette smokers also
are included in NSDUH. Respondents are considered to be dependent on nicotine
if they meet the criteria for either the Nicotine Dependence Syndrome Scale
or the Fagerstrom Test of Nicotine Dependence (see Appendix B,
Section B.4.2, of this report).
An estimated 70.3 million Americans aged 12
or older reported current (past month) use of a tobacco product in 2004. This
represents 29.2 percent of the population in that age range. An estimated
59.9 million persons (24.9 percent of the population) were current cigarette
smokers; 13.7 million (5.7 percent) smoked cigars; 7.2 million (3.0 percent)
used smokeless tobacco; and 1.8 million (0.8 percent) smoked tobacco in pipes
(Figure 4.1).
Figure 4.1 Past Month Tobacco Use among
Persons Aged 12 or Older: 2002-2004
These rates of current use were unchanged
between 2003 and 2004, but between 2002 and 2004 past month use of a tobacco
product declined from 30.4 to 29.2 percent, past month cigarette use decreased
from 26.0 to 24.9 percent, and past month smokeless tobacco use decreased
from 3.3 to 3.0 percent.
Age
Among age groups, young adults aged 18 to
25 had the highest rate of current use of a tobacco product (44.6 percent)
and of each specific product. In 2004, the rates of past month use among young
adults were 39.5 percent for cigarettes, 12.7 percent for cigars, 4.9 percent
for smokeless tobacco, and 1.2 percent for pipe tobacco (Figure 4.2).
Current use of cigarettes and smokeless tobacco by young adults did not change
significantly between 2002 and 2004. Use of pipe tobacco by young adults increased
from 0.9 percent in 2003 to 1.2 percent in 2004, similar to its rate in 2002
(1.1 percent).
Figure 4.2 Past Month Use of Tobacco Products,
by Age: 2004
Among youths aged 12 to 17 in 2004, an estimated
3.6 million (14.4 percent) used a tobacco product in the past month, and 3.0
million (11.9 percent) used cigarettes. The rate of past month cigarette use
among 12 to 17 year olds declined from 13.0 percent in 2002 to 11.9 percent
in 2004 (the rate was 12.2 percent in 2003). Cigar use in the past month was
reported by 4.8 percent of youths in 2004, and past month smokeless tobacco
use was reported by 2.3 percent; these rates were unchanged from 2002 and
2003.
Current cigarette use increased with age up
to the mid-20s then declined. An estimated 2.8 percent of 12 or 13 year olds,
10.9 percent of 14 or 15 year olds, and 22.2 percent of 16 or 17 year olds
were current cigarette smokers in 2004 (Figure 4.3).
Current cigarette use peaked at 41.0 percent in 2004 among young adults aged
21 to 25. Less than a quarter (22.2 percent) of persons aged 35 or older in
2004 smoked cigarettes in the past month. Rates of cigarette smoking were
mostly stable across the 3 survey years within these age groups, with one
exception. Among youths aged 16 or 17, the rate of current cigarette smoking
declined from 24.9 percent in 2002 to 22.2 percent in 2004.
Figure 4.3 Past Month Cigarette Use, by
Age: 2002-2004
Cigar smoking in the past month increased
from 11.4 percent in 2003 to 12.7 percent in 2004 among young adults aged
18 to 25. Cigar smoking remained stable for youths aged 12 to 17 and adults
aged 26 or older (4.8 and 4.6 percent, respectively).
Smokeless tobacco use in the past month declined
from 3.2 percent in 2003 to 2.7 percent in 2004 among adults aged 26 or older.
Smokeless tobacco use remained stable among youths aged 12 to 17 and among
young adults aged 18 to 25 (2.3 and 4.9 percent, respectively).
Gender
In 2004, current use of a tobacco product
among persons aged 12 or older was reported by a higher percentage of males
(35.7 percent) than females (23.1 percent). Males also had higher rates of
past month use of each specific tobacco product compared with females: cigarette
smoking (27.7 percent of males vs. 22.3 percent of females); cigar smoking
(9.8 percent of males vs. 1.9 percent of females); and use of smokeless tobacco
(5.8 percent of males vs. 0.3 percent of females).
Among youths aged 12 to 17, current cigarette
smoking in 2004 was more prevalent among females (12.5 percent) than males
(11.3 percent). The rate for females in this age group declined from 13.6
percent in 2002 to 12.5 percent in 2003, then remained unchanged in 2004.
Among 12- to 17-year-old males, the rate of current cigarette use
was 12.3 percent in 2002, 11.9 percent in 2003, and 11.3 percent in 2004 (no
significant change).
Current cigar smoking among males increased
from 9.0 percent in 2003 to 9.8 percent in 2004 among those aged 12 or older
and from 17.3 to 19.7 percent among those aged 18 to 25.
Pregnant Women
Among women aged 15 to 44, combined data for
2003 and 2004 indicated that 18.0 percent of those who were pregnant smoked
cigarettes in the past month compared with 30.0 percent of those who were
not pregnant. Rates of past month cigarette smoking were lower for pregnant
than nonpregnant women among those aged 26 to 44 (11.7 vs. 29.1 percent) and
among those aged 18 to 25 (28.0 vs. 36.3 percent) (Figure 4.4).
However, among those aged 15 to 17, the rate of cigarette smoking for pregnant
women was higher than for nonpregnant women (26.0 vs. 19.6 percent), although
the difference was not significant. Similar patterns were observed in the
combined data for 2002 and 2003.
Figure 4.4 Current Cigarette Use among Women
Aged 15 to 44, by Age and Pregnancy Status, 2003-2004 Combined
In 2004, among persons aged 12 or older, 31.4
percent of whites, 27.3 percent of blacks, 33.8 percent of American Indians
or Alaska Natives, and 23.3 percent of Hispanics reported that they had used
a tobacco product in the past month. Tobacco use was highest for persons who
reported two or more races (41.3 percent) and lowest for Asians (11.7 percent).
There were no statistically significant changes in past year or past month
tobacco use between 2003 and 2004 among any of these groups.
In 2004, current cigarette smoking among youths
aged 12 to 17 and young adults aged 18 to 25 was more prevalent among whites
than blacks (14.4 vs. 6.0 percent for 12 to 17 year olds and 45.1 vs. 28.8
percent for 18 to 25 year olds) (Figure 4.5).
Among adults aged 26 or older, however, whites and blacks used cigarettes
at about the same rate (25.0 and 25.7 percent, respectively). Within each
of the three age groups, current cigarette use was less prevalent among Hispanics
than among non-Hispanic whites.
Figure 4.5 Current Cigarette Use, by Race/Ethnicity
and Age: 2004
Current use of smokeless tobacco declined
from 8.4 percent in 2003 to 3.6 percent in 2004 among American Indians or
Alaska Natives aged 18 or older. In the same age group, past month cigar smoking
increased from 5.4 to 6.1 percent among whites, but declined from 7.8 to 6.4
percent among blacks. The rate of current cigar smoking among Hispanics remained
stable.
The 2-year moving average prevalence
rates for racial/ethnic subgroups indicate that current cigarette smoking
declined from 15.9 percent in the combined years for 2002-2003 to 11.1
percent in 2003-2004 among Filipinos aged 12 or older. Across Asian national
groups, cigarette use in 2003-2004 was highest among Koreans (19.9 percent)
and lowest among persons who identified themselves as Chinese (7.1 percent).
Across Hispanic or Latino subgroups, Central or South Americans had the lowest
rate of cigarette smoking (17.6 percent) and Puerto Ricans had the highest
rate (27.8 percent).
Education
Cigarette smoking tended to be less prevalent
among persons with more education. Among adults aged 18 or older, current
cigarette use in 2004 was reported by 34.8 percent of those who had not completed
high school, 30.4 percent of high school graduates who did not attend college,
29.0 percent of persons with some college, and 13.6 percent of college graduates.
In 2004, the use of smokeless tobacco in the
past month was reported by 3.8 percent of persons aged 18 or older who had
not completed high school and 3.7 percent of those who completed high school
but did not attend college; the prevalence was lower among college graduates
(2.2 percent). These rates were not significantly different from those in
2002 and 2003. However, among persons aged 18 or older who had completed some
college but did not graduate, there was a significant decrease in the past
month use of smokeless tobacco between 2002 (3.3 percent) and 2004 (2.6 percent).
College Students
Among young adults 18 to 22 years old, full-time
college students were less likely to be current cigarette or cigar smokers
than their peers who were not enrolled full time in college. Cigarette use
in the past month in 2004 was reported by 30.5 percent of full-time college
students compared with 44.7 percent of those not enrolled full time.
In 2004, past month cigar smoking was less
common among male full-time college students aged 18 to 22 (19.3 percent)
than among their peers not enrolled full time in college (22.3 percent).
Past month smokeless tobacco use was more
common in 2004 among male full-time college students aged 18 to 22 than among
their peers not enrolled full time in college (11.1 vs. 8.7 percent).
Employment
In 2004, current cigarette smoking was more
common among unemployed adults aged 18 or older than among adults who were
working full time or part time (44.1 vs. 28.7 and 25.2 percent, respectively).
Cigar smoking followed a similar pattern, with 11.7 percent of unemployed
adults reporting past month use compared with 6.9 percent of full-time workers
and 4.9 percent of part-time workers.
Rates of current cigarette use among adults
aged 18 or older decreased among unemployed persons between 2002 and 2003
and between 2002 and 2004; rates were 49.8 percent in 2002, 42.7 percent in
2003, and 44.1 percent in 2004. Among adults who were employed full time,
current use of smokeless tobacco decreased from 4.5 percent in 2002 and 2003
to 3.7 percent in 2004.
Geographic Area and County Type
Current cigarette smoking among persons aged
12 or older was lowest in the West (19.7 percent) and highest in the Midwest
(27.8 percent) and the South (26.8 percent). Use of smokeless tobacco was
highest in the South (4.1 percent) and lowest in the Northeast (1.5 percent).
Cigar smoking, like cigarette use, was highest in the Midwest (6.9 percent)
and lowest in the West (4.8 percent).
The rate of current cigarette smoking among
persons aged 12 or older declined from 22.6 percent in 2002 and 21.5 percent
in 2003 to 19.7 percent in 2004 in the West. In the Midwest, the prevalence
of current cigar smoking increased from 5.6 percent in 2002 and 5.8 percent
in 2003 to 6.9 percent in 2004.
Among persons aged 12 or older, the rate of
current cigarette use was inversely related to county population density in
2004, as it had been in 2003. In 2004, the rates of cigarette smoking were
28.4 percent in nonmetropolitan areas, 26.0 percent in small metropolitan
areas, and 23.2 percent in large metropolitan areas. However, the lowest rate
in 2004, 22.8 percent, was found for completely rural counties, and the highest,
29.3 percent, was in the urbanized portions of nonmetropolitan areas.
Use of smokeless tobacco in the past month
among persons aged 12 or older was highest in completely rural counties (8.0
percent) and lowest in large metropolitan areas (1.7 percent).
In completely rural nonmetropolitan counties,
current cigarette use among persons aged 12 or older declined from 31.8 percent
in 2002 and 28.0 percent in 2003 to 22.8 percent in 2004 (Figure 4.6).
Significant decreases between 2002 and 2004 also were observed for youths
aged 12 to 17 and for adults aged 26 or older.
Figure 4.6 Past Month Cigarette Use among
Persons in Completely Rural Counties, by Age: 2002-2004
An estimated 93.4 million Americans aged 12
or older indicated in 2004 that they had smoked cigarettes daily at some time
in their lives. This is 38.8 percent of the population in that age group,
a decrease from 39.9 percent in 2003.
Among the 59.9 million Americans aged 12 or
older who smoked cigarettes in the past month, 62.3 percent (37.3 million
persons) smoked on all 30 days. In 2004, daily smoking in the past month was
reported by an estimated 828,000 youths aged 12 to 17 (27.6 percent of past
month cigarette smokers in that age group). Over half (51.6 percent) of past
month smokers aged 18 to 25 smoked daily in that period, and 67.8 percent
of past month cigarette smokers aged 26 or older were daily smokers.
In 2004, cigarette smokers averaged around
13 cigarettes per day on the days when they smoked in the past month. The
average number of cigarettes per smoking day increased steadily with age from
2 per day among 12 year olds to 6 per day among 17 year olds, 9 per day among
24 year olds, 12 per day among those aged 30 to 34, and 17 per day for 40
to 49 year olds. It peaked at 18 or 19 cigarettes per day on smoking days
among persons aged 50 to 64.
Association with Illicit Drug and Alcohol Use
Use of illicit drugs and alcohol was more
common among current cigarette smokers than among nonsmokers in 2004 as in
previous years. Among persons aged 12 or older, 20.0 percent of past month
cigarette smokers reported current use of an illicit drug compared with 3.9
percent of persons who were not current cigarette smokers. Past month alcohol
use was reported by 67.5 percent of current cigarette smokers compared with
44.6 percent of those who did not use cigarettes in the past month. The association
also was found with binge drinking (44.2 percent of current cigarette users
vs. 15.6 percent of current nonusers) and heavy drinking (17.0 vs. 3.6 percent,
respectively).
Similarly, use of tobacco products other than
cigarettes also was higher among current cigarette smokers than among current
nonsmokers. Approximately 1 in 20 current cigarette users (4.8 percent) reported
using smokeless tobacco in the past month compared with 2.4 percent of nonsmokers.
Moreover, 13.0 percent of current cigarette smokers also smoked cigars in
the past month compared with 3.3 percent of those who did not smoke cigarettes.
Usual Brand of Cigarettes Smoked
In 2004, the brands of cigarettes most often
smoked during the past month among current cigarette smokers aged 12 or older
were Marlboro (43.3 percent), Newport (11.5 percent), and Camel (7.3 percent).
These were also the most commonly reported brands in 2002 and 2003.
The proportion of past month cigarette smokers
aged 12 or older using Marlboro increased from 41.3 percent in both 2002 and
2003 to 43.3 percent in 2004. Doral use declined from 4.8 percent of cigarette
smokers in 2003 to 3.3 percent in 2004. Winston use, which had been at 3.0
percent in 2002 and 2003, declined to 2.3 percent in 2004.
Among current cigarette smokers aged 12 to
17, an estimated 49.3 percent smoked Marlboro most often in the past month.
Around one quarter (23.9 percent) smoked Newport, and 9.6 percent smoked Camel.
As in 2002 and 2003, black and white past
month cigarette smokers reported using different brands in 2004. Among black
smokers, 53.0 percent smoked Newport most often in the past month, followed
by Kool (9.8 percent), Marlboro (6.9 percent), and Salem (5.2 percent). Among
white cigarette smokers, Marlboro ranked first (45.4 percent), followed by
Camel (8.4 percent), Newport (5.2 percent), and Basic (5.1 percent). Among
Hispanic past month smokers, Marlboro ranked first with 61.8 percent, Newport
second (13.4 percent), and Camel third (5.0 percent).
Nicotine Dependence
In 2004, an estimated 35.3 million Americans
aged 12 or older met the criteria for nicotine dependence in the past month
based on their cigarette use. This represents 14.7 percent of the population
and 58.9 percent of the estimated 59.9 million past month cigarette users.
Among 12 to 17 year olds, 1.1 million (4.4 percent) were nicotine-dependent
cigarette smokers. This represents 36.7 percent of the 3.0 million past month
cigarette users among youths. The population prevalence of nicotine dependence
was 18.2 percent for young adults aged 18 to 25 and 15.5 percent among adults
aged 26 or older.
Among current cigarette smokers, the proportion
dependent on nicotine increased with age (Figure 4.7).
At age 14 or 15, for example, 34.9 percent of past month cigarette smokers
were dependent on nicotine. At age 18 to 20, 44.0 percent were dependent,
at age 26 to 29, 50.1 percent were dependent, and among those aged 55 to 59,
75.8 percent were dependent on nicotine. These rates did not change significantly
from 2003 to 2004.
Figure 4.7 Nicotine Dependence among Past
Month Cigarette Smokers, by Age: 2004
The rate of dependence was higher for those
who started smoking at an earlier age than for those who initiated cigarette
use later in life. Among current smokers aged 18 or older, 64.8 percent of
those who began smoking cigarettes at age 14 or earlier were dependent in
the past month compared with 53.1 percent of those who started smoking cigarettes
after age 17.
Discontinuation of Cigarette Use among Lifetime
Daily Smokers
A measure of "quitting" or "discontinuation"
of cigarette smoking is the percentage of persons not using cigarettes in
the past month among those who have ever smoked cigarettes daily in their
lifetime. In 2004, an estimated 46.2 percent of the estimated 93.4 million
lifetime daily smokers aged 12 or older had discontinued cigarette use as
evidenced by not smoking cigarettes in the past month.
The proportion of smokers who quit smoking
cigarettes generally increased with age (Figure 4.8).
In 2004, the proportion of lifetime daily cigarette smokers not smoking in
the past month was 23.4 percent for those aged 26 to 29, 36.9 percent for
those aged 40 to 44, 66.3 percent for those aged 60 to 64, and 81.0 percent
for those aged 65 or older.
Figure 4.8 Lifetime Daily Cigarette Smoking
by Current Smoking Status, by Age: 2004
Although whites were more likely than blacks
to have ever been daily cigarette smokers (44.3 vs. 30.2 percent), whites
who had been daily cigarette smokers also were more likely than their black
counterparts to have quit smoking cigarettes (47.7 vs. 38.9 percent). Asians
were the racial/ethnic group most likely to have quit smoking cigarettes (55.5
percent of lifetime daily smokers).
5. Initiation of Substance Use
Information on substance use initiation, also
known as incidence or first-time use, is important for policymakers and researchers.
Measures of initiation are often leading indicators of emerging patterns of
substance use. They provide valuable information that can be used in the assessment
of the effectiveness of current prevention programs and in determining where
prevention efforts need to focus.
With its large sample size and oversampling of
youths aged 12 to 17 and young adults aged 18 to 25, the National Survey on
Drug Use and Health (NSDUH) provides a variety of estimates related to substance
use initiation based on questions on age and month at first use. Using this
information, along with the interview date and the respondent's date of birth,
a date of first use is determined for each substance used by a respondent. Estimates
of the number of initiates, rates of initiation, and average age at first use
can be constructed for specific time periods. For example, estimates for calendar
years from 1965 to 2003 are tabulated, based on combined 2002-2004 NSDUH
data, to show long-term trends in initiation.
Estimates for the annual number of new users
of marijuana clearly show the increases in initiation among adults and youths
during the late 1960s and early 1970s, declines during the 1980s, and increases
among youths during the early 1990s (Figure 5.1).
However, recent methodological assessments of these long-term trend estimates
based on calendar year of initiation have suggested that they are biased, due
to suspected recall errors that seem to increase with the length of recall (Gfroerer
et al., 2004). Evidence of telescoping, where respondents shift their reported
age at first use either closer to their current age or further from the interview
date, also has been found (Golub, Johnson, & Labouvie, 2000; Johnson &
Schultz, in press).
Figure 5.1 Annual Numbers of New Users of Marijuana:
1965-2003
Therefore, this report introduces a new approach
for studying substance use initiation based on information on use within the
past 12 months from NSDUH. Estimates discussed in this chapter describe initiation
of substance use that occurred in the 12 months prior to the interview, and
individuals who initiated use within the past 12 months are defined as recent
initiates. Estimates for each year are produced independently based on the data
from the survey conducted that year. This should improve the comparability of
estimates across years, giving a more accurate assessment of recent trends.
Although this approach will not eliminate reporting biases, it should minimize
recall bias because the estimates are based on a more recent time period than
the previously produced calendar year estimates. The more recent time period
also provides more timely information on incidence. Finally, an advantage of
this approach is that initiation estimates can be analyzed in conjunction with
past year prevalence estimates because they reflect the same time period. For
example, this approach allows the estimation of initiates as a proportion of
past year users. For specific substances, initiation prior to age 12 is not
well covered, and initiation prior to age 11 is not included at all. This problem
primarily affects estimates of initiation for cigarettes, alcohol, and inhalants
because they tend to be initiated at a younger age than other drugs. See
Section B.4.4 in
Appendix B for further discussion
of methods and bias in initiation estimates.
Illicit Drugs
In 2004, an estimated 2.8 million persons
used an illicit drug for the first time within the past 12 months—approximately
7,000 per day. This was not significantly different from the number in 2002
(2.7 million) or 2003 (2.6 million). Most initiates (58.1 percent) were younger
than age 18 when they first used, and the majority of new users (57.9 percent)
were female. The average age at initiation was 20.1 years.
The drug category with the largest number
of recent initiates was nonmedical use of pain relievers (2.4 million), followed
by marijuana (2.1 million), nonmedical use of tranquilizers (1.2 million),
and cocaine (1.0 million) (Figure 5.2).
Inhalants had the youngest average age at first use (16.0 years), followed
by marijuana (18.0 years) (Figure 5.3).
Figure 5.2 Past Year Initiates for Illicit
Drug Categories: 2004
In 2004, an estimated 2.1 million persons
had used marijuana for the first time within the past 12 months—approximately
6,000 per day. This estimate was not significantly different from the number
in 2003 (2.0 million). However, there was a significant decline in the number
of recent marijuana initiates between 2002 (2.2 million) and 2003 (2.0 million).
Most (63.8 percent) of the 2.1 million recent
marijuana initiates were younger than age 18 when they first used. Among youths
aged 12 to 17, an estimated 5.0 percent had used marijuana for the first time
within the past year, which was similar to the rate in 2003 (4.9 percent).
Consistent with the decline in current marijuana
use among male youths discussed in Chapter 2,
the initiation rate (i.e., the percentage who initiated in the past year among
those who had never used) for male youths declined from 6.3 percent in 2002
to 5.2 percent in 2003 and remained unchanged in 2004 (5.3 percent) (Figure 5.4).
Among female youths, there was no significant change in the incidence over
the 3-year period (6.7, 6.2, and 6.3 percent, respectively).
Figure 5.4 Past Year Marijuana Initiation
among Youths Aged 12 to 17 Who Had Never Used, by Gender: 2002-2004
In 2004, the average age of first marijuana
use among recent initiates was 18.0 years. This average increased from 17.0
years in 2002 and 17.5 years in 2003. Excluding initiation occurring at age
21 or older, the mean ages of initiation were 15.9 years in 2002, 15.9 years
in 2003, and 16.0 years in 2004.
Cocaine
In 2004, an estimated 1.0 million persons
had used cocaine for the first time within the past 12 months—approximately
2,700 per day. This was not significantly different from the number in 2002
(1.0 million) or 2003 (1.0 million).
Most (65.8 percent) of the 1.0 million recent
cocaine initiates were aged 18 or older when they first used. The average
age of first use among recent initiates was 20.0 years, which was similar
to the average age in both 2002 and 2003 (19.8 years).
Heroin
In 2004, an estimated 118,000 persons had
used heroin for the first time within the past 12 months. The average age
of first use among recent initiates was 24.4 years in 2004. There were no
significant changes in the number of initiates or in the average age of first
use from 2002 to 2004.
Hallucinogens
In 2004, an estimated 934,000 persons used
hallucinogens for the first time within the past 12 months. This was not significantly
different from the estimate in 2003 (886,000), but it was lower than the estimate
in 2002 (1.2 million).
Although there was little change between 2003
and 2004 in the number of past year initiates of LSD or Ecstasy, there were
declines between 2002 and 2003. The number of past year LSD initiates was
338,000 in 2002, 200,000 in 2003, and 235,000 in 2004. Ecstasy initiation
was 1.2 million in 2002, 642,000 in 2003, and 607,000 in 2004. Most (57.7
percent) of the recent Ecstasy initiates in 2004 were aged 18 or older at
the time they first used Ecstasy. The average age at initiation of Ecstasy
was 19.5 years.
Inhalants
In 2004, an estimated 857,000 persons had
used inhalants for the first time within the past 12 months. The average age
of first use among recent initiates was 16.0 years in 2004, and 75.0 percent
of recent initiates were under age 18 when they first used. There were no
significant changes in the number of inhalant initiates or the average age
of first use from 2002 to 2004.
Psychotherapeutics
This category includes nonmedical use of any
prescription-type pain reliever, tranquilizer, stimulant, or sedative. Over-the-counter
substances are not included. In 2004, an estimated 2.8 million persons used
psychotherapeutics nonmedically for the first time within the past year. The
numbers of new users of psychotherapeutics in 2004 were 2.4 million for pain
relievers, 1.2 million for tranquilizers, 793,000 for stimulants, and 240,000
for sedatives. These estimates are similar to the corresponding estimates
for 2002 and 2003.
The average age of first nonmedical use of
psychotherapeutics among recent initiates was 24.7 years. For specific drug
classes, the average ages were 23.3 years for pain relievers, 25.2 years for
tranquilizers, 24.1 years for stimulants, and 29.3 years for sedatives.
In 2004, the number of new nonmedical users
of OxyContin® was 615,000, with an average age at first use
of 24.5 years. Comparable data on past year OxyContin® initiation
are not available for prior years, but calendar year estimates of OxyContin®
initiation show a steady increase in the number of initiates from 1995, the
year this drug was first available, through 2003 (Figure 5.5).
Figure 5.5 Annual Numbers of New Nonmedical
Users of OxyContin®: 1995-2003
The number of recent new users of methamphetamine
nonmedically was 318,000 in 2004. Between 2002 and 2004, the number of methamphetamine
initiates remained level at around 300,000 per year. The average age of new
users was 18.9 years in 2002, 20.4 years in 2003, and 22.1 years in 2004.
Alcohol
In 2004, an estimated 4.4 million persons
had used alcohol for the first time within the past 12 months—approximately
12,000 per day. This was significantly greater than in 2002 (3.9 million)
and 2003 (4.1 million).
Most (86.9 percent) of the 4.4 million recent
alcohol initiates were younger than 21 at the time of initiation.
In 2004, the average age of first alcohol
use among recent initiates was 17.5 years. This average age was 16.7 years
in 2002 and 16.5 years in 2003, but these are not statistically different
from the average age of first use in 2004. Excluding initiation occurring
at age 21 or older, the mean ages were 15.5 years in 2002, 15.6 years in 2003,
and 15.6 years in 2004.
Tobacco
The number of persons who smoked cigarettes
for the first time within the past 12 months was 2.1 million in 2004, which
was not significantly different from the estimates for 2002 (1.9 million)
and 2003 (2.0 million). Most new smokers were under age 18 when they first
smoked cigarettes (67.8 percent).
In 2004, the average age of first cigarette
use among recent initiates was 16.7 years. This average was similar to the
averages in 2002 (16.9 years) and 2003 (16.9 years). The average age in 2004
was similar for males (16.6 years) and females (16.8 years).
The initiation rate (i.e., the percentage
of nonsmokers who initiated cigarette use within the past 12 months) was 2.6
percent in 2002, 2003, and 2004. Among youths aged 12 to 17 years, the incidence
showed no significant changes during this period in that it was 6.7 percent
in 2002, 6.6 percent in 2003, and 6.8 percent in 2004. This pattern was observed
for both male and female youths (Figure 5.6).
Figure 5.6 Past Year Cigarette Initiation
among Youths Aged 12 to 17 Who Had Never Smoked, by Gender: 2002-2004
In 2004, the number of persons who had started
smoking cigarettes daily within the past 12 months was 1.1 million, or about
3,000 per day. This estimate is similar to the estimates for 2002 (1.0 million)
and 2003 (1.1 million). An estimated 49.5 percent, or 0.5 million (about 1,500
per day), of these new daily smokers were younger than age 18 when they started
smoking daily.
The average age of first daily smoking among
recent new daily smokers in 2004 was 18.8 years. This was not significantly
different from the average in 2002 (19.9 years) or 2003 (19.8 years), and
the average age did not differ between males (19.0 years) and females (18.6
years) in 2004.
In 2004, an estimated 3.1 million persons
aged 12 or older used cigars for the first time in the past 12 months, a significant
increase in the number of initiates from 2003 (2.7 million) but unchanged
from 2002 (2.9 million). Although in 2004 there were approximately the same
number of past year initiates of cigar use among males and females (1.6 million
and 1.5 million, respectively), females initiated at an older age (22.7 years)
than males (20.1 years). The overall average age at first cigar use was 21.3
years.
The number of persons aged 12 or older initiating
use of smokeless tobacco in the past year was similar in 2002 (951,000), 2003
(928,000), and 2004 (999,000). In 2004, the number of males who were first-time
users of smokeless tobacco in the past 12 months was between 2 and 3 times
higher than the number of females (727,000 vs. 272,000). A similar pattern
was seen in both 2002 and 2003.
The average age of first smokeless tobacco
use among recent initiates in 2004 was 19.7 years. Averages were 19.1 years
for males and 21.3 years for females.
6. Youth Prevention-Related Measures
The National Survey on Drug Use and Health (NSDUH)
includes questions for youths aged 12 to 17 about a number of risk and protective
factors that may affect the likelihood that they will engage in substance use.
Risk factors are individual characteristics and environmental influences associated
with an increased vulnerability to the initiation, continuation, or escalation
of substance use. Protective factors include individual resilience and other
circumstances that appear to reduce the likelihood of substance use. Risk and
protective factors include variables that operate at different stages of development
and reflect different domains of influence, including the individual, family,
peer, school, community, and societal levels (Hawkins, Catalano, & Miller,
1992). Interventions to prevent substance use generally are designed to ameliorate
the influence of risk factors and enhance the effectiveness of protective factors.
This chapter presents findings for youth prevention-related
measures collected in the 2004 NSDUH. Included are measures of perceived risk
from substance use (cigarettes, alcohol, and illicit drugs), perceived availability
of substances, perceived parental disapproval of substance use, feelings about
peer substance use, attitudes about school, involvement in delinquent behavior,
participation in religious and other activities, exposure to substance abuse
prevention messages and programs, and parental involvement.
In this chapter, rates of substance use are compared
for persons responding differently to questions reflecting risk or protective
factors, such as the perceived risk of harm from using a substance. However,
the associations discussed in this chapter should not be inferred to reflect
causal connections. NSDUH data for an individual are collected at only one point
in time, making it impossible to determine, for example, whether a lowering
of perceived risk preceded the substance use or vice versa. It is also not possible
to determine whether observed associations could be explained better by other
factors not considered in the analysis or not measured in the survey.
Perceptions of Risk
One factor thought to influence whether youths
will use tobacco, alcohol, or illicit drugs is the extent to which youths
believe these substances might cause them harm. NSDUH respondents were asked
how much they thought people risk harming themselves physically and in other
ways when they use various substances. Response choices for these items were
"great risk," "moderate risk," "slight risk,"
or "no risk." Substance use was generally higher among persons who
reported lower levels of perceived risk than among those who saw greater risk.
For example, 7.3 percent of youths aged 12 to 17 in 2004 who perceived great
risk from "having 4 or 5 drinks of an alcoholic beverage nearly every
day" reported binge drinking (consumption of five or more drinks of an
alcoholic beverage on a single occasion on at least 1 day in the past 30 days);
by contrast, binge drinking was reported by 17.3 percent of youths who saw
moderate, slight, or no risk from having four or five drinks of an alcoholic
beverage nearly every day (Figure 6.1).
Past month marijuana use was reported by 1.4 percent of youths who saw great
risk in smoking marijuana once a month compared with 11.0 percent of youths
who saw moderate, slight, or no risk.
Figure 6.1 Past Month Binge Drinking and
Marijuana Use among Youths Aged 12 to 17, by Perceptions of Risk: 2004
Increases over time in the perceived risk
of using a substance frequently are associated with concurrent or subsequent
decreases in the rate of use of the substance and vice versa. Looking over
3 years, for example, the proportion of youths who reported perceiving great
risk from smoking one or more packs of cigarettes per day increased from 63.1
percent in 2002 to 67.5 percent in 2004 (Figure 6.2).
Over the same period, the rate of past month cigarette smoking among youths
decreased from 13.0 to 11.9 percent, and the rate of lifetime cigarette smoking
declined from 33.3 to 29.2 percent (Figure 6.3).
Figure 6.2 Perceived Great Risk of Cigarette
and Alcohol Use among Youths Aged 12 to 17: 2002-2004
The perceived risk of heavy alcohol use remained
stable from 2002 to 2004 based on two measures (Figure 6.2).
The percentages of youths aged 12 to 17 who reported that they perceived great
risk in having five or more drinks of an alcoholic beverage once or twice
a week were 38.2 percent in 2002, 38.5 percent in 2003, and 38.1 percent in
2004.
Declines were seen from 2003 to 2004 in the
perceived risk of cocaine and heroin use (Figure 6.4).
The perception of great risk in using cocaine once a month decreased from
51.4 percent in 2003 to 49.6 percent in 2004, and the perception of great
risk from trying heroin once or twice a week declined from 58.8 to 57.0 percent.
The prevalence of heroin and cocaine use remained stable from 2003 to 2004
among youths aged 12 to 17. In both 2003 and 2004, an estimated 0.1 percent
of youths reported using heroin in the past month, while past month cocaine
use was reported by 0.6 percent in 2003 and 0.5 percent in 2004.
Figure 6.4 Perceived Great Risk of Use of
Selected Illicit Drugs among Youths Aged 12 to 17: 2002-2004
Looking over a 3-year period, the perceived
risk from smoking marijuana once a month increased from 32.4 percent in 2002
to 34.9 percent in 2003, then remained stable at 35.0 percent in 2004. The
perception of great risk in smoking marijuana once or twice a week increased
from 51.5 percent in 2002 to 54.4 percent in 2003, then remained stable at
54.7 percent in 2004 (Figure 6.4).
From 2002 to 2004, there were declines in marijuana use in the lifetime (from
20.6 to 19.0 percent) and in the past year (from 15.8 to 14.5 percent) (Figure 6.5).
Figure 6.5 Lifetime, Past Year, and Past
Month Marijuana Use among Youths Aged 12 to 17: 2002-2004
For some drugs, the perceived risk of use
decreased as youths got older, but for other drugs it increased. In 2004,
the perception of great risk from smoking marijuana once a month decreased
with age; it was reported by 44.5 percent of youths aged 12 or 13, 34.1 percent
of those aged 14 or 15, and 26.2 percent of those aged 16 or 17 (Figure 6.6).
For cocaine, on the other hand, perceived risk increased with age. In 2004,
43.0 percent of youths aged 12 or 13, 48.6 percent of those aged 14 or 15,
and 57.4 percent of those aged 16 or 17 reported that they perceived great
risk in using cocaine once a month.
Figure 6.6 Perceived Great Risk of Marijuana,
Cocaine, Alcohol, and Cigarette Use among Youths Aged 12 to 17, by Age:
2004
For many substances, female youths were more
likely to report perceptions of great risk than male youths. This is true,
for instance, for smoking one or more packs of cigarettes per day (72.3 percent
for females vs. 62.9 percent for males), smoking marijuana once or twice a
week (58.4 vs. 51.1 percent), and having four or five drinks of alcohol nearly
every day (67.4 vs. 56.4 percent).
As noted in Chapter 2,
past month use of marijuana declined from 2002 to 2004 for males aged 12 to
17 (from 9.1 to 8.1 percent), but remained stable for females in that age
group (7.2 percent in 2002 and 7.1 percent in 2004). Over that period, the
percentage of youths who perceived great risk from smoking marijuana once
a month increased for both male and female youths. As shown in
Figure 6.7, the rates of perceiving
great risk among female youths were 34.1 percent in 2002, 36.7 percent in
2003, and 37.4 percent in 2004. Among male youths, the rates were 30.7 percent
in 2002, 33.2 percent in 2003, and 32.6 percent in 2004. For both groups,
the increases were significant between 2002 and 2003 and between 2002 and
2004, but not between 2003 and 2004. Still, perceived risk was higher for
females than males, while the rate of past month use was higher for males
than females.
Figure 6.7 Perceived Great Risk of Smoking
Marijuana Once a Month among Youths Aged 12 to 17, by Gender: 2002-2004
Over half (52.2 percent) of youths aged 12
to 17 reported in 2004 that it would be "fairly easy" or "very
easy" for them to obtain marijuana if they wanted some (Figure 6.8).
Around one quarter reported it would be easy to get cocaine (24.4 percent)
or crack (25.0 percent). One in seven (14.0 percent) indicated that heroin
would be "fairly" or "very" easily available, and one
in six (16.9 percent) said it would be easy for them to get LSD if they wanted
some.
Figure 6.8 Perceived Availability of Selected
Illicit Drugs among Youths Aged 12 to 17: 2002-2004
The perceived availability of marijuana declined
each year from 2002 to 2004 among youths aged 12 to 17, while the perceived
availability of crack and heroin only declined from 2003 to 2004. The perceived
availability of marijuana decreased from 55.0 percent in 2002 to 53.6 percent
in 2003 and to 52.2 percent in 2004. The perceived availability of crack declined
from 26.2 percent in 2003 to 25.0 percent in 2004, and the proportion who
reported that heroin would be easily available decreased from 15.3 to 14.0
percent. Perceived LSD availability declined from 19.4 percent in 2002 to
17.6 percent in 2003, then remained relatively stable between 2003 and 2004
(16.9 percent in 2004).
The decline in the perceived availability
of marijuana among youths aged 12 to 17 was paralleled by a decline in lifetime
and past year marijuana use among youths. As discussed earlier in the chapter,
lifetime marijuana use for youths decreased from 20.6 percent in 2002 to 19.0
percent in 2004, and past year use decreased from 15.8 to 14.5 percent over
that period (Figure 6.5).
During this time period, the perceived availability of marijuana decreased
from 55.0 to 52.2 percent (Figure 6.8).
Similarly, lifetime and past year use of LSD declined from 2002 to 2004 in
parallel to the decrease in perceived availability of LSD. Lifetime use of
LSD by youths aged 12 to 17 decreased from 2.7 percent in 2002 to 1.2 percent
in 2004; past year use of this hallucinogen decreased from 1.3 to 0.6 percent
over that 3-year period. The perceived ease of availability of LSD decreased
from 19.4 percent in 2002 to 16.9 percent in 2004.
The percentage of youths who reported that
drugs would be easy to obtain if they wanted some increased with age. In 2004,
22.4 percent of those aged 12 or 13 said it would be fairly or very easy to
obtain marijuana compared with 57.2 percent of those aged 14 or 15 and 76.8
percent of those aged 16 or 17.
In 2004, 16.3 percent of youths indicated
that they had been approached by someone selling drugs in the past month,
similar to the 16.1 percent reported in 2003 and the 16.7 percent in 2002.
Youths who reported being approached by someone selling drugs, compared with
those who reported no such approaches, were much more likely to have used
an illicit drug in their lifetime (64.1 vs. 23.4 percent), in the past year
(52.7 vs. 14.9 percent), and in the past month (32.6 vs. 6.3 percent).
Perceived Parental Disapproval of Substance
Use
Most youths believed their parents would "strongly
disapprove" of their using substances. In 2004, 90.6 percent of youths
aged 12 to 17 reported that their parents would strongly disapprove of their
smoking one or more packs of cigarettes per day, while the remaining 9.4 percent
believed their parents would "somewhat disapprove" or "neither
approve nor disapprove." A majority of youths (89.8 percent) reported
that their parents would strongly disapprove of their trying marijuana or
hashish once or twice, and 89.0 percent reported their parents would strongly
disapprove of their having one or two drinks of an alcoholic beverage nearly
every day. These rates of perceived parental disapproval in 2004 were similar
to those seen in 2002 and 2003.
Youths who believed their parents would strongly
disapprove of their using a particular substance were less likely to engage
in use of that substance than were youths who believed their parents would
somewhat disapprove or neither approve nor disapprove. For example, past month
cigarette use was reported by 8.8 percent of youths who perceived strong parental
disapproval of their smoking one or more packs of cigarettes per day compared
with 42.2 percent of youths who believed their parents would not strongly
disapprove. Current marijuana use also was much less prevalent among youths
who perceived strong parental disapproval for trying marijuana or hashish
once or twice than for those who did not (5.1 vs. 30.0 percent).
Feelings about Peer Substance Use
A large majority of youths reported that they
disapprove of their peers using substances. In 2004, 88.1 percent of youths
aged 12 to 17 "strongly" or "somewhat" disapproved of
their peers smoking one or more packs of cigarettes per day; 80.6 percent
reported similar feelings about their peers trying marijuana or hashish once
or twice; and 85.0 percent strongly or somewhat disapproved of peers having
one or two drinks of an alcoholic beverage nearly every day. These rates are
similar to those observed in 2003.
The percentage disapproving of peers' substance
use generally decreased with age. In 2004, disapproval of peers using marijuana
once a month or more, for example, was reported by 92.1 percent of youths
aged 12 or 13, 81.3 percent of those aged 14 or 15, and 71.3 percent of those
aged 16 or 17 (Figure 6.9).
Figure 6.9 Disapproval of Peer Substance
Use among Youths Aged 12 to 17, by Age: 2004
Past month marijuana use was reported by 2.7
percent of youths who disapproved of their peers using marijuana once a month
or more compared with 29.2 percent of youths who reported that they neither
approve nor disapprove of such behavior from their peers.
Attitudes about School
Most youths aged 12 to 17 who reported being
currently enrolled in school had positive perceptions about school. In 2004,
78.6 percent indicated that they "liked going to school a lot" or
"kind of liked going to school"; 77.7 percent believed the assigned
homework was meaningful and important; 88.4 percent believed the things they
learned at school would be "very important" or "somewhat important"
later in life; and 75.3 percent found the courses "very" or "somewhat"
interesting. These rates were similar to those observed in 2002 and 2003.
An estimated 77.5 percent of youths in 2004 indicated that their teachers
"always" or "sometimes" let them know they were doing
a good job with schoolwork; this was unchanged from 2003 but was higher than
the 75.7 percent observed in 2002.
In general, youths who reported positive attitudes
about school were less likely than other youths to have used substances. Past
month marijuana use in 2004, for example, was reported by 6.0 percent of youths
who reported they "liked a lot" or "kind of liked" going
to school compared with 14.6 percent of those who reported they "didn't
like very much" or "hated" it. Moreover, past month marijuana
use was reported by 5.8 percent of youths who found assigned schoolwork meaningful
and important as compared with 14.8 percent of those who did not. It also
was reported by 6.7 percent of those who believed the things they learned
in school would be important later in life as compared with 16.3 percent of
those who did not.
Fighting and Delinquent Behavior
In 2004, 23.1 percent of youths aged 12 to
17 reported that, in the past year, they had gotten into a serious fight at
school or at work; 17.0 percent had taken part in a group-against-group fight;
3.3 percent had carried a handgun at least once; 3.8 percent had sold illegal
drugs; 4.5 percent had, at least once, stolen or tried to steal something
worth more than $50; and 8.2 percent had, in at least one instance, attacked
others with intent to seriously hurt them. For all but one of these measures,
the rate in 2004 was similar to that observed in 2003. The exception was the
percentage of youths who had taken part in group-against-group fights, which
increased from 15.9 percent in 2002 to 18.1 percent in 2003 then decreased
to 17.0 percent in 2004.
Youths who had engaged in fighting or other
delinquent behaviors were more likely than other youths to have used illicit
drugs. For example, past month illicit drug use was reported by 18.9 percent
of youths who had gotten into serious fights at school or work compared with
8.1 percent of those who had not and by 40.9 percent of those who had stolen
or tried to steal something worth over $50 compared with 9.1 percent of those
who had not (Figure 6.10).
Figure 6.10 Past Month Illicit Drug Use
among Youths Aged 12 to 17, by Participation in Criminal Acts or Fighting
in Past Year: 2004
In 2004, 32.0 percent of youths aged 12 to
17 reported that they had attended religious services 25 or more times in
the past year; 77.0 percent expressed agreement with the statement that religious
beliefs are a very important part of their lives; 68.0 percent agreed with
the statement that religious beliefs influence how they make decisions in
life; and 34.1 percent agreed with the statement that it is important for
their friends to share their religious beliefs. Findings for these measures
remained stable from 2003 to 2004. Drug, alcohol, and cigarette use were lower
among youths who agreed with these statements than among those who disagreed.
For example, past month illicit drug use was reported by 8.1 percent of those
who agreed that religious beliefs are a very important part of life compared
with 18.5 percent of those who disagreed with that statement.
Exposure to Substance Use Prevention Messages
and Programs
One in eight youths (12.2 percent) reported
in 2004 that they had participated in drug, tobacco, or alcohol prevention
programs outside of school in the past year. Participation in such programs
increased from 12.7 percent of youths in 2002 to 13.9 percent in 2003, but
then declined to 12.2 percent in 2004. The prevalence of alcohol use was generally
lower among youths who reported participating in these programs than among
youths who did not; for example, past month binge drinking was reported by
9.5 percent of youths who had participated in such programs compared with
11.3 percent of those who had not. However, rates of illicit drug use did
not differ significantly between the two groups (e.g., past month marijuana
use was reported by 7.9 percent of those who had participated in prevention
programs outside of school and by 7.5 percent of those who had not participated
in these types of programs).
In 2004, 60.3 percent of youths aged 12 to
17 reported that they had talked at least once in the past year with at least
one of their parents about the dangers of drug, tobacco, or alcohol use; this
rate represents an increase from the 2003 rate of 58.9 percent and the 2002
rate of 58.1 percent. Among youths who reported having had such conversations
with their parents, rates of current alcohol and cigarette use and past year
and lifetime use of alcohol, cigarettes, and illicit drugs were lower than
among youths who did not report such conversations. For example, past month
binge drinking was reported by 10.5 percent of youths who had talked with
their parents about drug, tobacco, or alcohol use compared with 12.0 percent
of those who had not. Past month use of illicit drugs other than marijuana
was reported by 4.6 percent of youths who had such conversations with their
parents compared with 6.3 percent of those who had not.
Almost four fifths (78.2 percent) of youths
enrolled in school reported in 2004 they had seen or heard drug or alcohol
prevention messages at school in the past year, a percentage similar to that
observed in 2002 and 2003. Indicators of alcohol, cigarette, and illicit drug
use were uniformly lower for youths exposed to such messages in school than
for youths not reporting such exposure. Past month use of marijuana, for example,
was reported by 7.1 percent of youths exposed to these messages at school
compared with 10.6 percent of youths reporting no such exposure.
Out-of-school exposure to drug or alcohol
prevention messages in the past year was reported by 83.0 percent of youths
aged 12 to 17 in 2004, a percentage similar to that in 2002 and 2003. Most
indicators of current alcohol and drug use were similar for youths exposed
to such out-of-school messages and those reporting no such exposure. However,
past month use of illicit drugs was lower among those who were exposed than
among those not exposed (10.3 vs. 11.8 percent).
Parental Involvement
Youths aged 12 to 17 were asked a number of
questions related to the extent of support, oversight, and control they perceived
their parents exercised over them in the year prior to the survey. In 2004,
79.6 percent of youths reported that their parents "always" or "sometimes"
checked on whether they had completed their homework, an increase from 78.1
percent in 2003. Among youths, 80.8 percent indicated that their parents always
or sometimes provided help with their homework in 2004, similar to the 80.9
percent in 2003. Also, 69.6 percent reported that their parents always or
sometimes limited the amount of time they spent out with friends on school
nights, similar to the 70.6 percent in 2003. Most (87.2 percent in 2004) said
their parents made them do chores around the house, similar to the 87.4 percent
in 2003. In 2004, an estimated 38.1 percent reported that their parents limited
the amount of time they watched television, similar to the 37.4 percent in
2003. Most (85.8 percent in 2004) said their parents always or sometimes let
them know they had done a good job, which was unchanged from 2003.
In 2004, drug, alcohol, and cigarette use
was uniformly lower among youths who reported that their parents always or
sometimes engaged in these monitoring behaviors than among youths whose parents
"seldom" or "never" engaged in such behaviors. For instance,
for parental assistance with homework, rates of past month marijuana use were
6.2 percent for youths whose parents always or sometimes helped compared with
14.7 percent among youths indicating their parents seldom or never helped.
Rates for current cigarette smoking were 10.1 and 21.3 percent for the two
groups of youths, respectively, and rates of binge drinking were 9.5 versus
19.3 percent.
7. Substance Dependence, Abuse,
and Treatment
The National Survey on Drug Use and Health (NSDUH)
includes a series of questions to assess the prevalence of substance use disorders
(i.e., dependence on or abuse of a substance) in the past 12 months. Substances
include alcohol and illicit drugs, such as marijuana, cocaine, heroin, hallucinogens,
and inhalants, and nonmedical use of prescription-type drugs. These questions
are used to classify persons as dependent or abusing specific substances based
on criteria specified in the Diagnostic and Statistical Manual of Mental
Disorders, 4th edition (DSM-IV) (American Psychiatric Association
[APA], 1994). The questions on dependence ask about health and emotional problems
associated with substance use, unsuccessful attempts to cut down on use, tolerance,
withdrawal, reducing other activities to use substances, spending a lot of time
engaging in activities related to substance use, or using the substance in greater
quantities or for a longer time than intended. The questions on abuse ask about
problems at work, home, and school; problems with family or friends; physical
danger; and trouble with the law due to substance use. Dependence is considered
to be a more severe substance use problem than abuse. Although individuals may
meet the criteria specified for both dependence and abuse, persons are classified
with abuse of a particular substance only if they are not classified as dependent
on that substance.
This chapter provides estimates of the prevalence
and patterns of substance use disorders in the Nation from the 2004 NSDUH and
compares these estimates against the results from the 2002 and 2003 NSDUHs.
It also provides estimates of the prevalence and patterns of the receipt of
treatment for problems related to substance use and discusses the need for and
receipt of treatment at specialty facilities for problems associated with substance
use.
7.1 Substance Dependence and Abuse
An estimated 22.5 million persons aged 12
or older in 2004 were classified with substance dependence or abuse in the
past year (9.4 percent of the total population) (Figure 7.1).
Of these, 3.4 million were classified with dependence on or abuse of both
alcohol and illicit drugs, 3.9 million were dependent on or abused illicit
drugs but not alcohol, and 15.2 million were dependent on or abused alcohol
but not illicit drugs.
Figure 7.1 Substance Dependence or Abuse
among Persons Aged 12 or Older: 2002-2004
Between 2002 and 2004, there was no change
in the number of persons with substance dependence or abuse (22.0 million
in 2002, 21.6 million in 2003, and 22.5 million in 2004).
Of the 7.3 million persons classified with
dependence on or abuse of illicit drugs (regardless of dependence on or abuse
of alcohol), 4.5 million were dependent on or abused marijuana in 2004. This
represents 1.9 percent of the total population aged 12 or older and 61.2 percent
of all those classified with illicit drug dependence or abuse.
In 2004, 67.8 percent (0.3 million) of past
year heroin users were classified with dependence on or abuse of heroin (Figure 7.2).
Among past year users of cocaine, 27.8 percent (1.6 million) were classified
with dependence on or abuse of cocaine. Among past year users of marijuana,
17.6 percent (4.5 million) were classified with dependence on or abuse of
marijuana, while 12.3 percent (1.4 million) of past year users of pain relievers
were classified with dependence on or abuse of pain relievers.
Figure 7.2 Dependence on or Abuse of Specific
Substances among Past Year Users of Substances: 2004
There were 18.7 million persons aged 12 or
older classified with dependence on or abuse of alcohol in 2004 (7.8 percent).
Among past year users of alcohol, 11.9 percent were classified with alcohol
dependence or abuse.
There were no changes between 2002 and 2004
in the estimated percentages of the population with dependence on or abuse
of illicit drugs (3.0 percent in 2002, 2.9 percent in 2003, and 3.0 percent
in 2004) and dependence on or abuse of alcohol (7.7 percent in 2002, 7.5 percent
in 2003, and 7.8 percent in 2004). However, there was a decrease in the rate
of dependence on or abuse of hallucinogens from 2002 to 2003 (0.2 to 0.1 percent)
and an increase from 2003 to 2004 (0.1 to 0.2 percent).
Age at First Use
In 2004, adults who had first used substances
at a younger age were more likely to be classified with dependence or abuse
than adults who initiated use at a later age. For example, among adults aged
18 or older who first tried marijuana at age 14 or younger, 13.4 percent were
classified with illicit drug dependence or abuse compared with only 2.7 percent
of adults who had first used marijuana at age 18 or older. This pattern of
higher rates of dependence or abuse among persons initiating their use of
marijuana at younger ages was observed among all demographic subgroups analyzed.
Among adults, a similar pattern was observed
between age at first use of alcohol and dependence on or abuse of alcohol.
Among adults aged 18 or older who first tried alcohol at age 14 or younger,
17.9 percent were classified with alcohol dependence or abuse compared with
only 4.1 percent of adults who had first used alcohol at age 18 or older.
Adults aged 21 or older who had first used alcohol before reaching 21 also
were more likely than adults who had their first drink at age 21 or older
to be classified with alcohol dependence or abuse (9.6 vs. 2.7 percent).
Age
Rates of substance dependence or abuse in
2004 showed substantial variation by age. The rate for dependence or abuse
was 1.3 percent at age 12, and rates generally increased until the highest
rate (25.4 percent) at age 21. After age 21, there was a general decline with
age. A similar pattern by age was observed in 2002 and 2003.
In 2004, the rate of substance dependence
or abuse was 8.8 percent for youths aged 12 to 17, 21.2 percent for persons
aged 18 to 25, and 7.3 percent for persons aged 26 or older (Figure 7.3).
Among persons with substance dependence or abuse, 60.5 percent of youths aged
12 to 17, 39.2 percent of young adults aged 18 to 25, and 24.3 percent of
adults aged 26 or older were dependent on or abused illicit drugs.
Figure 7.3 Illicit Drug or Alcohol Dependence
or Abuse, by Age Group and Substance: 2002-2004
Similar to previous years, in 2004, males
aged 12 or older were twice as likely to be classified with substance dependence
or abuse as females (12.7 vs. 6.2 percent) (Figure 7.4).
Among youths aged 12 to 17, however, the rate of substance dependence or abuse
among males (8.7 percent) was similar to the rate among females (9.0 percent).
Figure 7.4 Illicit Drug or Alcohol Dependence
or Abuse, by Age and Gender: 2004
Among persons aged 12 or older in 2004, the
rate of substance dependence or abuse was highest among American Indians or
Alaska Natives (20.2 percent). The next highest rates were among persons reporting
two or more races (12.2 percent). Asians had the lowest rate of dependence
or abuse (4.7 percent). The rates among Hispanics (9.8 percent) and whites
(9.6 percent) were higher than the rate among blacks (8.3 percent).
Between 2003 and 2004, there were no statistically
significant changes in the rates of substance dependence or abuse for any
racial/ethnic group.
Education/Employment
Rates of substance dependence or abuse varied
with level of education. Among adults aged 18 or older in 2004, those who
graduated from high school but did not attend any college and those who graduated
from college had the lowest rates of dependence or abuse (9.1 and 8.2 percent
respectively), while those who were not high school graduates and those with
some college had higher rates (10.3 and 10.5 percent, respectively).
Rates of substance dependence or abuse varied
with current employment status. In 2004, an estimated 19.9 percent of unemployed
adults aged 18 or older were classified with dependence or abuse, while 10.5
percent of full-time employed adults and 11.9 percent of part-time employed
adults were classified as such.
Most adults with substance dependence or abuse
in 2004 were employed either full or part time. Of the 20.3 million adults
classified with dependence or abuse, 15.7 million (77.6 percent) were employed.
Criminal Justice Populations
In 2004, adults aged 18 or older who were
on parole or a supervised release from jail during the past year were more
likely to be classified with dependence on or abuse of a substance (40.8 percent)
than those who were not on parole or supervised release during the past year
(9.2 percent).
In 2004, probation status also was associated
with substance dependence or abuse. The rate of substance dependence or abuse
was 38.5 percent among adults who were on probation during the past year,
while the rate was only 8.8 percent among adults who were not on probation
during the past year.
Geographic Area
Rates of substance dependence or abuse for
persons aged 12 or older varied by region. Rates were higher in the Midwest
(10.2 percent) and West (10.1 percent) and lower in the Northeast (8.9 percent)
and South (8.5 percent).
In 2004, among persons aged 12 or older, the
rate for substance dependence or abuse was 9.5 percent in large metropolitan
counties, 9.8 percent in small metropolitan counties, and 8.2 percent in nonmetropolitan
counties (Figure 7.5).
The rate was lowest (7.0 percent) in completely rural nonmetropolitan counties.
Figure 7.5 Illicit Drug or Alcohol Dependence
or Abuse among Persons Aged 12 or Older, by County Type: 2002-2004
7.2 Past Year Treatment for a Substance Use
Problem
Estimates described in this section refer to
treatment received to reduce or stop illicit drug or alcohol use, or for medical
problems associated with the use of illicit drugs or alcohol. This includes
treatment received in the past year at any location, such as a hospital (inpatient),
rehabilitation facility (outpatient or inpatient), mental health center, emergency
room, private doctor's office, prison or jail, or a self-help group, such as
Alcoholics Anonymous or Narcotics Anonymous. Note that the definition of treatment
in this section is different from the definition of specialty treatment described
in Section 7.3.
Specialty treatment only includes treatment at a hospital (inpatient), a rehabilitation
facility (inpatient or outpatient), or a mental health center.
An estimated 3.8 million people aged 12 or
older (1.6 percent of the population) received some kind of treatment for
a problem related to the use of alcohol or illicit drugs in 2004. Of these,
1.5 million received treatment for the use of both alcohol and illicit drugs,
0.7 million received treatment for the use of illicit drugs but not alcohol,
and 1.2 million received treatment for the use of alcohol but not illicit
drugs. (Note that estimates by substance do not add to the total number of
persons receiving treatment because the total includes persons who reported
receiving treatment but did not report for which substance the treatment was
received.)
Between 2003 and 2004, there was no statistically
significant change in the number or percentage of the population receiving
substance use treatment within the past year (3.3 million, 1.4 percent in
2003; 3.8 million, 1.6 percent in 2004). The number receiving treatment for
illicit drug use was significantly higher in 2004 (2.2 million) than in 2003
(1.8 million), but it was not significantly different than in 2002 (2.0 million).
Age, Gender, and Race/Ethnicity
Among persons aged 12 or older in 2004, males
were more than twice as likely as females to receive treatment for an alcohol
or an illicit drug use problem in the past year (2.3 vs. 0.9 percent, respectively).
Males and females had similar rates of treatment among youths aged 12 to 17
(1.8 vs. 1.4 percent).
Among persons aged 12 or older in 2004, the
rates of alcohol or illicit drug use treatment in the past year were highest
among American Indians or Alaska Natives (4.6 percent) and persons reporting
two or more races (3.2 percent). The next highest rate was among blacks (2.6
percent). The rates among whites and Hispanics were similar (1.4 and 1.6 percent,
respectively). The lowest rate was among Asians (1.0 percent).
The rate of past year treatment for illicit
drug use was significantly higher in 2004 (0.8 percent) than in 2003 (0.6
percent) among persons aged 26 or older, but it was similar to the rate in
2002 (0.7 percent).
Geographic Area
The rate of past year treatment for illicit
drug or alcohol use did not vary greatly by region. The rate was essentially
the same in the West and South (1.6 percent) and was 1.7 percent in the Midwest
and 1.5 percent in the Northeast.
In 2004, among persons aged 12 or older, the
rate of treatment for illicit drug or alcohol use was 1.6 percent in both
large and small metropolitan counties and 1.5 percent in nonmetropolitan counties.
Location of Treatment and Substance Treated
In 2004, among the 3.8 million persons aged
12 or older who received treatment for alcohol or illicit drug use in the
past year, more than half (2.1 million) received treatment at a self-help
group (Figure 7.6).
There were 1.7 million persons who received treatment at a rehabilitation
facility as an outpatient, 982,000 at a mental health center as an outpatient,
947,000 at a rehabilitation facility as an inpatient, 775,000 at a hospital
as an inpatient, 490,000 at a private doctor's office, 453,000 at an emergency
room, and 310,000 at a prison or jail. (Note that persons could report receiving
treatment at more than one location.)
Figure 7.6 Locations Where Past Year Substance
Use Treatment Was Received among Persons Aged 12 or Older: 2004
The numbers of persons receiving treatment
at specific locations in 2004 were generally higher than the numbers receiving
treatment at the corresponding specific locations in 2003. However, these
increases were only statistically significant for outpatient rehabilitation
(1.2 million in 2003 vs. 1.7 million in 2004) and emergency rooms (251,000
vs. 453,000). With the exception of inpatient rehabilitation (1.1 million
in 2002 vs. 947,000 in 2004), all of the estimates for 2004 were similar to
the corresponding numbers receiving treatment in 2002. The similarities between
the 2002 and 2004 estimates may be attributed to significant decreases observed
for several locations between 2002 and 2003, which offset the increases between
2003 and 2004 discussed above.
More than half (2.4 million) of the 3.8 million
persons who received treatment for a substance use problem in the past year
received treatment for alcohol use during their most recent treatment. An
estimated 1.0 million persons received treatment for marijuana use during
their most recent treatment. Estimates for other drugs were 884,000 persons
for cocaine, 424,000 for pain relievers, and 283,000 for heroin. (Note that
respondents could indicate that they received treatment for more than one
substance during their most recent treatment.)
The estimated number of persons receiving
treatment for cocaine use during their most recent treatment was higher in
2004 (884,000) than in 2003 (557,000), but it was similar to the estimate
in 2002 (796,000).
7.3 Needing and Receiving Specialty Treatment
This section discusses the need for and receipt
of treatment for a substance use problem at a "specialty" treatment
facility. It includes estimates of the number of persons needing and receiving
treatment, as well as those needing but not receiving treatment. These estimates
are specified separately for alcohol, illicit drugs, and illicit drugs or alcohol.
Specialty treatment is defined as treatment received at hospitals (inpatient
only), drug or alcohol rehabilitation facilities (inpatient or outpatient),
or mental health centers. It excludes treatment at an emergency room, private
doctor's office, self-help groups, prison or jail, or hospital as an outpatient.
An individual is defined as needing treatment for an alcohol or drug use problem
if he or she met the diagnostic criteria for dependence on or abuse of alcohol
or illicit drugs in the past 12 months or received specialty treatment for alcohol
or illicit drug use in the past 12 months.
An individual needing treatment for an illicit
drug use problem is defined as receiving treatment for his or her drug use problem
only if he or she reported receiving specialty treatment for drug use in the
past year. Thus, an individual who needed treatment for illicit drug use but
only received specialty treatment for alcohol use in the past year was not counted
as receiving treatment for drug use. Similarly, an individual who needed treatment
for an alcohol use problem who only received specialty treatment for drug use
was not counted as receiving alcohol use treatment. Individuals who reported
receiving specialty substance use treatment but were missing information on
whether the treatment was specifically for alcohol or drug use were not counted
in estimates of specialty drug use treatment or in estimates of specialty alcohol
treatment; however, they were counted in estimates for "drug or alcohol
use" treatment.
In 2004, the estimated number of persons aged
12 or older needing treatment for an alcohol or illicit drug use problem was
23.48 million (9.8 percent of the total population) (Figure 7.7).
An estimated 2.33 million of these people (1.0 percent of the total population
and 9.9 percent of the people who needed treatment) received treatment at
a specialty facility. Thus, there were 21.15 million persons (8.8 percent
of the total population) who needed treatment but did not receive treatment
at a specialty substance abuse facility in 2004.
Figure 7.7 Need for and Receipt of Specialty
Treatment in the Past Year for Illicit Drug or Alcohol Use among Persons
Aged 12 or Older: 2002-2004
The estimated number of persons needing but
not receiving treatment for a substance use problem was slightly higher in
2004 (21.1 million) than in 2003 (20.3 million), but this difference was not
statistically significant. The estimate of the number receiving specialty
treatment in 2004 (2.3 million) was significantly higher than the estimate
in 2003 (1.9 million), but it was essentially the same as the estimate in
2002 (2.3 million). The overall number needing treatment was higher in 2004
(23.5 million) than in 2003 (22.2 million).
Of the 2.3 million people aged 12 or older
who received specialty substance use treatment, 718,000 persons received treatment
for both alcohol and illicit drug use, 817,000 persons received treatment
for alcohol use only, and 709,000 persons received treatment for illicit drugs
use only. (Note that estimates by substance do not add to the total number
of persons receiving specialty substance use treatment because the total includes
persons who reported receiving specialty treatment but did not report for
which substance the treatment was received.)
Among persons who received specialty substance
use treatment in the past year, an estimated 43.1 percent reported using their
"own savings or earnings" as a source of payment for their most
recent specialty treatment. An estimated 38.0 percent reported using private
health insurance, 29.0 percent reported Medicaid, and 22.8 percent reported
Medicare as a source of payment. An estimated 22.4 percent reported using
public assistance other than Medicaid, and 21.2 percent reported relying on
family members. (Note that persons could report more than one source of payment.)
In 2004, more than half of the 2.3 million
persons aged 12 or older who received specialty substance use treatment in
the past year also received treatment at a self-help group (1.5 million persons).
In addition, an estimated 416,000 received treatment at an emergency room,
303,000 received treatment at a doctor's office, and 240,000 received treatment
at a prison or jail.
Of the 21.1 million people who needed but
did not receive treatment in 2004, an estimated 1.2 million (5.8 percent)
reported that they felt they needed treatment for their alcohol or drug use
problem (Figure 7.8).
Of the 1.2 million persons who felt they needed treatment, 441,000 (35.8 percent)
reported that they made an effort but were unable to get treatment, and 792,000
(64.2 percent) reported making no effort to get treatment.
Figure 7.8 Past Year Perceived Need and
Effort Made to Receive Specialty Treatment among Persons Aged 12 or Older
Needing But Not Receiving Treatment for Illicit Drug or Alcohol Use: 2004
The number of people who felt they needed
treatment and made an effort to get it among those who needed but did not
receive treatment was higher in 2004 (441,000) than in 2003 (273,000), but
it was similar to the number in 2002 (446,000).
Similar to 2002 and 2003, in 2004 there were
2.3 million youths aged 12 to 17 (9.1 percent of this population) who needed
treatment for an alcohol or illicit drug use problem. Of this group, only
185,000 youths received treatment at a specialty facility (8.1 percent of
youths who needed treatment), leaving an estimated 2.1 million youths who
needed treatment for a substance use problem but did not receive it at a specialty
facility.
Based on 2003-2004 combined data, the
most often reported reasons for not receiving illicit drug or alcohol use
treatment among persons who needed but did not receive treatment and felt
they needed treatment were not ready to stop using (40.0 percent), cost or
insurance barriers (34.5 percent), stigma (21.6 percent), and did not feel
the need for treatment (at the time) or could handle the problem without treatment
(13.9 percent).
Based on 2003-2004 combined data, among
persons who needed but did not receive illicit drug or alcohol use treatment,
felt they needed treatment, and made an effort to receive treatment, the most
often reported reasons for not receiving treatment were cost or insurance
barriers (42.5 percent), not ready to stop using (25.3 percent), other access
barriers (21.5 percent), and stigma (17.8 percent) (Figure 7.9).
Figure 7.9 Reasons for Not Receiving Treatment
among Persons Aged 12 or Older Who Needed and Made an Effort to Get Treatment
But Did Not Receive Treatment and Felt They Needed Treatment: 2003-2004
Combined
Persons who made no effort to receive treatment
were more likely to report that they were not ready to stop using (46.8 percent)
as a reason for not receiving treatment than persons who made an effort to
receive treatment (25.3 percent) (2003-2004 combined data). Among those
who made no effort to receive treatment, 23.3 percent reported stigma and
30.8 percent reported cost and insurance barriers as reason for not receiving
treatment.
Illicit Drug Use Treatment and Treatment Need
In 2004, the estimated number of persons aged
12 or older needing treatment for an illicit drug use problem was 8.1 million
(3.3 percent of the total population). An estimated 1.4 million of these people
(0.6 percent of the total population and 17.7 percent of the people who needed
treatment) received treatment at a specialty facility for an illicit drug
problem. Thus, there were 6.6 million persons (2.8 percent of the total population)
who needed treatment but did not receive treatment at a specialty facility
for an illicit drug problem in 2004.
The estimated number of persons needing but
not receiving specialty treatment for an illicit drug use problem in 2004
(6.6 million) was slightly higher than the estimate for 2003 (6.2 million),
but this difference was not statistically significant. However, there were
significant increases in the number of persons needing treatment and in the
number of persons receiving specialty treatment for an illicit drug use problem.
Between 2003 and 2004, the number of persons needing treatment increased from
7.3 million to 8.1 million, and the number receiving specialty treatment increased
from 1.1 million to 1.4 million. The number needing treatment in 2002 was
7.7 million, not significantly different from the estimates in 2003 or 2004.
Between 2002 and 2003, there was a decrease in the number of persons receiving
specialty treatment for an illicit drug use problem (1.4 million in 2002 to
1.1 million in 2003). The changes in the number of persons receiving specialty
treatment for an illicit drug use problem between 2002 and 2003, and between
2003 and 2004, were driven by changes among persons aged 26 or older (983,000
in 2002, 649,000 in 2003, and 941,000 in 2004).
Between 2003 and 2004, the number of persons
receiving treatment for a cocaine use problem during their most recent treatment
at a specialty facility increased from 276,000 in 2003 to 466,000 in 2004.
This was a change from the decline between 2002 and 2003 in the number of
persons receiving treatment for a cocaine use problem during their most recent
treatment at a specialty facility (471,000 in 2002; 276,000 in 2003).
Of the 6.6 million people who needed but did
not receive specialty treatment for illicit drug use in 2004, an estimated
598,000 (9.0 percent) reported that they felt they needed treatment for their
illicit drug use problem. Of the 598,000 persons who felt they needed treatment,
194,000 (32.4 percent) reported that they made an effort but were unable to
get treatment, and 404,000 (67.6 percent) reported making no effort to get
treatment.
Among persons needing but not receiving treatment
for an illicit drug use problem, the estimated number who felt they needed
treatment was higher in 2004 (598,000) than in 2003 (426,000). In 2002, the
number of persons who felt they needed illicit drug use treatment among those
needing but not receiving treatment was 362,000 (Figure 7.10).
Figure 7.10 Number of Persons Aged 12 or
Older Who Felt the Need for but Did Not Receive Specialty Treatment for
Illicit Drug Use in the Past Year among Those with Illicit Drug Dependence
or Abuse: 2002-2004
Among youths aged 12 to 17, an estimated 1.4
million (5.5 percent) needed treatment for an illicit drug use problem in
2004. Of this group, only 134,000 received treatment at a specialty facility
(9.6 percent of youths aged 12 to 17 who needed treatment), leaving an estimated
1.3 million youths who needed treatment but did not receive it at a specialty
facility.
Among people who needed but did not receive
illicit drug use treatment and felt they needed treatment (based on 2003-2004
combined data), the most often reported reasons for not receiving treatment
were cost or insurance barriers (38.8 percent), not ready to stop using (36.4
percent), stigma (21.0 percent), other access barriers such as no transportation/
inconvenient (16.0 percent), and did not feel the need for treatment (at the
time) or could handle the problem without treatment (15.1 percent).
Alcohol Use Treatment and Treatment Need
In 2004, the estimated number of persons aged
12 or older needing treatment for an alcohol use problem was 19.4 million
(8.0 percent of the total population). Of these, 1.5 million (0.6 percent
of the total population and 7.9 percent of the people who needed treatment
for an alcohol use problem) received alcohol use treatment at a specialty
facility. Thus, there were 17.8 million people who needed treatment but did
not receive treatment at a specialty facility for an alcohol use problem.
Between 2003 and 2004, there were no statistically
significant changes in the estimated number of persons needing or receiving
treatment for an alcohol use problem.
Among the 17.8 million people who needed but
did not receive treatment for an alcohol use problem in 2004, an estimated
724,000 (4.1 percent) felt they needed treatment for their alcohol use problem.
Of the 724,000 persons, 283,000 (39.1 percent) made an effort but were unable
to get treatment, and 442,000 (61.0 percent) did not make an effort to get
treatment.
In 2004, there were 1.6 million youths (6.2
percent) aged 12 to 17 who needed treatment for an alcohol use problem. Of
this group, only 126,000 received treatment at a specialty facility (8.0 percent
of youths aged 12 to 17 who needed treatment), leaving an estimated 1.4 million
youths who needed but did not receive treatment.
2004 National Survey
on Drug Use & Health: Results
8. Prevalence and Treatment of
Mental Health Problems
This chapter presents information on several
aspects of mental health in the United States, including the prevalence and
treatment of serious psychological distress (SPD) and major depressive episodes
(MDE) and the association of these problems with substance use.
Past year SPD is an overall indicator of nonspecific
psychological distress that is constructed from the K6 scale administered to
adults aged 18 or older in the National Survey on Drug Use and Health (NSDUH).
The K6 scale consists of six questions that gather information on how frequently
a respondent experienced symptoms of psychological distress during the 1 month
in the past year when he or she was at his or her worst emotionally. Responses
to these six questions are combined to produce a score ranging from 0 to 24,
where a score of 13 or greater is considered SPD. This cutoff is based on research
suggesting that scores above this threshold provide an indicator of serious
mental illness. Although previous reports from the Substance Abuse and Mental
Health Services Administration (SAMHSA) have referred to this measure as "serious
mental illness (SMI)" and research has shown that the measure is highly
correlated with measures of SMI, SAMHSA has determined that it is appropriate
to report these estimates (for 2002, 2003, and 2004) as the prevalence of SPD,
not SMI. See Section B.4.4
in Appendix B
for further discussion.
The 2004 sampling methodology employed a split-sample
design in which approximately half of the adult respondents (sample A) were
administered the K6 questions embedded in the full serious mental illness module,
as it was administered in prior years of the survey. The other half of the adult
respondents (sample B) were administered only the K6 questions without other
mental health symptom questions in the module. To increase comparability across
several years of data, estimates for SPD in this report are based only on respondents
in sample A (i.e., those who were administered the K6 scale within the full
module).
Adults in sample B also received a new module
of questions to measure lifetime and past year prevalence of MDE, the severity
of MDE as measured by role impairment, and treatment received specifically for
depression. A similar set of questions on MDE also was administered to the full
sample of youths aged 12 to 17.
MDE is defined as a period of at least 2 weeks
when a person experienced a depressed mood or loss of interest or pleasure in
daily activities and had symptoms that met the criteria for major depressive
disorder as described in the 4th edition of the Diagnostic and
Statistical Manual of Mental Disorders (DSM-IV) (American Psychiatric Association
[APA], 1994). It should be noted that no exclusions were made for MDE caused
by medical illness, bereavement, or substance use disorders.
Although there is significant overlap between
those meeting the criteria of SPD and MDE, there are important distinctions
between the two. Meeting the criteria for SPD indicates that the respondent
exhibited a high level of distress due to any type of mental problem, which
may include general symptoms related to phobia, anxiety, or depression. However,
meeting the criteria for MDE indicates that the respondent had the specific
physical and emotional symptom profile indicative of major depression.
The 2004 NSDUH (adults in sample B and all youths)
also collected data regarding role impairment based on the Sheehan Disability
Scale (SDS). Role impairment is a measure of the impact of depression on a person's
life. Among youths aged 12 to 17, information on impairment is captured in four
domains: chores at home, school or work, close relationships with family, and
social life. For adults aged 18 or older, the role domains are home management
responsibilities, work responsibilities, close relationships, and social life.
The questions used to measure MDE and role impairment and the scoring strategy
for these responses are included in Section B.4.5
of Appendix B.
This chapter presents data on the receipt of
treatment for any mental health problems among adults and adolescents. This
may be different from the treatment received specifically for MDE (discussed
in Section 8.2),
and it is possible for a respondent to have indicated receipt of treatment for
depression without having indicated that he or she received treatment for any
mental health problems. Different questions and definitions of treatment and
counseling are used for adults and youths. Treatment for adults is defined as
the receipt of treatment or counseling for any problem with emotions, "nerves,"
or mental health in the past year in any inpatient or outpatient setting or
the use of prescription medication for a mental or emotional condition. Treatment
for youths is defined as receiving treatment or counseling for problems with
behaviors or emotions from specific mental health or other health professionals
in school, home, or from other outpatient or inpatient settings within the past
year. Both the youth and the adult questions specifically exclude treatment
for problems with substance use, which is covered elsewhere in the interview.
Estimates of unmet need for treatment are reported separately for all adults
and for adults with SPD. Unmet need is defined using a question in the 2004
NSDUH that asks whether the respondent perceived a need for mental health treatment
or counseling at any time in the 12 months prior to the interview but did not
receive it.
It is important to note that because the sample
frame of the survey includes only the U.S. civilian, noninstitutionalized population,
persons who were residing in long-term psychiatric or other institutions at
the time of interview were excluded from the NSDUH sample.
8.1 Serious Psychological Distress
Prevalence of Serious Psychological Distress
In 2004, there were an estimated 21.4 million
adults aged 18 or older with SPD. This represents 9.9 percent of all adults,
similar to the rate of 9.2 percent in 2003 but higher than the rate of 8.3
percent in 2002 (Figure 8.1).
Figure 8.1 Rates of Serious Psychological
Distress in the Past Year among Adults Aged 18 or Older, by Age: 2002-2004
Rates of SPD in 2004 were highest for adults
aged 18 to 25 (13.7 percent) and lowest for those aged 50 or older (7.9 percent).
The prevalence of SPD among women (12.0 percent)
was higher than that among men (7.7 percent).
Rates of SPD ranged from 10.8 percent among
Hispanics and 10.3 percent among whites to only 6.7 percent among Asians.
Rates were 8.7 percent for persons reporting two or more races and 8.1 percent
for blacks.
Rates of SPD in 2004 were 9.6 percent in the
South, 9.7 percent in the Northeast, 10.1 percent in the Midwest, and 10.5
percent in the West.
Rates of SPD among adults in 2004 were higher
in small metropolitan areas (12.0 percent) than in large metropolitan areas
(8.9 percent). The rate in nonmetropolitan areas was 9.7 percent.
Serious Psychological Distress and Substance
Use and Dependence or Abuse
In 2004, adults who used illicit drugs in
the past year were more than twice as likely to have SPD as adults who did
not use an illicit drug (20.6 vs. 8.3 percent). This pattern has remained
stable since 2002 and was observed within most demographic subgroups.
Among adults with SPD, 27.6 percent used an
illicit drug in the past year compared with 11.8 percent among those without
SPD. Similarly, the rate of past month cigarette use was 40.8 percent among
adults with SPD, and 24.5 percent among adults without SPD (Figure 8.2).
Figure 8.2 Substance Use among Adults Aged
18 or Older, by Serious Psychological Distress in the Past Year: 2004
SPD was not strongly linked with past year
or current alcohol use, but there was an association between SPD and binge
and heavy alcohol use. The rate of current alcohol use in 2004 among adults
with SPD was similar to the rate among those without SPD (52.1 vs. 53.3 percent).
However, the rate of heavy alcohol use in the past month among adults with
SPD was higher (9.7 percent) than among adults without SPD (7.0 percent).
SPD was highly correlated with substance dependence
or abuse. Among adults with SPD in 2004, 21.3 percent (4.6 million) were dependent
on or abused illicit drugs or alcohol. The rate among adults without SPD was
7.9 percent.
Treatment and Unmet Need for Treatment among
Adults with Serious Psychological Distress
Among the 21.4 million adults with SPD in
2004, 10.3 million (48.1 percent) received treatment for a mental health problem
in the past year. This is similar to the estimates in 2002 (47.9 percent)
and 2003 (47.2 percent).
In 2004, rates of mental health treatment
among adults with SPD varied by age. The rate was 38.2 percent for adults
aged 18 to 25, 50.6 percent among those aged 26 to 49, and 50.9 percent for
adults aged 50 or older.
Among the 21.4 million adults with SPD, 826,000
(3.9 percent) received inpatient treatment, 6.5 million (30.2 percent) received
outpatient treatment, and 9.2 million (43.1 percent) received prescription
medication.
Among adults with SPD who received treatment
for mental health problems in the past year, 48.7 percent reported that treatment
helped them "a great deal" or "a lot" in managing daily
activities.
Among adults with SPD in the past year who
did not receive treatment and reported an unmet need for treatment, cost or
insurance issues were the most frequently reported reason for not obtaining
treatment (57.6 percent). Other reasons for not receiving treatment identified
by these respondents included not feeling a need for treatment at the time
or believing that the problem could be handled without treatment (32.1 percent),
stigma associated with treatment (28.6 percent), not knowing where to go for
services (25.9 percent), and not having time (12.9 percent).
In 2004, about half of all adults with SPD
who received outpatient treatment for a mental health problem in the past
year reported receiving outpatient treatment or counseling in the office of
a private therapist, psychologist, psychiatrist, social worker, or counselor
not part of a clinic (49.5 percent). An estimated 26.3 percent received care
in an outpatient mental health clinic, and 28.2 percent received it in a private
physician's office.
Treatment among Adults with Co-Occurring Serious
Psychological Distress and Substance Use Disorders
Among the 4.6 million adults with SPD and
a substance use disorder in 2004, 47.5 percent (about 2.2 million) received
treatment for mental health problems, and 11.0 percent (503,000 adults) received
specialty substance use treatment (Figure 8.3).
Figure 8.3 Past Year Treatment among Adults
Aged 18 or Older with Both Serious Psychological Distress and a Substance
Use Disorder: 2004
In 2004, about half (47.5 percent) of adults
with both SPD and a substance use disorder received no treatment for either
problem. Only 6.0 percent (274,000 adults) received both treatment for mental
health problems and specialty substance use treatment. Another 41.4 percent
received only treatment for mental health problems, and 5.0 percent received
only specialty substance use treatment.
8.2 Major Depressive Episodes
Prevalence of Major Depressive Episodes
In 2004, an estimated 35.1 million persons
(14.7 percent of the population) aged 12 or older had at least one MDE in
their lifetime, and 19.3 million persons (8.1 percent of the population) had
at least one MDE in the past year. In 2004, an estimated 2.2 million youths
aged 12 to 17 and 17.1 million adults aged 18 or older had at least one MDE
during the past year.
The lifetime prevalence of MDE was 14.0 percent
among persons aged 12 to 17, 16.6 percent among persons aged 18 to 25, and
14.5 percent among persons aged 26 or older.
The past year prevalence of MDE was highest
for adults aged 18 to 25 (10.1 percent) and lowest for those aged 26 or older
(7.6 percent). The rate among youths aged 12 to 17 was 9.0 percent.
The past year prevalence of MDE was higher
among females than among males (10.6 vs. 5.5 percent) (Figure 8.4).
Rates of lifetime and past year MDE were higher for females than males in
all age groups.
Figure 8.4 Major Depressive Episodes in
the Past Year among Persons Aged 12 or Older, by Age and Gender: 2004
Among racial/ethnic groups, the past year
prevalence of MDE was highest among persons reporting two or more races (16.6
percent). Rates of MDE were below 10 percent among whites (8.5 percent), American
Indians or Alaska Natives (8.0 percent), blacks (7.2 percent), Hispanics (6.8
percent), and Asians (5.4 percent).
Among adults aged 18 or older, past year prevalence
of MDE was higher among unemployed persons (11.3 percent) than among persons
employed full time (7.6 percent) and persons not in the labor force (8.0 percent).
The rate was 8.8 percent among part-time employees.
Among persons aged 12 or older, perceived
health was highly correlated with past year MDE. The rate of MDE was highest
among persons with fair or poor health (13.6 percent) and lowest among those
with excellent health (5.1 percent). The rate was 7.6 percent among those
with very good health and 9.3 percent among those with good health.
Major Depressive Episodes and Substance Use
In 2004, persons with MDE in the past year
were more likely than those without MDE to have used an illicit drug in the
past year. Among persons with an MDE, 28.8 percent used an illicit drug in
the past year, while among those without an MDE only 13.8 percent used an
illicit drug (Figure 8.5).
A similar pattern was observed for specific types of past year illicit drug
use, such as marijuana, cocaine, heroin, hallucinogens, inhalants, and the
nonmedical use of psychotherapeutics.
Figure 8.5 Substance Use among Persons Aged
12 or Older, by Major Depressive Episode in the Past Year: 2004
Past month heavy alcohol use, defined as drinking
five or more drinks on 5 or more days in the past 30 days, also was associated
with an MDE in the past year. Among persons with an MDE, 9.2 percent were
heavy alcohol users compared with 6.9 percent of persons without an MDE. Similarly,
among persons with an MDE, the rate of daily cigarette use was 25.5 percent,
while the rate was 15.1 percent among persons without an MDE.
Co-Occurrence of a Major Depressive Episode
with Substance Dependence or Abuse
Having MDE in the past year also was associated
with substance dependence or abuse. Among persons aged 12 or older with MDE
in 2004, 22.0 percent were dependent on or abused alcohol or illicit drugs,
while among persons without MDE 8.6 percent were dependent on or abused alcohol
or illicit drugs. Persons with MDE were more likely than those without MDE
to be dependent on or abuse illicit drugs (9.6 vs. 2.7 percent) and alcohol
(16.8 vs. 7.1 percent).
Among persons with substance dependence or
abuse, 18.5 percent had at least one MDE in the past year compared with 7.0
percent among those who did not have substance dependence or abuse.
Treatment for Major Depressive Episodes
Among persons aged 12 or older who had MDE
in the past year, 62.3 percent received treatment (i.e., saw or talked to
a medical doctor or other professional or used prescription medication) for
depression within the same time period.
Rates of treatment among persons with MDE
in the past year varied by age. The rate was highest among adults 26 or older
(69.5 percent). The rate was 46.3 percent for adults 18 to 25 years of age
and 40.3 percent for adolescents 12 to 17 years of age.
In 2004, females who had MDE in the past year
were more likely than males to receive treatment in the past year (66.6 vs.
53.4 percent) (Figure 8.6).
Figure 8.6 Past Year Treatment for Depression
among Persons Aged 12 or Older with a Major Depressive Episode in the Past
Year, by Age and Gender: 2004
Only 28.9 percent of black youths with MDE
in the past year received treatment for depression during the past year, compared
with 44.9 percent of white youths and 36.8 percent of Hispanic youths with
MDE.
Persons with MDE in the past year whose self-perceived
health status was fair or poor were more likely to receive treatment for their
depression (74.1 percent) than those whose self-perceived health status was
good (64.7 percent), very good (55.0 percent) or excellent (57.8 percent).
Among adults 18 or older with MDE in the past
year, less than half of those with no insurance (41.1 percent) received treatment
for depression in the past year compared with 70.3 percent of adults with
private insurance, 74.3 percent of adults with Medicaid or CHIP, and 82.6
percent of adults with other health insurance, including Medicare, CHAMPUS,
TRICARE, CHAMPVA, VA, and other sources of health care or insurance.
Among persons aged 12 or older with MDE in
the past year, 17.2 percent saw or talked to a medical doctor or other professional
but did not use prescription medication, 3.4 percent used prescription medication
but did not see a medical doctor or other professional, and 41.7 percent saw
or talked to a health professional and used prescription medication within
the past 12 months.
There were differences by age group in the
type of professional seen among persons with MDE in the past year who saw
or talked to a professional in the past year about depression. Adults aged
18 years or older were more likely than youths aged 12 to 17 to see a family
doctor (58.7 vs. 25.5 percent) or other medical doctors (11.3 vs. 5.0 percent)
about depression in the past year. In contrast, youths were more likely than
adults to see psychologists (32.2 vs. 26.0 percent) or counselors (58.2 vs.
20.7 percent) (Figure 8.7).
Figure 8.7 Type of Professional Seen among
Persons Aged 12 or Older with Major Depressive Episodes in the Past Year
Who Saw or Talked to a Medical Doctor or Other Professional in the Past
Year about Depression, by Age Group: 2004
Among adults with an MDE in the past year,
about one in five uninsured adults reported both seeing or talking to a health
care professional and using a prescription medication in the past year (19.5
percent), while 50.0 percent with private insurance, 58.6 percent with Medicaid/CHIP,
and 63.3 percent with other insurance reported both seeing or talking with
a health care professional and using a prescription medication for the treatment
of MDE in the past year.
Perceived Help from Treatment for Major Depressive
Episodes
An estimated 42.4 percent of persons with
MDE in the past year who saw or talked to a health care professional in the
past year for depression reported this treatment as helping "a lot"
or "extremely," and 29.2 percent described this care as helping
"not at all" or "a little."
Among persons aged 12 or older with MDE in
the past year, 55.0 percent of those who received prescription medication
for depression in the past year reported that the medication has helped "a
lot" or "extremely," while only 42.4 percent of those who saw
or talked to a medical doctor or other professional reported that this treatment
helped "a lot" or "extremely."
An estimated 39.9 percent of youths aged 12
to 17 with MDE in the past year who saw or talked to a medical doctor or other
professional for depression reported that this treatment helped "not
at all" or "a little."
Among persons with MDE in the past year who
received prescription medication for depression in the past year, 32.9 percent
of youths aged 12 to 17 reported that the prescription medication helped "not
at all" or "a little," while 16.7 percent of adults aged 18
or older reported that the prescription medication helped "not at all"
or "a little."
Role Impairment Resulting from Major Depressive
Episode
An estimated 1.5 million youths aged 12 to
17 years old with MDE in the past year experienced severe to very severe impairment
in at least one of four role domains due to depression. This represents 69.2
percent of youths with MDE and 6.1 percent of all youths. On average, youths
with very severe impairment due to depression were unable to carry out normal
activities 55.7 days during the past year.
An estimated 11.2 million adults with MDE
in the past year experienced severe or very severe impairment in at least
one of the four role domains due to depression (66.3 percent of adults with
MDE, 5.2 percent of all adults). On average, adults who reported very severe
impairment in at least one of the domains were unable to carry out normal
activities on 120.3 days out of the year.
An estimated 5.5 million adults with MDE in
the past year reported severe or very severe impairment in their ability to
carry out work activities in the past year as the result of their depression.
Among adults aged 18 years or older with MDE
in the past year, 46.3 percent described severe or very severe impairment
in their ability to fulfill normal responsibilities with home management,
while 43.2 percent reported severe to very severe impairment in forming and
maintaining close relationships with others due to depression (Figure 8.8).
Figure 8.8 Percentage with Severe or Very
Severe Role Impairment as Measured by the Sheehan Disability Scale (SDS)
among Persons Aged 12 or Older with a Major Depressive Episode in the Past
Year: 2004
8.3 Treatment and Unmet Treatment Need among
All Adults
In 2004, an estimated 27.5 million adults
received treatment for mental health problems during the past 12 months. This
represents 12.8 percent of the population 18 years or older and is similar
to the rate in 2002 and 2003.
The treatment type most often reported by
the adult population in 2004 was prescription medication (10.5 percent), followed
by outpatient treatment (7.1 percent). About 1.9 million adults (0.9 percent)
received inpatient care for mental health problems during the past year. These
patterns of utilization were not significantly different from those seen in
2002 and 2003, although the rate of inpatient treatment was higher in 2004
than in 2002 (0.7 percent) (Figure 8.9).
Figure 8.9 Past Year Treatment for Mental
Health Problems among Adults Aged 18 or Older, by Type of Treatment: 2002-2004
Rates of treatment for mental health problems
varied by age, ranging from 10.8 percent for adults aged 18 to 25 to 14.4
percent for adults aged 26 to 49. The rate was 11.7 percent among adults aged
50 or older.
In 2004, men were less likely than women to
receive outpatient treatment (5.0 vs. 9.0 percent) and prescription medication
(6.9 vs. 13.9 percent) for mental health problems. There was no gender difference
in the rates of inpatient treatment.
Among racial/ethnic groups, the rates of treatment
for adults in 2004 were 15.8 percent for persons reporting two or more races,
14.9 percent for non-Hispanic whites, 12.6 percent for American Indians or
Alaska Natives, 8.5 percent for blacks, 7.4 percent for Hispanics, and 4.7
percent for Asians.
In 2004, the overall rate of treatment for
mental health problems was lowest for adults with less than a high school
education and for high school graduates with no college (11.3 and 11.5 percent,
respectively). Similar to 2003, adults without a high school diploma were
more likely than adults with some college or college graduates to have received
inpatient mental health treatment (1.8 percent vs. 0.7 and 0.2 percent, respectively).
Adults with some college (12.5 percent) and college graduates (10.6 percent)
were more likely to receive prescription medication for mental health problems
compared with adults with less than a high school education (8.9 percent).
In 2004, adults with an annual family income
of less than $20,000 were more likely to receive treatment or counseling for
mental health problems (15.6 percent) than were those with incomes of $20,000
to $49,999 (11.6 percent), those with incomes of $50,000 to $74,999 (12.9
percent), and adults with incomes of $75,000 or more (12.2 percent).
The rate of illicit drug use in the past year
was higher among adults who received treatment or counseling for their mental
health problems in the past year than among those who did not receive treatment
(21.5 vs. 12.5 percent). The rate of past year alcohol use also was higher
among adults who received treatment for a mental health problem than among
those who did not receive treatment (71.5 vs. 68.5 percent). However, there
were no significant differences in the rate of past month binge alcohol use
or past month heavy alcohol use between those receiving and those not receiving
treatment (23.9 vs. 24.2 percent and 7.5 vs. 7.4 percent, respectively).
Adults who received treatment or counseling
in the past year for their mental health problems were more than twice as
likely to be dependent on or abuse illicit drugs as adults who did not receive
any treatment (6.3 vs. 2.2 percent). They also were more likely to be dependent
on or abuse alcohol (13.2 vs. 7.2 percent).
Similar to 2002 and 2003, more than half of
adults who received treatment or counseling for mental health problems in
2004 (54.7 percent) reported that the treatment improved their ability to
manage daily activities "a great deal or a lot."
In 2004, 10.9 million adults (5.1 percent)
reported an unmet need for treatment or counseling for mental health problems
in the past year. This includes 5.6 million adults who did not receive treatment.
Among adults who did receive treatment or counseling for a mental health problem
in the past year, 19.1 percent reported an unmet need. This may reflect a
delay in treatment or receipt of insufficient treatment.
Among the 5.6 million adults who reported
an unmet need and did not receive treatment in the past year, several barriers
to treatment were reported. These included cost or insurance issues (47.2
percent), not feeling a need for treatment at the time or believing that the
problem could be handled without treatment (37.6 percent), stigma associated
with treatment (25.8 percent), and not knowing where to go for services (19.9
percent) (Figure 8.10).
Figure 8.10 Reasons for Not Receiving Treatment
in the Past Year among Adults Aged 18 or Older with an Unmet Need for Treatment
Who Did Not Receive Treatment: 2004
8.4 Treatment for Mental Health Problems among
Youths
In 2004, 5.7 million youths aged 12 to 17
(22.5 percent) received treatment or counseling for emotional or behavior
problems in the year prior to the interview. This is higher than the estimates
for 2002 (19.3 percent) and 2003 (20.6 percent).
The rate of treatment for mental health problems
among youths aged 12 to 17 who used illicit drugs in the past year (33.6 percent)
was higher than the rate among youths who did not use illicit drugs (19.6
percent).
The rate of illicit drug use in the past year
was higher among youths who received mental health treatment or counseling
in the past year than among those who did not (31.4 vs. 18.0 percent). This
pattern also was observed for marijuana, cocaine, hallucinogens, inhalants,
and the nonmedical use of psychotherapeutics.
Youths who received mental health treatment
or counseling in the past year were more likely to use alcohol in the past
year than those who did not receive treatment or counseling (40.8 vs. 31.9
percent). Youths receiving mental health treatment or counseling in the past
year were more likely to have smoked cigarettes in the past year (27.6 vs.
15.7 percent).
Youths who received mental health treatment
or counseling in the past year were twice as likely to be dependent on or
to have abused illicit drugs or alcohol in the past year than those who did
not receive treatment or counseling (14.9 vs. 7.1 percent).
9. Discussion of Trends in Substance
Use Prevalence
This report presents findings from the 2004 National
Survey on Drug Use and Health (NSDUH). Conducted since 1971 and previously named
the National Household Survey on Drug Abuse (NHSDA), the survey underwent several
methodological improvements in 2002 that have affected prevalence estimates.
As a result, the 2002, 2003, and 2004 estimates are not comparable with estimates
from 2001 and earlier surveys. The primary focus of the report is on comparisons
across subgroups of the U.S. population in 2004 and changes between 2003 and
2004, as well as between 2002 and 2004, in the substance use and mental health
measures addressed by the survey. Some of the key findings for 2004 are presented
in the Highlights section of this report. This chapter provides an additional
discussion of the findings concerning a topic of great interest—trends
in substance use among youths and young adults.
The 2002-2004 NSDUHs show that among youths
aged 12 to 17, the use of alcohol, inhalants, cocaine, and pain relievers used
nonmedically did not change significantly, while cigarette use declined. Youth
marijuana use also declined, but slowly, and primarily among males, and not
in the West region. However, data on marijuana incidence suggest that the recent
declining trend in marijuana prevalence may not continue in 2005. The percentage
of youths who used marijuana for the first time within the past 12 months was
4.9 percent in 2003 and 5.0 percent in 2004. Among young adults aged 18 to 25,
trends were similar to the trends for youths, except that there was no decline
in cigarette use in this age group. The past month cigarette smoking rate among
young adults remained at about 40 percent in 2004.
An important step in the analysis and interpretation
of NSDUH or any other survey data is to compare the results with those from
other data sources. This can be difficult sometimes because the other surveys
typically have different purposes, definitions, and designs. Research has established
that surveys of substance use and other sensitive topics often produce inconsistent
results because of different methods used. Thus, it is important to understand
that conflicting results often reflect differing methodologies, not incorrect
results. Despite this limitation, comparisons can be very useful. Consistency
across surveys can provide confirmation or support for conclusions about trends
and patterns of use, and inconsistent results can point to areas for further
study. Further discussion of this issue is included in
Appendix E, along with descriptions
of methods and results from other substance use and mental health data sources.
Unfortunately, few additional data sources are
available at this time to compare with NSDUH results. One established source
is Monitoring the Future (MTF), a study sponsored by the National Institute
on Drug Abuse (NIDA). MTF surveys students in 8th, 10th,
and 12th grades in classrooms during the spring of each year, and
it also collects data by mail from a subsample of adults who had earlier participated
in the study as 12th graders (2004 data from the adult survey are
not available at this time) (Johnston, O'Malley, Bachman, & Schulenberg,
2005). Historically, NSDUH rates of substance use among youths have been lower
than those of MTF, but the two sources have usually shown similar trends.
Recent Trends in Substance Use
A comparison of NSDUH and MTF estimates for 2002,
2003, and 2004 is shown in Tables 9.1 and 9.2 for several substances that are
defined similarly in the two surveys. MTF data on 8th and 10th
graders combined give the closest match on age to NSDUH youth estimates, while
MTF follow-up data on persons aged 19 to 24 provide the closest match on age
to NSDUH young adult estimates. The NSDUH results are very consistent with MTF
trends. Both surveys show decreases among youths and young adults for some measures
of use of illicit drugs, alcohol, and cigarettes between 2002 and 2004, although
not all decreases are statistically significant. The gender difference in the
youth marijuana use trend described in Chapter 2
of this report also is evident in MTF data. The rate of past year marijuana
use among male 8th and 10th graders dropped from 24.7
percent in 2002 to 20.7 percent in 2004, while among females in these grades
the rate was 20.4 percent in 2002 and 18.5 percent in 2004 (Johnston, O'Malley,
Bachman, & Schulenberg, in press a).
Long-Term Trends in the Use of Marijuana, Cocaine,
and Nonmedical Psychotherapeutics
In this section, trends in the use of two illicit
drugs of concern, marijuana and cocaine, are described along with trends in
the nonmedical use of prescription-type psychotherapeutics. Methodology changes
throughout NSDUH's history make it difficult to assess long-term trends. However,
it is instructive to compare NSDUH estimates from 1971 to 2004 by "piecing
together" the data from time periods for which data are comparable. Specifically,
valid trend comparisons can be made for 1971-1998, 1999-2001, and
2002-2004. With this approach, comparisons between 1998 and 1999, and between
2001 and 2002, are made with caution because they are potentially biased due
to methods changes. Nevertheless, when these data are combined in a single presentation,
it often becomes clear that the effects of the methods changes are small compared
with the major shifts in substance use prevalence that have occurred over the
past three decades. For example, NSDUH data show an increase in youth and young
adult marijuana use in the 1970s, followed by a decrease in the 1980s and another
less pronounced increase among youths in the early 1990s (Figures 9.1
and 9.2).
These trends also are evident in MTF data, as well as in NSDUH retrospectively
reported incidence data presented in Figure 5.1
in Chapter 5
of this report.
Figure 9.1 Past Month Marijuana Use among Youths
Aged 12 to 17: 1971-2004
The trend in cocaine use during the 1970s and
1980s shows a similar pattern to that of marijuana, although cocaine use lagged
by several years and occurred among an older group of users (Figure 9.3).
These results are consistent with MTF data (not shown). Marijuana use increased
in the early 1970s, until it peaked in 1979, while cocaine use did not dramatically
increase until the late 1970s, peaking in 1982 among youths, in 1979 among young
adults aged 18 to 25, and in 1985 among persons aged 26 to 34. Marijuana use
peaked in 1979 for all three of these age groups (data for those aged 26 to
34 are not shown; see Table 7.128B in the 2004 Detailed Tables). These trends
for marijuana and cocaine are consistent with prior studies that have shown
that more than 90 percent of cocaine users during the early 1980s had used marijuana
prior to initiating cocaine use (Adams, Rouse, & Gfroerer, 1990); the same
appears to be true for cocaine users in 2004.
Figure 9.3 Past Year Cocaine Use among Persons
Aged 12 or Older, by Age: 1972-2004
Trend data for nonmedical use of prescription-type
psychotherapeutics among persons aged 12 or older showed a decrease from 1985
to 1990, followed by a gradual decline; the rate was lower in 1998 than in 1991.
Methodological changes limit inferences about trends between 1998 and 1999 and
from 2001 to 2002. A significant 1-year increase occurred from 2000 to
2001, but from 2002 to 2004 the rate remained stable (Figure 9.4).
Figure 9.4 Past Year Nonmedical Prescription-Type
Psychotherapeutic Use among Persons Aged 12 or Older: 1985-2004
Table 9.1 Comparison of NSDUH and MTF
Prevalence Rates among Youths: 2002-2004
NSDUH
Age 12-17
MTF
8th and 10th Grades
2002
2003
2004
2002
2003
2004
Marijuana
Lifetime
20.6a,b
19.6
19.0
29.0a,b
27.0
25.7
Past
Year
15.8b
15.0
14.5
22.5a,b
20.5
19.7
Past
Month
8.2
7.9
7.6
13.1b
12.3b
11.2
Cocaine
Lifetime
2.7
2.6
2.4
4.9
4.4
4.4
Past
Year
2.1b
1.8
1.6
3.2
2.8
2.9
Past
Month
0.6
0.6
0.5
1.4
1.1
1.3
Ecstasy
Lifetime
3.3a,b
2.4
2.1
5.5a,b
4.3b
3.6
Past
Year
2.2a,b
1.3
1.2
3.9a,b
2.6b
2.1
Past
Month
0.5b
0.4
0.3
1.6a,b
0.9
0.8
LSD
Lifetime
2.7a,b
1.6b
1.2
3.8a,b
2.8
2.3
Past
Year
1.3a,b
0.6
0.6
2.1a,b
1.5
1.4
Past
Month
0.2
0.2
0.2
0.7
0.6
0.6
Inhalants
Lifetime
10.5
10.7
11.0
14.4
14.3
14.9
Past
Year
4.4
4.5
4.6
6.8b
7.1b
7.8
Past
Month
1.2
1.3
1.2
3.1
3.2
3.5
Alcohol
Lifetime
43.4b
42.9
42.0
57.0b
55.8b
54.1
Past
Year
34.6
34.3
33.9
49.4b
48.3
47.5
Past
Month
17.6
17.7
17.6
27.5
27.6
26.9
Cigarettes
Lifetime
33.3a,b
31.0b
29.2
39.4a,b
35.7
34.3
Past
Year
20.3a,b
19.0
18.4
--
--
--
Past
Month
13.0b
12.2
11.9
14.2b
13.5
12.6
--
Not available. a Difference between estimate and 2003 estimate is statistically
significant at the .05 level. b Difference between estimate and 2004 estimate is statistically
significant at the .05 level.
Note: MTF data for 8th and 10th graders are simple
averages of estimates for those two grades. Data for 8th and
10th graders are reported in Johnston, O'Malley, Bachman, and
Schulenberg (2005). Design effects used for variance estimation are reported
in Johnston, O'Malley, Bachman, and Schulenberg (2004c).
Sources: SAMHSA, Office of Applied Studies, National Survey on Drug Use
and Health, 2002, 2003, and 2004. The Monitoring the Future Study, University
of Michigan, 2002, 2003, and 2004.
Table 9.2 Comparison
of NSDUH and MTF Prevalence Rates among Young Adults: 2002-2004
NSDUH
Age 18-25
MTF
Age 19-24
2002
2003
2004
2002
2003
2004
Marijuana
Lifetime
53.8
53.9
52.8
56.1
56.4
--
Past
Year
29.8a,b
28.5
27.8
34.2
33.0
--
Past
Month
17.3b
17.0
16.1
19.8
19.9
--
Cocaine
Lifetime
15.4
15.0
15.2
12.9
14.5
--
Past
Year
6.7
6.6
6.6
6.5
7.3
--
Past
Month
2.0
2.2
2.1
2.5
2.6
--
Ecstasy
Lifetime
15.1b
14.8b
13.8
16.0
16.6
--
Past
Year
5.8a,b
3.7b
3.1
8.0
5.3
--
Past
Month
1.1a,b
0.7
0.7
1.6
1.0
--
LSD
Lifetime
15.9a,b
14.0b
12.1
13.9
13.8
--
Past
Year
1.8a,b
1.1
1.0
2.4
1.5
--
Past
Month
0.1b
0.2
0.3
0.4
0.2
--
Inhalants
Lifetime
15.7b
14.9
14.0
11.7
11.4
--
Past
Year
2.2
2.1
2.1
2.2
1.5
--
Past
Month
0.5
0.4
0.4
0.8
0.3
--
Alcohol
Lifetime
86.7
87.1
86.2
88.4
87.6
--
Past
Year
77.9
78.1
78.0
83.9
82.3
--
Past
Month
60.5
61.4
60.5
67.7
66.3
--
Cigarettes
Lifetime
71.2b
70.2b
68.7
--
--
--
Past
Year
49.0a,b
47.6
47.5
41.8
40.8
--
Past
Month
40.8
40.2
39.5
31.4
29.5
--
--
Not available. a Difference between estimate and 2003 estimate is statistically
significant at the .05 level. b Difference between estimate and 2004 estimate is statistically
significant at the .05 level.
Note: MTF data for persons aged 19 to 24 are simple averages of modal age
groups 19-20, 21-22, and 23-24, reported in Johnston, O'Malley,
and Bachman (2003c) and Johnston, O'Malley, Bachman, and Schulenberg (2004a).
Sources: SAMHSA, Office of Applied Studies, National Survey on Drug Use
and Health, 2002, 2003, and 2004. The Monitoring the Future Study, University
of Michigan, 2002 and 2003.
End Note
1
RTI International is a trade name of Research Triangle Institute.