NOAA home United States Department of Commerce
DOC home
NOAA home National Oceanic and Atmospheric Administration
DOC home
NOAA and DOC logos
Current Conditions

NOAAWatch

NOAA's All Hazard Monitor
Local forecast by City, State
 

Weather Warnings

Weather Warnings Map of the United States

Doppler Radar

Doppler Radar Map of the United States

River and Lake Levels

River and Lake Leverls

NOAA Environmental Visualization Laboratory

NOAA Environmental Visualization Laboratory Image of the Day

Drought Outlook

Drought Outlook Map of the United States
U.S. Drought Monitor - Current Drough Conditions

Surface Weather Charts

Unified Surface Analysis of World Oceans


Daily Forecast Map Archive

Archive of daily weather forecast maps - Jan 3, 2001 to Present


La Niña / El Niño Index

El-Nino / La Nina Meter at plus 0.1 signifying a sea surface temperature anomoly of plus 0.1 degrees C. - Click for Outlook
Updated Oct 4, 2012

Sea surface temperature (°C) departure from normal

El Niño/ENSO - Impacts
FAQ

Today's UV Index
Forecast Map

UV Index


Daily Maximum
Heat Index Maps

Daily Maximum Heat Index Maps
Heat Index Chart
Health Effects of Extreme Heat

International Disaster Reports

Severe Weather Information Centre
World Meteorological Organization
Provided by World Meteorological Organization

Global Disaster Alert and Coordination System

Asian Disaster Reduction Center (ADRC) Disaster Information

GLobal IDEntifier Number (GLIDE)


Weather Outlook for Saturday

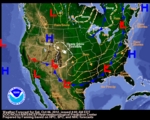
Sat, 06 Oct 2012 07:51:00 EDT
The well developed upper trough encompassing much of the country has allowed the invasion of cold Canadian air to make its presence felt. The surging cold front will usher below normal emperatures down toward the Gulf Coast and over to the Eastern Seaboard. Across the latter region, mild temperatures will be in place in spite of the fact that the frontal passage will occur midday Saturday. However, the coldest air will lurk to the west where additional upper energy is expected to travel from the central Plains quickly toward the Ohio Valley/Upper Mid-Atlantic. Upslope flow right along the central Rockies will support periods of light to moderate snowfall on Saturday. It appears the best axis of snowfall accumulations will occur across southeastern Wyoming, northeastern Colorado and western Nebraska with approximately 2 to 4 inches expected with locally heavier amounts possible. Latest local weather forecasts, warnings, watches, and advisories...

Hydrometeorological Prediction Center Short Range Forecast Discussion

Learn more about fire weather and wildfires Fire weather outlook map

Critical Fire Conditions for Saturday

Sat, 06 Oct 2012 07:53:01 EDT
A critical fire weather area has been declared for south-central Washington, and north-central/northwestern Oregon. In addition, red flag warnings are in effect for portions of western Washington and western Oregon. Details...


Learn more about tropical weather Tropical Weather Outlook for the Atlantic and Eastern Pacific

learn more about drought Drought monitor map

USDA Drought Disaster Update

Wed, 12 Sep 2012 10:55:33 EDT
The United States Department of Agriculture Drought Portal provides resources and information related to the current drought crisis from across the Government. Throughout much of the country, communities are struggling with one of the worst droughts to strike the U.S. in decades. The lack of rain and high temperatures have done considerable damage to crops -- particularly those in the Midwest. USDA and other federal agencies are taking steps to help farmers, ranchers, and small businesses wrestling with this crisis. Details...


Earthquake Information from the U.S. Geological Survey
Learn more about earthquakes from NOAAWatch U.S. Geological Service

M 2.6, Island of Hawaii, Hawaii

Sat, 06 Oct 2012 16:59:05 GMT
October 06, 2012 16:59:05 GMT Details...

Latest Earthquakes - Last 7 Days

NOAA NewsNews from NOAA
August global temperatures are fourth highest on record; Arctic sea ice extent shrinks to record low
Mon, 17 Sep 2012 10:18:38 -0400
According to NOAA's NCDC, the combined average temperature over global land and ocean surfaces for August was the fourth highest on record for August at 61.22°F (16.22°C), or 1.12°F (0.62°C), above the 20th century average. On August 26, Arctic sea ice dipped below the record smallest daily extent, previously set on Sept. 18, 2007. (full report, summary) Details...


NOAAWatch & Learn
Explore NOAAWatch themes:
air quality

Air Quality

coral

Coral Bleaching

Droughts

Droughts

earthquake

Earthquakes

excessive heat

Excessive Heat

fire

Fire Weather

Flooding

Flooding

habs

Harmful Algal Blooms(HABs)

tropical

Hurricanes/Tropical Weather

coastal inundation

Storm Surge & Coastal Floods

Oil and Chemical Spills

Oil & Chemical Spills

Rip Currents

Rip Currents

lightning bolt

Severe Weather

Space weather

Space Weather

wave

Tsunamis

volcano

Volcanoes

snow

Winter Weather

UV Index

Ultraviolet (UV) Radiation


NOAAWatch
Archive


NOAA Weather Radio
Stay informed 24/7 with the NOAA All Hazards Weather radio.


Preparedness Resources

· Ready America - DHS
· Plan Ahead - FEMA
· Preparedness for    People With Disabilities
· HHS - Disasters &    Emergencies
· American Red Cross
· DisasterAssistance.gov


Ask NOAA a question
Ask NOAA a question... or find an answer in our database!


Daily Briefing

Comprehensive Briefing Materials


NOAA Homeland Security Program Office


RSS Feeds RSS Feeds


USA.gov is the U.S. government's official web portal to all federal, state and local government web resources and services.