| December 1, 2011 |
| December 1, 2011 |
|
Injection drug abuse involves the use of needles to inject substances such as heroin, cocaine, methamphetamine, or other drugs into the bloodstream. The behaviors associated with injection drug use, such as reusing and sharing needles, can increase the user's risk for contracting and spreading blood-borne infections such as herpes simplex, hepatitis B, hepatitis C, and human immunodeficiency virus (HIV).1 Substance abuse treatment providers can play a significant role in reducing injection drug use and the transmission of infectious diseases. Monitoring trends in injection drug use treatment admissions may help public health officials and treatment providers to identify emerging patterns and evaluate the effectiveness of strategies aimed at reducing this high-risk behavior.
The Treatment Episode Data Set (TEDS) can be used to examine the characteristics of injection drug use admissions and identify emerging trends. TEDS collects data on up to three substances of abuse at the time of admission, including the usual route of administration for each of these substances. This report examines trends in admissions aged 12 or older that reported injection of the primary, secondary, or tertiary substance of abuse (hereafter referred to as "injection admissions").2
Injection Drugs
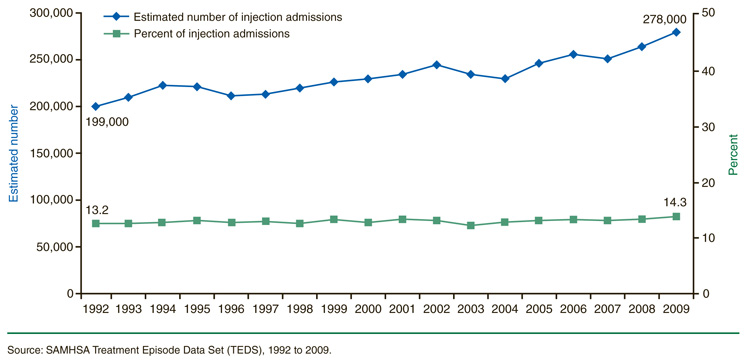
Although the number of injection admissions increased from over 199,000 in 1992 to nearly 278,000 in 2009, they remained a relatively constant proportion of all admissions (13.2 percent of all substance abuse treatment admissions in 1992 and 14.3 percent in 2009) (Figure 1). However, the pattern in the drugs that were injected shifted somewhat during the 18-year period.
|
| Year | Estimated number | Percent | ||
|---|---|---|---|---|
| 1992 | 199,000 | 13.2% | ||
| 1993 | 209,200 | 13.3% | ||
| 1994 | 222,900 | 13.8% | ||
| 1995 | 220,800 | 13.5% | ||
| 1996 | 211,300 | 13.2% | ||
| 1997 | 213,900 | 13.7% | ||
| 1998 | 220,200 | 13.3% | ||
| 1999 | 229,300 | 13.7% | ||
| 2000 | 231,000 | 13.5% | ||
| 2001 | 234,000 | 13.6% | ||
| 2002 | 246,000 | 13.4% | ||
| 2003 | 234,100 | 12.9% | ||
| 2004 | 230,600 | 13.0% | ||
| 2005 | 246,800 | 13.4% | ||
| 2006 | 251,700 | 13.4% | ||
| 2007 | 239,000 | 13.2% | ||
| 2008 | 253,200 | 13.7% | ||
| 2009 | 278,000 | 14.3% | ||
| Source: SAMHSA Treatment Episode Data Set (TEDS), 1992 to 2009. | ||||
In both 1992 and 2009, heroin was the most commonly injected drug among substance abuse treatment admissions, followed by cocaine. The proportion of all admissions reporting heroin injection increased slightly (9.9 to 11.1 percent), while the proportion of admissions reporting cocaine injection decreased (5.6 to 2.0 percent) (Figure 2). Additionally, there were increases in the proportions of methamphetamine injection admissions (0.5 to 1.8 percent) and admissions for injection of opiates other than heroin (0.5 to 1.3 percent).
|
| Substance | 1992 | 2009 | ||
|---|---|---|---|---|
| Heroin | 9.9% | 11.1% | ||
| Cocaine | 5.6% | 2.0% | ||
| Methamphetamine | 0.5% | 1.8% | ||
| Other Opiates | 0.5% | 1.3% | ||
| Other | 0.6% | 0.3% | ||
| Source: SAMHSA Treatment Episode Data Set (TEDS), 1992 and 2009. | ||||
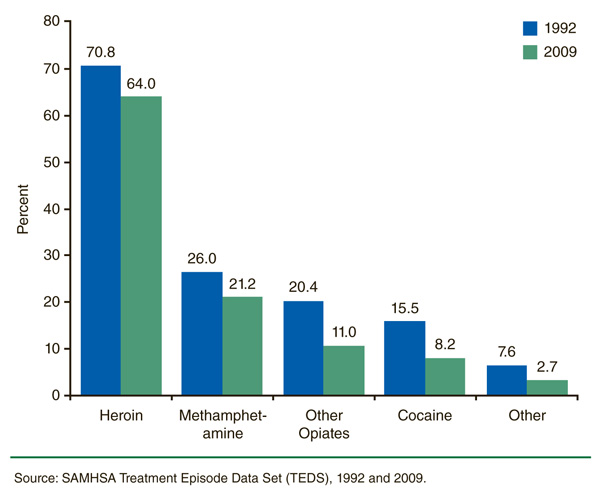
Between 1992 and 2009, a smaller proportion of admissions used injection as the route of administration for some specific drugs. For example, in 1992, 70.8 percent of heroin admissions injected the drug compared with 64.0 percent in 2009 (Figure 3). Similar decreases in the proportion of injection admissions were seen among methamphetamine admissions (from 26.0 to 21.2 percent), admissions for opiates other than heroin (from 20.4 to 11.0 percent), and cocaine admissions (from 15.5 to 8.2 percent).
|
| Substance | 1992 | 2009 | ||
|---|---|---|---|---|
| Heroin | 70.8% | 64.0% | ||
| Methamphetamine | 26.0% | 21.2% | ||
| Other Opiates | 20.4% | 11.0% | ||
| Cocaine | 15.5% | 8.2% | ||
| Other | 7.6% | 2.7% | ||
| Source: SAMHSA Treatment Episode Data Set (TEDS), 1992 and 2009. | ||||
Injection of Primary vs. Secondary/Tertiary Drug
In 2009, most injection admissions (85.1 percent) reported that they injected their primary drug of abuse. The remaining 14.9 percent of injection admissions—or about 1 in 7 of all injection admissions—injected their secondary or tertiary drug of abuse. (This proportion was smaller than in 1992, when about 1 in 5 injection admissions injected their secondary/tertiary drug.)
The proportion of injection admissions that injected their secondary/tertiary drug of abuse varied substantially by drug. For example, while only 13.0 percent of all heroin injection admissions in 2009 reported injecting heroin as a secondary/tertiary drug of abuse, 36.2 percent of all methamphetamine injection admissions and 86.3 percent of all cocaine injection admissions injected those substances as secondary/tertiary drugs.
Age at Admission
Patterns in admissions for injection drug use by age group changed between 1992 and 2009. The proportion of injection admissions that were young adults (aged 18 to 25) more than doubled between 1992 and 2009 (from 10.5 to 26.9 percent), as did the proportion of admissions aged 50 or older (from 4.1 to 10.4 percent) (Table 1). Accordingly, the proportions of injection admissions aged 26 to 34 and aged 35 to 49 decreased over the same time period (from 37.7 to 31.9 percent among those aged 26 to 34 and from 47.2 to 30.1 percent among those aged 35 to 49).
| Age and Race/Ethnicity | All | Heroin | Cocaine | Methamphetamine | Opiates Other than Heroin |
|||||
|---|---|---|---|---|---|---|---|---|---|---|
| 1992 | 2009 | 1992 | 2009 | 1992 | 2009 | 1992 | 2009 | 1992 | 2009 | |
| Total | 100.0% | 100.0% | 100.0% | 100.0% | 100.0% | 100.0% | 100.0% | 100.0% | 100.0% | 100.0% |
| Age | ||||||||||
| 12-17 | 0.5% | 0.7% | 0.3% | 0.6% | 0.5% | 0.3% | 0.9% | 0.6% | 0.4% | 1.4% |
| 18-25 | 10.5% | 26.9% | 8.4% | 27.6% | 11.7% | 20.5% | 19.8% | 19.3% | 6.9% | 39.0% |
| 26-34 | 37.7% | 31.9% | 34.4% | 30.8% | 41.4% | 32.9% | 49.2% | 37.0% | 36.8% | 36.4% |
| 35-49 | 47.2% | 30.1% | 51.9% | 29.4% | 43.4% | 35.4% | 28.9% | 37.4% | 52.8% | 18.9% |
| 50 or Older | 4.1% | 10.4% | 5.0% | 11.6% | 3.0% | 10.9% | 1.2% | 5.7% | 3.1% | 4.3% |
| Race/Ethnicity | ||||||||||
| White, Non-Hispanic | 55.2% | 73.4% | 49.4% | 69.9% | 51.8% | 64.3% | 86.5% | 85.3% | 82.9% | 91.0% |
| Black, Non-Hispanic | 20.9% | 7.8% | 21.9% | 9.0% | 27.5% | 11.0% | 3.2% | 1.4% | 11.6% | 2.0% |
| Hispanic | 20.8% | 15.2% | 25.7% | 18.0% | 17.7% | 21.5% | 5.9% | 6.6% | 3.4% | 3.2% |
| American Indian/Alaska Native | 1.4% | 1.2% | 1.0% | 0.7% | 1.5% | 1.1% | 3.1% | 3.5% | 1.2% | 2.0% |
| Other | 1.7% | 2.4% | 2.0% | 2.4% | 1.5% | 2.1% | 1.3% | 3.2% | 0.9% | 1.8% |
| Source: SAMHSA Treatment Episode Data Set (TEDS), 1992 and 2009. | ||||||||||
Heroin injection admissions followed similar trends, with the proportion of young adult admissions increasing from 8.4 percent in 1992 to 27.6 percent in 2009, and the proportion of admissions aged 50 or older increasing from 5.0 percent in 1992 to 11.6 percent in 2009.
Cocaine injection admissions and admissions for injection of opiates other than heroin also showed marked increases in the proportion of young adult admissions: among cocaine injection admissions, from 11.7 percent in 1992 to 20.5 percent in 2009, and among admissions for injection of opiates other than heroin, from 6.9 percent in 1992 to 39.0 percent in 2009.
Race/Ethnicity
The pattern of admissions for injection drug use by race/ethnicity also changed between 1992 and 2009. The proportion of all injection admissions that were non-Hispanic White increased from 55.2 percent in 1992 to 73.4 percent in 2009 (Table 1). This change reflected increases in the proportion of non-Hispanic Whites among both cocaine injection admissions (from 51.8 to 64.3 percent) and heroin injection admissions (from 49.4 to 69.9 percent).
By contrast, the proportion of all injection admissions that were non-Hispanic Black decreased from 20.9 percent in 1992 to 7.8 percent in 2009. Further, the proportion of injection admissions that were non-Hispanic Black decreased among both cocaine injection admissions (from 27.5 to 11.0 percent) and heroin injection admissions (from 21.9 to 9.0 percent).
The proportion of all injection admissions that were Hispanic decreased from 20.8 percent in 1992 to 15.2 percent in 2009. The proportion of Hispanics decreased among heroin injection admissions (from 25.7 to 18.0 percent), but increased among cocaine injection admissions (from 17.7 to 21.5 percent).
Discussion
The increased proportion of injection admissions that were young adults (aged 18 to 25) is a noteworthy finding. Without effective treatment, they could spend more years injecting drugs, thus placing them at a greater risk of contracting and spreading HIV and other blood-borne infections than older injection admissions. While prevention remains the best long-term strategy, increasing numbers of young heroin injection admissions also suggest a continued and growing need for buprenorphine treatment programs, since many experts in opioid addiction treatment consider buprenorphine the treatment of choice for patients with relatively short addiction histories.3
Older admissions (50 years of age or older) also comprise a growing proportion of injection admissions (including heroin injection admissions). Taken together with research that indicates that persons aged 50 or older account for 15 percent of new HIV/AIDS cases and that more than 16 percent of AIDS cases among older adults are related to injection drug use,4 these data suggest the need for renewed prevention and treatment efforts targeted toward older adults.
Finally, the data show that examining primary injection admissions alone would ignore a substantial number of secondary/tertiary injection admissions. Overall, about 1 in 7 injection admissions in 2009 were non-primary injection admissions. Public health professionals and substance abuse providers who monitor secondary/tertiary injection drug use may identify users at risk for disease transmission who would otherwise be overlooked if surveillance focused only on primary injection drug use.
End Notes
1 Centers for Disease Control and Prevention. (2011). Diagnoses of HIV infection and AIDS in the United States and dependent areas, 2009
(HIV Surveillance Report, Vol. 21). Atlanta, GA: U.S. Department of Health and Human Services. Retrieved from http://www.cdc.gov/hiv/topics/surveillance/resources/reports/
2 An injection admission is a substance abuse treatment admission reporting the injection of a specific primary, secondary, or tertiary drug. The proportions of injection admissions are likewise among admissions reporting specific substance use. Admissions are restricted to those aged 12 years or older.
3 Center for Substance Abuse Treatment. (2004). Clinical guidelines for the use of buprenorphine in the treatment of opioid addiction (Treatment Improvement Protocol [TIP] Series 40. DHHS Publication No. SMA 04-3939). Rockville, MD: Substance Abuse and Mental Health Services Administration.
4 Centers for Disease Control and Prevention. (February, 2008). HIV/AIDS among persons aged 50 and older (CDC HIV/AIDS Facts). Atlanta, GA: U.S. Department of Health and Human Services. Retrieved from http://www.cdc.gov/hiv/topics/over50/resources/factsheets/pdf/over50.pdf
Suggested Citation
Substance Abuse and Mental Health Services Administration, Center for Behavioral Health Statistics and Quality. (December 1, 2011). The TEDS Report: Injection Drug Abuse Admissions to Substance Abuse Treatment: 1992 and 2009. Rockville, MD.
The Treatment Episode Data Set (TEDS) is a compilation of data on the demographic characteristics and substance abuse problems of those aged 12 or older admitted for substance abuse treatment. TEDS is one component of the Drug and Alcohol Services Information System (DASIS), an integrated data system maintained by the Center for Behavioral Health Statistics and Quality (CBHSQ), Substance Abuse and Mental Health Services Administration (SAMHSA). TEDS information comes primarily from facilities that receive some public funding. Information on treatment admissions is routinely collected by State administrative systems and then submitted to SAMHSA in a standard format. TEDS records represent admissions rather than individuals, as a person may be admitted to treatment more than once. State admission data are reported to TEDS by the Single State Agencies (SSAs) for substance abuse treatment. There are significant differences among State data collection systems. Sources of State variation include completeness of reporting, facilities reporting TEDS data, clients included, and treatment resources available. See the annual TEDS reports for details. TEDS received approximately 2.0 million treatment admission records from 49 States and Puerto Rico for 2009. Definitions for demographic, substance use, and other measures mentioned in this report are available in the following publication: Substance Abuse and Mental Health Services Administration, Office of Applied Studies. (December 11, 2009). The TEDS Report: TEDS Report Definitions. Rockville, MD. The TEDS Report is prepared by the Center for Behavioral Health Statistics and Quality, SAMHSA; Synectics for Management Decisions, Inc., Arlington, VA; and RTI International, Research Triangle Park, NC. Information and data for this issue are based on data reported to TEDS through November 3, 2010. Access the latest TEDS reports at: |
The TEDS Report is published periodically by the Center for Behavioral Health Statistics and Quality (formerly the Office of Applied Studies), Substance Abuse and Mental Health Services Administration (SAMHSA). All material appearing in this report is in the public domain and may be reproduced or copied without permission from SAMHSA. Additional copies of this report or other reports from the Center for Behavioral Health Statistics and Quality are available online: http://oas.samhsa.gov. Citation of the source is appreciated. For questions about this report, please e-mail: shortreports@samhsa.hhs.gov. TEDS_012 |
This page was last updated on May 18, 2010. |