
|
| August 23, 2007 |
|
Combined data from 2002 to 2004 indicate that the prevalence of alcohol and illicit drug use among adults aged 18 to 64 was higher among unemployed persons than among persons in other employment groups (Table 1). Among adults aged 18 to 64, an estimated 18.6 percent of those who were unemployed used illicit drugs in the past month compared with 11.9 percent of those employed part time, 8.2 percent of those employed full time, and 8.3 percent of those in other employment statuses. Approximately 13.6 percent of unemployed adults aged 18 to 64 drank alcohol heavily in the past month compared with 8.8 percent of those employed full time.
| Employment Status | Illicit Drug Use | Heavy Alcohol Use | ||
|---|---|---|---|---|
| Percent | Number in Thousands |
Percent | Number in Thousands |
|
| Total | 9.2 | 16,363 | 8.4 | 15,017 |
| Full-Time | 8.2 | 9,413 | 8.8 | 10,113 |
| Part-Time | 11.9 | 2,903 | 8.6 | 2,094 |
| Unemployed | 18.6 | 1,405 | 13.6 | 1,028 |
| Other* | 8.3 | 2,642 | 5.6 | 1,783 |
| Source: SAMHSA, 2002, 2003, and 2004 NSDUHs. |
Reflecting the fact that almost two thirds of the adult population (64.3 percent) were employed full time, a majority of past month illicit drug and heavy alcohol users also were employed full time. From 2002 to 2004, over half of all past month illicit drug users (57.5 percent) and past month heavy alcohol users (67.3 percent) aged 18 to 64 were employed full time.
Among the 19 major industry categories, the highest rates of past month illicit drug use among full-time workers aged 18 to 64 were found in accommodations and food services (16.9 percent) and construction (13.7 percent) (Figure 1). The industry categories with the lowest rates of past month illicit drug use were utilities (3.8 percent), educational services (4.0 percent), and public administration (4.1 percent).
 |
| Industry Categories | Percent |
|---|---|
| Accommodations and Food Services | 16.9 |
| Construction | 13.7 |
| Arts, Entertainment, and Recreation | 11.6 |
| Information | 11.3 |
| Management of Companies and Enterprises, Administrative, Support, Waste Management, and Remediation Services | 10.9 |
| Retail Trade | 9.4 |
| Other Services (Except Public Administration) | 8.8 |
| Wholesale Trade | 8.5 |
| Professional, Scientific, and Technical Services | 8.0 |
| Real Estate, Rental, and Leasing | 7.5 |
| Mining | 7.3 |
| Finance and Insurance | 6.8 |
| Manufacturing | 6.5 |
| Transportation and Warehousing | 6.2 |
| Agriculture, Forestry, Fishing, and Hunting | 6.2 |
| Health Care and Social Assistance | 6.1 |
| Public Administration | 4.1 |
| Educational Services | 4.0 |
| Utilities | 3.8 |
| Source: SAMHSA, 2002, 2003, and 2004 NSDUHs. |
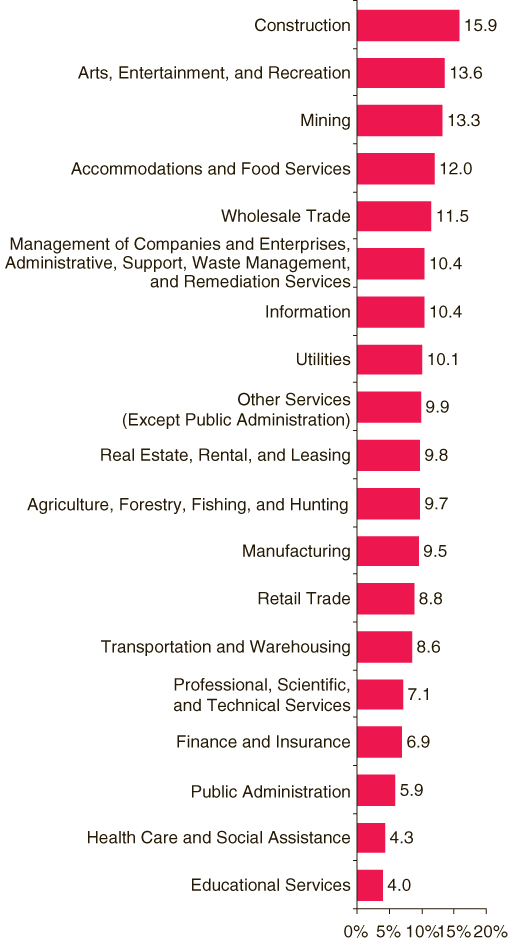
Among full-time workers aged 18 to 64, the highest rates of past month heavy alcohol use were found in construction (15.9 percent); arts, entertainment, and recreation (13.6 percent); and mining (13.3 percent) (Figure 2). The industry categories with the lowest rates of heavy alcohol use were educational services (4.0 percent) and health care and social assistance (4.3 percent).
 |
| Industry Categories | Percent |
|---|---|
| Construction | 15.9 |
| Arts, Entertainment, and Recreation | 13.6 |
| Mining | 13.3 |
| Accommodations and Food Services | 12.0 |
| Wholesale Trade | 11.5 |
| Management of Companies and Enterprises, Administrative, Support, Waste Management, and Remediation Services | 10.4 |
| Information | 10.4 |
| Utilities | 10.1 |
| Other Services (Except Public Administration) | 9.9 |
| Real Estate, Rental, and Leasing | 9.8 |
| Agriculture, Forestry, Fishing, and Hunting | 9.7 |
| Manufacturing | 9.5 |
| Retail Trade | 8.8 |
| Transportation and Warehousing | 8.6 |
| Professional, Scientific, and Technical Services | 7.1 |
| Finance and Insurance | 6.9 |
| Public Administration | 5.9 |
| Health Care and Social Assistance | 4.3 |
| Educational Services | 4.0 |
| Source: SAMHSA, 2002, 2003, and 2004 NSDUHs. |
Among full-time workers aged 18 to 64 who had used an illicit drug in the past month, 32.1 percent worked for an employer who offered educational information about alcohol and drug use, 71.0 percent were aware of a written policy about drug and alcohol use in the workplace, and 45.4 percent worked for an employer who maintained an EAP or other type of counseling program for employees who have an alcohol- or drug-related problem (Figure 3). Among full-time workers who used alcohol heavily in the past month, 37.2 percent worked for an employer who provided educational information about drug and alcohol use, 73.7 percent were aware of written policies about drug and alcohol use, and 51.1 percent had access to an EAP at their workplace.
 |
| Educational Information |
Written Policy | Employee Assistance Program |
|
|---|---|---|---|
| Past Month Illicit Drug Use | 32.1 | 71.0 | 45.4 |
| Past Month Heavy Alcohol Use | 37.2 | 73.7 | 51.1 |
| Source: SAMHSA, 2002, 2003, and 2004 NSDUHs. |
|
The National Survey on Drug Use and Health (NSDUH) is an annual survey sponsored by the Substance Abuse and Mental Health Services Administration (SAMHSA). The 2002, 2003, and 2004 data used in this report are based on information obtained from a total of 127,976 persons aged 18 to 64. The survey collects data by administering questionnaires to a representative sample of the population through face-to-face interviews at their place of residence. The NSDUH Report is prepared by the Office of Applied Studies (OAS), SAMHSA, and by RTI International in Research Triangle Park, North Carolina. (RTI International is a trade name of Research Triangle Institute.) Information on NSDUH used in compiling data for this issue is available in the following publications: Office of Applied Studies. (2005). Results from the 2004 National Survey on Drug Use and Health: National findings (DHHS Publication No. SMA 05-4062, NSDUH Series H-28). Rockville, MD: Substance Abuse and Mental Health Services Administration. Office of Applied Studies. (2004). Results from the 2003 National Survey on Drug Use and Health: National findings (DHHS Publication No. SMA 04-3964, NSDUH Series H-25). Rockville, MD: Substance Abuse and Mental Health Services Administration. Office of Applied Studies. (2003). Results from the 2002 National Survey on Drug Use and Health: National findings (DHHS Publication No. SMA 03-3836, NSDUH Series H-22). Rockville, MD: Substance Abuse and Mental Health Services Administration. Also available online: http://www.oas.samhsa.gov. Because of improvements and modifications to the 2002 NSDUH, estimates from the 2002 through 2004 surveys should not be compared with estimates from the 2001 or earlier versions of the survey to examine changes over time. |
| The NSDUH Report is published periodically by the Office of Applied Studies, Substance Abuse and Mental Health Services Administration (SAMHSA).All material appearing in this report is in the public domain and may be reproduced or copied without permission from SAMHSA. Additional copies of this report or other reports from the Office of Applied Studies are available online: http://www.oas.samhsa.gov. Citation of the source is appreciated. For questions about this report, please e-mail: shortreports@samhsa.hhs.gov. |
|
This page was last updated on December 30, 2008. |