|
|
India's Organized Manufacturing Sector
Background
BLS has undertaken the development of estimates of employment and hourly compensation costs in India's organized manufacturing sector. Data are published in the BLS news release International Comparisons of Hourly Compensation Costs in Manufacturing and are shown below. Compensation costs for India are not directly comparable with the data for the other countries in this release, and therefore are presented separately.
A complete discussion of data comparability issues and methods used to calculate the estimates can be found in the May 2010 Monthly Labor Review article "Labor costs in India's organized manufacturing sector," available online at www.bls.gov/opub/mlr/2010/05/art1full.pdf.
The "organized sector" refers to the portion of India's manufacturing activity that is formally registered with state governments, and is thus subject to regulation.
Data Features
It is important to note the following features of the source data that limit comparability between these and main BLS estimates:
Data treatment
The Annual Survey of Industries (ASI), the source for these estimates, does not adjust the data to correct for missing, incomplete, or incorrect data. Also, penalties for noncompliance are rarely enforced. These problems cause the data to be less reliable than survey data that are adjusted by the receiving statistical agency, or data that are weighted to be representative of the entire survey population.
Organized vs. unorganized sector
These data cover India's organized manufacturing sector only, i.e., the portion of India's manufacturing activity that is formally registered with state governments, and is thus subject to regulation. The unorganized sector is not regulated, and little data exist for its enterprises. The organized sector produces two-thirds of India's manufacturing output; however, close to 80 percent of Indian manufacturing employees work in the unorganized sector. Although BLS is currently conducting additional research on the unorganized sector, the current lack of information on this sector means that a large segment of the manufacturing workforce is not represented in these data.
Contract labor
Contract workers, who are cheaper to employ because they are often not provided with benefits such as social insurance and paid vacation, make up a significant proportion of manufacturing workers in India (see Table 1). Data do not exist to remove contract workers' earnings from the earnings of other workers, as BLS does for its main series; as a result, it is likely that the labor cost estimates are lower than they would be if they excluded contract workers.
Hours
Hours actually worked are not recorded by the ASI, thus, it is not clear how much work is occurring "off the books." Information gained from personal interviews indicates that overtime work is common, but that it is not always compensated at the legally required rate of two times the usual salary. Although earnings, hours, and employment that are not documented by employers likely affect the hourly compensation estimates presented in this article, no adjustments have been made because the magnitude of the unrecorded data is not known.
Data Tables
Table 1. Employment in India's organized manufacturing sector, 1998-2008
(Numbers in thousands)
| Type of employees |
1998-99 |
1999-2000 |
2000-01 |
2001-02 |
2002-03 |
2003-04 |
2004-05 |
2005-06 |
2006-07 |
2007-08 |
| All employees |
8,317 |
7,857 |
7,634 |
7,400 |
7,590 |
7,518 |
8,064 |
8,688 |
9,575 |
9,973 |
| All production workers |
6,174 |
6,049 |
5,933 |
5,757 |
5,961 |
5,887 |
6,373 |
6,893 |
7,606 |
7,926 |
| Directly employed |
5,213 |
4,857 |
4,725 |
4,507 |
4,591 |
4,440 |
4,685 |
4,920 |
5,318 |
5,461 |
| Employed through contractors |
961 |
1,192 |
1,208 |
1,250 |
1,370 |
1,447 |
1,688 |
1,973 |
2,288 |
2,465 |
| Employees other than production workers |
2,143 |
1,808 |
1,701 |
1,643 |
1,629 |
1,631 |
1,691 |
1,795 |
1,969 |
2,047 |
SOURCES: For fiscal years 1999-2005, Jessica R. Sincavage, Carl Haub, and O.P. Sharma, "Labor Costs in India's organized manufacturing sector," Monthly Labor Review, May 2010, p.6, available at www.bls.gov/opub/mlr/2010/05/art1full.pdf.
For fiscal years 2006-2007, data were estimated by the Division of International Labor Comparisons using the sources and methodology described in the article.
NOTE: Because of rounding, not all sums of components equal their respective totals. Time periods refer to the Indian fiscal year, which runs from April 1 to March 31; e.g., 1998-99 refers to the fiscal year from April 1, 1998 to March 31, 1999.
Table 2. Hourly compensation costs in India's organized manufacturing sector, 1999-2007
| Year |
Mean hourly earnings in rupees
(hourly pay for time worked) |
Hourly compensation in rupees |
Hourly compensation in U.S. dollars |
| All employees |
Production
workers |
All employees |
Production
workers |
All employees |
Production
workers |
| 1999 |
20.68 |
15.97 |
29.43 |
22.72 |
0.68 |
0.53 |
| 2000 |
22.54 |
16.97 |
31.68 |
23.86 |
0.70 |
0.53 |
| 2001 |
23.77 |
17.57 |
33.65 |
24.88 |
0.71 |
0.53 |
| 2002 |
24.95 |
18.22 |
35.36 |
25.83 |
0.73 |
0.53 |
| 2003 |
26.58 |
18.98 |
37.68 |
26.91 |
0.81 |
0.58 |
| 2004 |
27.57 |
19.46 |
38.55 |
27.21 |
0.85 |
0.60 |
| 2005 |
29.10 |
20.06 |
40.02 |
27.60 |
0.91 |
0.63 |
| 2006 |
31.37 |
21.18 |
43.07 |
29.08 |
0.95 |
0.64 |
| 2007 |
35.46 |
23.25 |
48.30 |
31.67 |
1.17 |
0.77 |
SOURCES: For 1999-2005, Jessica R. Sincavage, Carl Haub, and O.P. Sharma, "Labor Costs in India's organized manufacturing sector," Monthly Labor Review, May 2010, p.10, available at www.bls.gov/opub/mlr/2010/05/art1full.pdf.
For 2006-2007, data were estimated by the Division of International Labor Comparisons using the sources and methodology described in the article.
Table 3. Employment in subsectors within India's organized manufacturing sector, 2005-06
| NAICS code(s) |
Subsector(s) |
Percent of total manufacturing employment (8,688) |
| 31-33 |
All manufacturing (excluding publishing) |
100.0 |
| 311-312 |
Food, beverage, and tobacco |
20.9 |
| 313-314 |
Textiles and textile product mills |
15.3 |
| 325 |
Chemicals |
9.5 |
| 331 |
Primary metals |
7.4 |
| 327 |
Nonmetallic mineral products |
6.6 |
| 336 |
Transportation equipment |
6.4 |
| 315 |
Apparel |
6.2 |
| 333 |
Machinery |
5.3 |
| 332 |
Fabricated metal products |
4.2 |
| 326 |
Plastics and rubber products |
3.6 |
| 335 |
Electrical equipment, appliances, and components |
3.1 |
| 322 |
Paper |
2.3 |
| 316 |
Leather and allied products |
2.0 |
| 334 |
Computer and electronic products |
1.6 |
| 324 |
Petroleum and coal products |
1.0 |
| 321 |
Wood products |
0.6 |
| 337 |
Furniture and related products |
0.4 |
SOURCE: Jessica R. Sincavage, Carl Haub, and O.P. Sharma, "Labor Costs in India's organized manufacturing sector," Monthly Labor Review, May 2010, p.15, available at www.bls.gov/opub/mlr/2010/05/art1full.pdf.
NOTE: The sum of the subsectors' shares of total manufacturing employment does not equal 100 because of the exclusion from the table of certain subsectors whose data BLS does not publish.
Charts
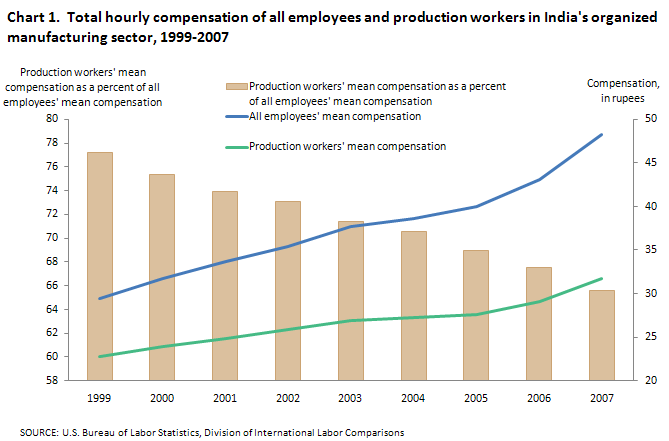
SOURCES: For 1999-2005, Jessica R. Sincavage, Carl Haub, and O.P. Sharma, "Labor Costs in India's organized manufacturing sector," Monthly Labor Review, May 2010, p.12, available at www.bls.gov/opub/mlr/2010/05/art1full.pdf.
For 2006-2007, data were estimated by the Division of International Labor Comparisons using the sources and methodology described in the article.
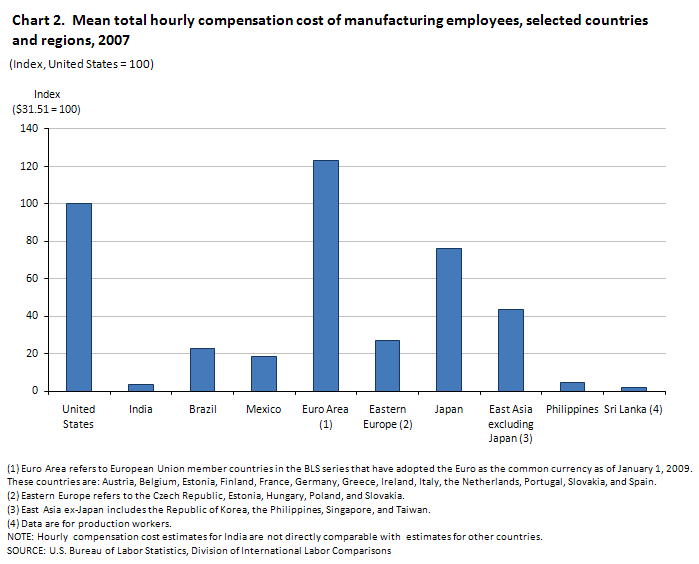
SOURCE: Data were estimated by the Division of International Labor Comparisons using the sources and methodology described in the article "Labor Costs in India's organized manufacturing sector," by Jessica R. Sincavage, Carl Haub, and O.P. Sharma, Monthly Labor Review, May 2010, available at www.bls.gov/opub/mlr/2010/05/art1full.pdf.
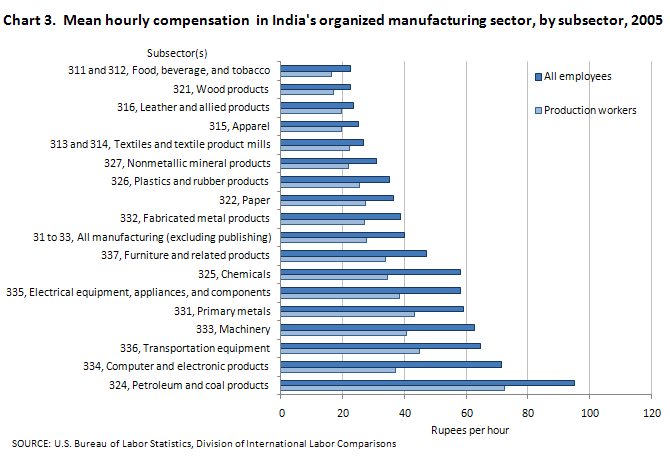
SOURCE: Jessica R. Sincavage, Carl Haub, and O.P. Sharma, "Labor Costs in India's organized manufacturing sector," Monthly Labor Review, May 2010, p.14, available at www.bls.gov/opub/mlr/2010/05/art1full.pdf.
Comparison with China
Although BLS hourly compensation cost estimates are not directly comparable with those for China or the United States, it is possible to look at them together for a rough indication of their relative compensation costs.
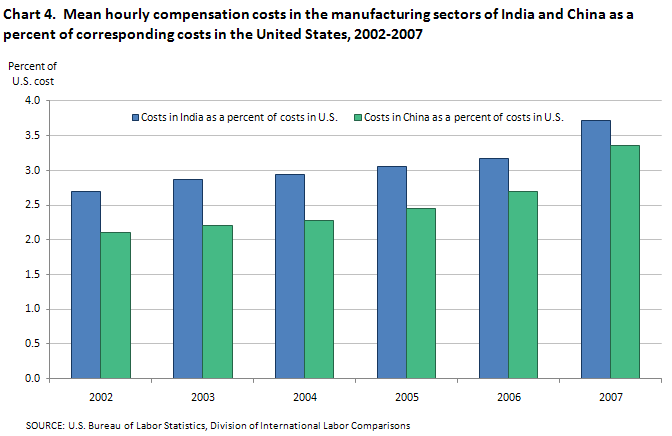
SOURCES: For 2002-2005, Jessica R. Sincavage, Carl Haub, and O.P. Sharma, "Labor Costs in India's organized manufacturing sector," Monthly Labor Review, May 2010, p.18, available at www.bls.gov/opub/mlr/2010/05/art1full.pdf.
For 2006-2007, data were estimated by the Division of International Labor Comparisons using the sources and methodology described in the article.
Publications
- "Labor costs in India's organized manufacturing sector," (PDF) by Jessica R. Sincavage, Carl Haub, and O.P. Sharma, Monthly Labor Review, May 2010, pp. 3-22.
Last Modified Date: July 20, 2011
|