|
|
International Comparisons of GDP per Capita and per Hour, 1960–2010
Entire report (PDF 504KB)
Data tables and charts (XLS)
On This Page:
Introduction
Charts
Tables
- Table 1. Real GDP per capita, by country, 1960–2010
- Table 2. Real GDP per employed person, by country, 1960–2010
- Table 3. Real GDP per hour worked, by country, 1960–2010
- Table 4. Real GDP, by country, 1960–2010
- Table 5. Population, by country, 1960–2010
- Table 6. Employment, by country, 1960–2010
- Table 7. Average annual hours worked per employed person,
by country, 1960–2010
- Table 8. Employment as percentage of population, by country,
1960–2010
- Table 9. Purchasing power parities (PPP), exchange rates and
relative prices, by country, 2010
Technical Notes
|
|
Contact Us
Divison of International Labor
Comparisons (ILC)
- Inquiries and Feedback
ILCHelp@bls.gov or (202) 691-5654
- Web site www.bls.gov/ilc/#gdp
- Subscribe to the ILC e-newsletter
JustOut!
Email ILCPR@bls.gov with "subscribe" in the subject line.
JustOut! provides links to the latest ILC releases, which usually occur once or twice per month.
See Also: Accompanying excel file contains an updated dynamic dashboard
|
Introduction
This report updates the international comparisons report on GDP per capita and related measures produced annually by the Bureau of Labor Statistics (BLS). Charts on current levels and recent trends of GDP per capita, GDP per hour worked, average annual hours worked, and employment are followed by tables with time series and growth rates of these and related indicators. The estimates shown in this report are based on data available as of August 2010. Data are available for all countries through 2010.
Concepts and Definitions
Gross Domestic Product (GDP) is defined as the value of all market and some nonmarket goods and services produced within a country's geographic borders. As such, it is the most comprehensive measure of a country's economic output that is estimated by statistical agencies. GDP per capita may therefore be viewed as a rough indicator of a nation's economic well being, while GDP per hour worked can provide a general picture of a country's productivity.
These indicators, however, are only approximations. The total production of a country consists of many things that are not included in its GDP, for example leisure, health, safety, and cultural resources. Due to these types of data limitations, small differences in rankings should not be considered economically significant. Nevertheless, these measures are commonly used to compare the economic performance of different countries.
For international comparisons of levels of GDP, GDP per capita, or GDP per hour worked, the output has to be measured in a common currency unit. BLS converted the output measures from national currency units to U.S. dollars through the use of purchasing power parities (PPPs). PPPs are currency conversion rates that allow output in different currency units to be expressed in a common unit of value - in this case, U.S. dollars. The PPP for a given country is a ratio, where the numerator is the number of national currency units needed to purchase a specific basket of goods and services in that country and the denominator is the number of U.S. dollars needed to purchase a similar basket of goods in the United States, the base country.
This report now uses 2010 PPPs instead of 2009 PPPs. In addition, since the previous update, the organizations that publish the PPPs have revised their earlier data. As a result, GDP for some countries may have changed.
For further information on sources and methods see Technical notes. Additional historical data on GDP per capita, GDP per hour worked, and related measures are available on the Internet, at www.bls.gov/ilc/#gdp.
Charts
Chart 1. Real GDP per capita growth
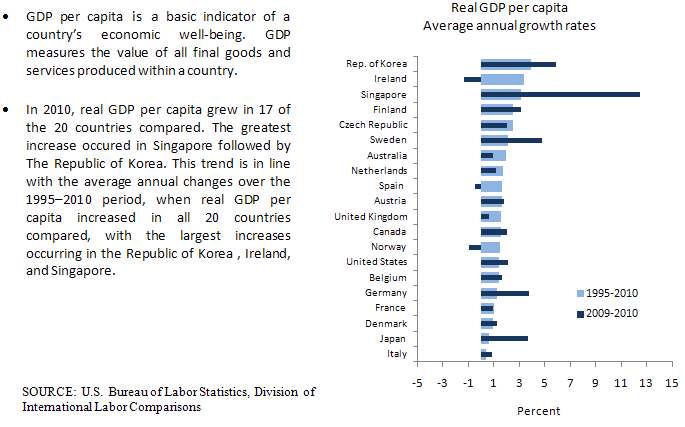
Chart 2. GDP per capita, 2010
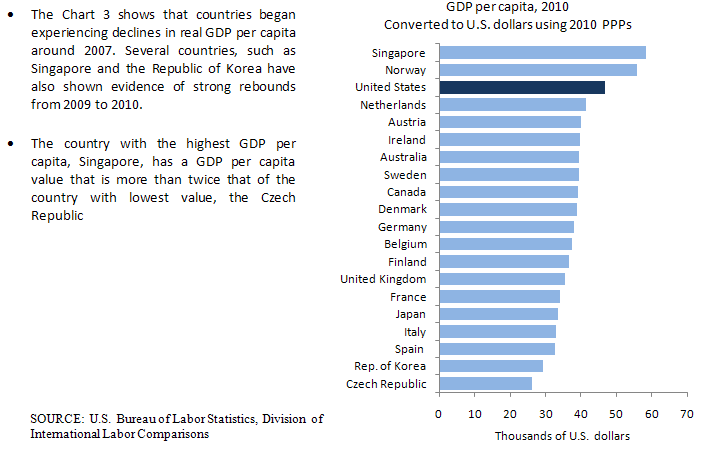
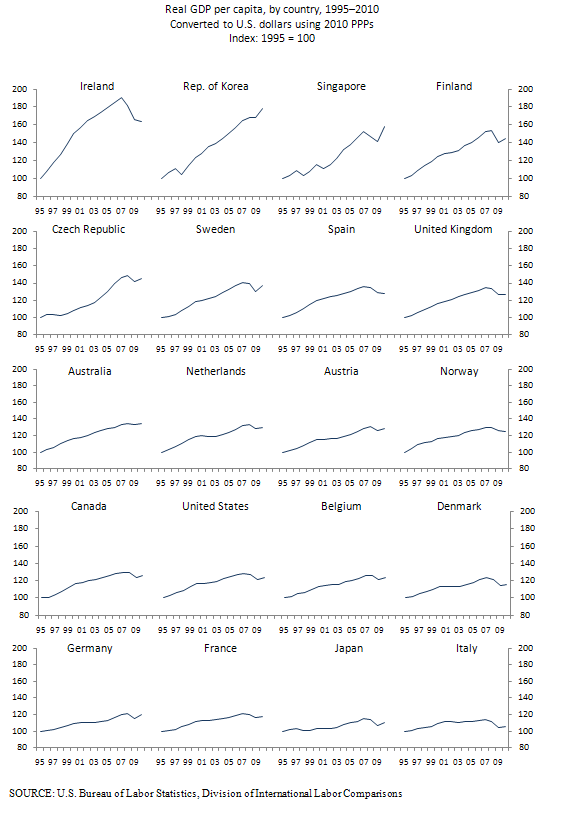
Chart 3. Real GDP per capita, by country, 1995–2010
 Back to Top Back to Top
Chart 4. GDP per hour worked, 2010
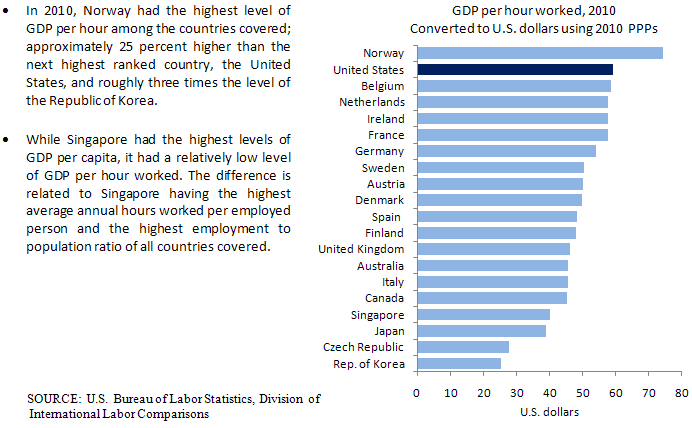
Chart 5. Real GDP per hour worked growth
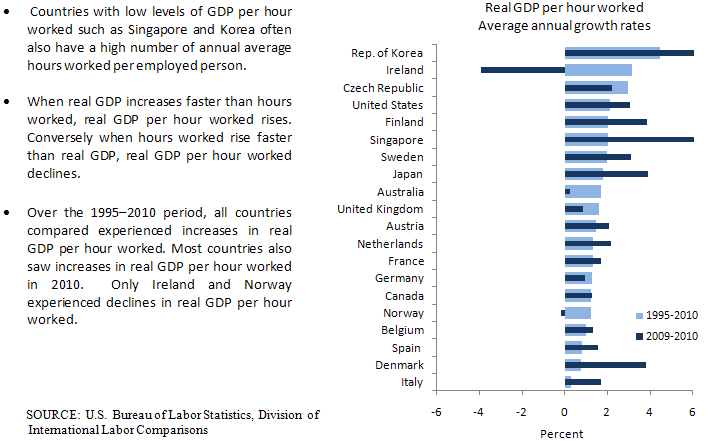
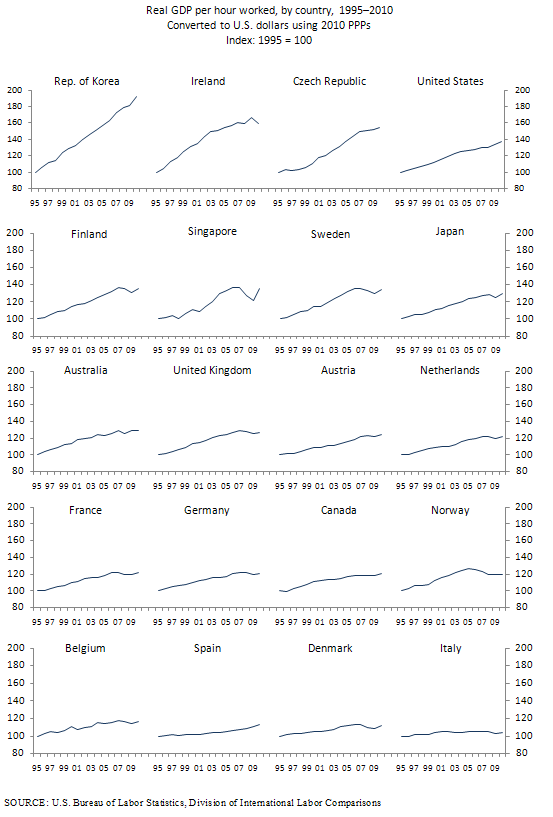
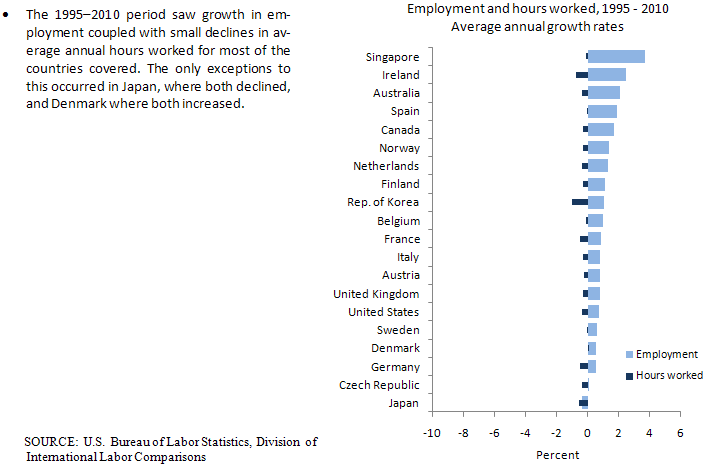
Chart 6. Real GDP per hour worked, by country, 1995–2010
Back to Top
Chart 7. Average annual hours worked, 2010
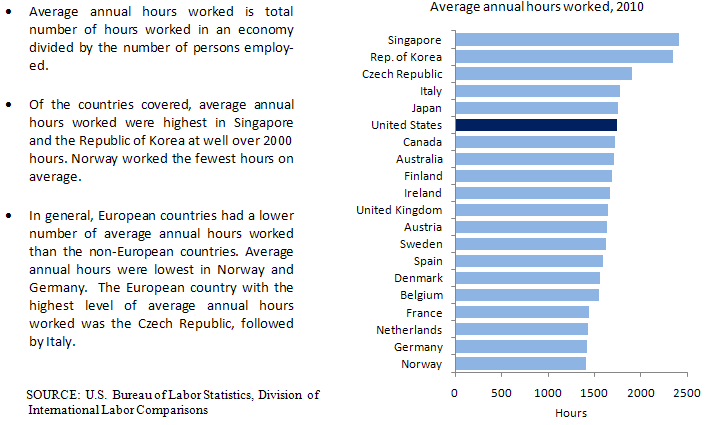
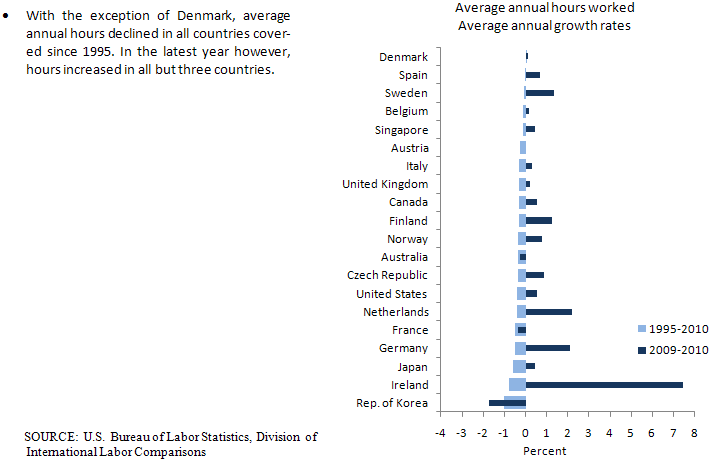
Chart 8. Average annual hours worked growth
Back to Top
Chart 9. Employment and average hours worked, 2010
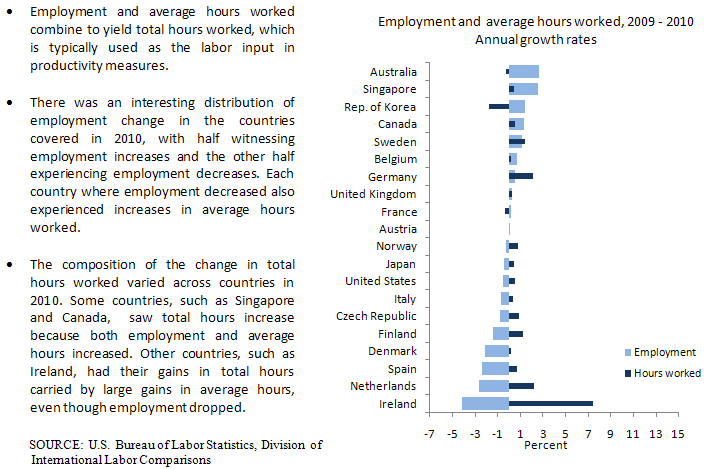
Chart 10. Employment and average hours worked growth
Back to Top
Tables
GDP per capita, by country, 1960–2010
Table 1a. Converted to U.S. dollars using 2010 PPPs (2010 U.S. dollars)
Country |
1960 |
1979 |
1990 |
1995 |
2000 |
2005 |
2009 |
2010 |
United States |
17,368 |
28,845 |
35,612 |
37,829 |
44,081 |
47,296 |
45,854 |
46,844 |
Canada |
14,436 |
25,501 |
30,040 |
30,925 |
36,153 |
38,955 |
38,323 |
39,104 |
Australia |
14,893 |
22,388 |
27,150 |
29,376 |
34,101 |
37,760 |
39,137 |
39,497 |
Japan |
5,938 |
19,004 |
28,848 |
30,445 |
31,586 |
33,457 |
32,424 |
33,612 |
Republic of Korea |
1,510 |
5,423 |
11,781 |
16,373 |
20,225 |
24,601 |
27,562 |
29,184 |
Singapore |
4,331 |
15,540 |
28,186 |
36,727 |
42,626 |
50,849 |
51,787 |
58,240 |
Austria |
11,339 |
23,518 |
29,153 |
31,192 |
35,851 |
37,787 |
39,222 |
39,928 |
Belgium |
11,441 |
22,683 |
28,526 |
30,325 |
34,521 |
36,514 |
36,792 |
37,411 |
Czech Republic |
NA |
NA |
NA |
18,010 |
19,497 |
23,513 |
25,535 |
26,063 |
Denmark |
14,084 |
24,934 |
30,374 |
33,508 |
37,791 |
39,629 |
38,284 |
38,778 |
Finland |
NA |
19,639 |
26,737 |
25,312 |
31,580 |
35,480 |
35,535 |
36,661 |
France |
11,062 |
23,109 |
28,004 |
29,135 |
32,596 |
34,045 |
33,853 |
34,168 |
Germany |
13,003 |
23,778 |
29,444 |
31,618 |
34,698 |
35,622 |
36,635 |
38,021 |
Ireland |
NA |
15,151 |
19,870 |
24,173 |
36,453 |
43,479 |
40,184 |
39,664 |
Italy |
10,320 |
22,503 |
29,315 |
31,158 |
34,176 |
34,703 |
32,723 |
32,997 |
Netherlands |
13,850 |
24,861 |
29,491 |
31,935 |
37,810 |
39,395 |
41,033 |
41,512 |
Norway |
14,960 |
29,907 |
38,474 |
44,951 |
52,279 |
56,667 |
56,443 |
55,938 |
Spain |
NA |
18,415 |
23,933 |
25,439 |
30,432 |
33,154 |
32,774 |
32,625 |
Sweden |
13,807 |
23,410 |
28,668 |
28,784 |
34,038 |
38,179 |
37,594 |
39,407 |
United Kingdom |
13,610 |
20,753 |
26,204 |
28,040 |
32,716 |
36,182 |
35,389 |
35,621 |
|||||||||
|
NA = Not available.
Note: Data for Germany for years before 1991 pertain to the former West Germany.
PPPs = purchasing power parities.
|
Table 1b. Average annual rates of change
Country |
1979–2010 |
1979–90 |
1990–95 |
1995–2000 |
2000–10 |
2008–09 |
2009–10 |
United States |
1.6 |
1.9 |
1.2 |
3.1 |
0.6 |
-4.3 |
2.2 |
Canada |
1.4 |
1.5 |
0.6 |
3.2 |
0.8 |
-3.9 |
2.0 |
Australia |
1.8 |
1.8 |
1.6 |
3.0 |
1.5 |
-0.8 |
0.9 |
Japan |
1.9 |
3.9 |
1.1 |
0.7 |
0.6 |
-6.2 |
3.7 |
Republic of Korea |
5.6 |
7.3 |
6.8 |
4.3 |
3.7 |
0.0 |
5.9 |
Singapore |
4.4 |
5.6 |
5.4 |
3.0 |
3.2 |
-3.7 |
12.5 |
Austria |
1.7 |
2.0 |
1.4 |
2.8 |
1.1 |
-4.2 |
1.8 |
Belgium |
1.6 |
2.1 |
1.2 |
2.6 |
0.8 |
-3.5 |
1.7 |
Czech Republic |
NA |
NA |
NA |
1.6 |
2.9 |
-4.7 |
2.1 |
Denmark |
1.4 |
1.8 |
2.0 |
2.4 |
0.3 |
-5.7 |
1.3 |
Finland |
2.0 |
2.8 |
-1.1 |
4.5 |
1.5 |
-8.7 |
3.2 |
France |
1.3 |
1.8 |
0.8 |
2.3 |
0.5 |
-3.3 |
0.9 |
Germany |
NA |
2.0 |
NA |
1.9 |
0.9 |
-4.4 |
3.8 |
Ireland |
3.2 |
2.5 |
4.0 |
8.6 |
0.8 |
-8.2 |
-1.3 |
Italy |
1.2 |
2.4 |
1.2 |
1.9 |
-0.4 |
-5.8 |
0.8 |
Netherlands |
1.7 |
1.6 |
1.6 |
3.4 |
0.9 |
-4.0 |
1.2 |
Norway |
2.0 |
2.3 |
3.2 |
3.1 |
0.7 |
-2.9 |
-0.9 |
Spain |
1.9 |
2.4 |
1.2 |
3.6 |
0.7 |
-4.4 |
-0.5 |
Sweden |
1.7 |
1.9 |
0.1 |
3.4 |
1.5 |
-6.1 |
4.8 |
United Kingdom |
1.8 |
2.1 |
1.4 |
3.1 |
0.9 |
-5.5 |
0.7 |
|||||||||
|
NA = Not available.
Note: Data for Germany for years before 1991 pertain to the former West Germany.
Percent changes were calculated using the compound rate method.
|
Back to Top
Real GDP per employed person, by country, 1960–2010
Table 2a. Converted to U.S. dollars using 2010 PPPs (2010 U.S. dollars)
Country |
1960 |
1979 |
1990 |
1995 |
2000 |
2005 |
2009 |
2010 |
United States |
45,970 |
64,344 |
73,655 |
79,708 |
90,001 |
97,720 |
99,624 |
103,229 |
Canada |
41,576 |
57,628 |
63,395 |
68,006 |
75,075 |
77,731 |
76,545 |
77,948 |
Australia |
36,820 |
52,581 |
58,449 |
64,017 |
72,254 |
76,639 |
78,061 |
78,047 |
Japan |
11,787 |
37,808 |
55,437 |
57,146 |
61,405 |
66,882 |
65,364 |
68,233 |
Republic of Korea |
NA |
14,965 |
27,926 |
36,167 |
44,940 |
51,814 |
57,158 |
59,858 |
Singapore |
NA |
32,317 |
53,775 |
73,187 |
81,109 |
95,841 |
86,932 |
97,006 |
Austria |
23,230 |
51,098 |
62,590 |
68,503 |
75,816 |
79,300 |
80,393 |
82,064 |
Belgium |
29,959 |
59,105 |
73,949 |
79,494 |
86,123 |
89,857 |
89,505 |
90,839 |
Czech Republic |
NA |
NA |
NA |
36,140 |
40,539 |
48,208 |
51,262 |
52,863 |
Denmark |
30,250 |
50,271 |
59,846 |
68,655 |
74,378 |
78,745 |
74,858 |
77,821 |
Finland |
NA |
40,897 |
53,749 |
62,984 |
71,276 |
77,905 |
77,095 |
81,050 |
France |
25,810 |
56,234 |
69,062 |
73,692 |
77,971 |
81,968 |
81,974 |
83,050 |
Germany |
27,625 |
54,100 |
61,246 |
68,667 |
72,852 |
75,642 |
74,482 |
76,769 |
Ireland |
NA |
43,258 |
59,349 |
67,878 |
81,788 |
92,176 |
93,064 |
96,069 |
Italy |
24,758 |
60,152 |
73,542 |
81,093 |
84,869 |
83,368 |
79,299 |
80,917 |
Netherlands |
37,637 |
70,815 |
69,351 |
71,688 |
76,492 |
79,251 |
78,904 |
82,403 |
Norway |
35,027 |
64,009 |
79,260 |
92,441 |
101,221 |
111,404 |
104,581 |
105,202 |
Spain |
NA |
49,768 |
61,907 |
67,840 |
71,320 |
71,531 |
74,976 |
76,670 |
Sweden |
28,274 |
45,869 |
53,350 |
61,535 |
70,219 |
79,271 |
78,141 |
81,678 |
United Kingdom |
29,861 |
46,324 |
55,816 |
63,019 |
70,096 |
75,753 |
75,509 |
76,334 |
|||||||||
|
NA = Not available.
Note: Data for Germany for years before 1991 pertain to the former West Germany.
PPPs = purchasing power parities.
|
Table 2b. Average annual rates of change
Country |
1979–2010 |
1979–90 |
1990–95 |
1995–2000 |
2000–10 |
2008–09 |
2009–10 |
United States |
1.5 |
1.2 |
1.6 |
2.5 |
1.4 |
0.2 |
3.6 |
Canada |
1.0 |
0.9 |
1.4 |
2.0 |
0.4 |
-1.2 |
1.8 |
Australia |
1.3 |
1.0 |
1.8 |
2.5 |
0.8 |
0.5 |
-0.0 |
Japan |
1.9 |
3.5 |
0.6 |
1.4 |
1.1 |
-4.9 |
4.4 |
Republic of Korea |
4.6 |
5.8 |
5.3 |
4.4 |
2.9 |
0.6 |
4.7 |
Singapore |
3.6 |
4.7 |
6.4 |
2.1 |
1.8 |
-5.1 |
11.6 |
Austria |
1.5 |
1.9 |
1.8 |
2.0 |
0.8 |
-3.0 |
2.1 |
Belgium |
1.4 |
2.1 |
1.5 |
1.6 |
0.5 |
-2.4 |
1.5 |
Czech Republic |
NA |
NA |
NA |
2.3 |
2.7 |
-3.0 |
3.1 |
Denmark |
1.4 |
1.6 |
2.8 |
1.6 |
0.5 |
-2.4 |
4.0 |
Finland |
2.2 |
2.5 |
3.2 |
2.5 |
1.3 |
-4.9 |
5.1 |
France |
1.3 |
1.9 |
1.3 |
1.1 |
0.6 |
-1.6 |
1.3 |
Germany |
NA |
1.1 |
NA |
1.2 |
0.5 |
-4.7 |
3.1 |
Ireland |
2.6 |
2.9 |
2.7 |
3.8 |
1.6 |
0.6 |
3.2 |
Italy |
1.0 |
1.8 |
2.0 |
0.9 |
-0.5 |
-3.6 |
2.0 |
Netherlands |
0.5 |
-0.2 |
0.7 |
1.3 |
0.7 |
-3.6 |
4.4 |
Norway |
1.6 |
2.0 |
3.1 |
1.8 |
0.4 |
-1.3 |
0.6 |
Spain |
1.4 |
2.0 |
1.8 |
1.0 |
0.7 |
3.1 |
2.3 |
Sweden |
1.9 |
1.4 |
2.9 |
2.7 |
1.5 |
-3.4 |
4.5 |
United Kingdom |
1.6 |
1.7 |
2.5 |
2.2 |
0.9 |
-3.3 |
1.1 |
|||||||||
|
NA = Not available.
Note: Data for Germany for years before 1991 pertain to the former West Germany.
Percent changes were calculated using the compound rate method.
|
Back to Top
Real GDP per hour worked, by country, 1960–2010
Table 3a. Converted to U.S. dollars using 2010 PPPs (2010 U.S. dollars)
Country |
1960 |
1979 |
1990 |
1995 |
2000 |
2005 |
2009 |
2010 |
United States |
NA |
35.19 |
40.71 |
43.18 |
48.47 |
54.77 |
57.51 |
59.28 |
Canada |
NA |
31.45 |
35.13 |
37.52 |
41.64 |
43.91 |
44.58 |
45.14 |
Australia |
NA |
28.28 |
32.61 |
35.46 |
40.16 |
43.69 |
45.61 |
45.72 |
Japan |
NA |
17.74 |
26.89 |
29.91 |
33.06 |
36.88 |
37.47 |
38.94 |
Republic of Korea |
NA |
NA |
9.95 |
13.21 |
17.03 |
20.66 |
23.88 |
25.45 |
Singapore |
NA |
13.53 |
22.18 |
29.80 |
33.10 |
39.53 |
36.24 |
40.27 |
Austria |
NA |
NA |
NA |
40.32 |
44.07 |
46.68 |
49.19 |
50.21 |
Belgium |
NA |
34.34 |
44.60 |
50.31 |
55.75 |
57.41 |
57.74 |
58.52 |
Czech Republic |
NA |
NA |
NA |
17.92 |
19.72 |
24.53 |
27.11 |
27.72 |
Denmark |
NA |
30.52 |
38.72 |
44.41 |
46.91 |
49.88 |
48.01 |
49.84 |
Finland |
NA |
21.88 |
30.38 |
35.46 |
40.71 |
45.40 |
46.19 |
47.96 |
France |
NA |
32.07 |
43.12 |
47.48 |
52.37 |
56.04 |
56.77 |
57.73 |
Germany |
NA |
30.56 |
38.82 |
44.78 |
49.46 |
52.75 |
53.58 |
54.09 |
Ireland |
NA |
NA |
29.85 |
36.20 |
47.58 |
55.73 |
60.08 |
57.73 |
Italy |
NA |
NA |
39.40 |
43.63 |
45.60 |
45.84 |
44.74 |
45.51 |
Netherlands |
NA |
38.18 |
45.39 |
47.40 |
51.70 |
55.92 |
56.54 |
57.78 |
Norway |
NA |
40.51 |
52.75 |
62.14 |
69.56 |
78.44 |
74.54 |
74.41 |
Spain |
NA |
28.18 |
38.49 |
42.61 |
43.14 |
44.78 |
47.48 |
48.22 |
Sweden |
NA |
NA |
33.87 |
37.51 |
42.76 |
49.39 |
48.79 |
50.31 |
United Kingdom |
NA |
25.45 |
31.88 |
36.48 |
41.29 |
45.27 |
45.95 |
46.34 |
|||||||||
|
NA = Not available.
Note: Data for Germany for years before 1991 pertain to the former West Germany.
PPPs = purchasing power parities.
|
Table 3b. Average annual rates of change
Country |
1979–2010 |
1979–90 |
1990–95 |
1995–2000 |
2000–10 |
2008–09 |
2009–10 |
United States |
1.7 |
1.3 |
1.2 |
2.3 |
2.0 |
2.1 |
3.1 |
Canada |
1.2 |
1.0 |
1.3 |
2.1 |
0.8 |
0.6 |
1.3 |
Australia |
1.6 |
1.3 |
1.7 |
2.5 |
1.3 |
2.8 |
0.2 |
Japan |
2.6 |
3.9 |
2.1 |
2.0 |
1.6 |
-2.1 |
3.9 |
Republic of Korea |
NA |
NA |
5.8 |
5.2 |
4.1 |
0.8 |
6.6 |
Singapore |
3.6 |
4.6 |
6.1 |
2.1 |
2.0 |
-4.5 |
11.1 |
Austria |
NA |
NA |
NA |
1.8 |
1.3 |
-0.7 |
2.1 |
Belgium |
1.7 |
2.4 |
2.4 |
2.1 |
0.5 |
-1.3 |
1.3 |
Czech Republic |
NA |
NA |
NA |
1.9 |
3.5 |
0.6 |
2.2 |
Denmark |
1.6 |
2.2 |
2.8 |
1.1 |
0.6 |
-1.7 |
3.8 |
Finland |
2.6 |
3.0 |
3.1 |
2.8 |
1.7 |
-3.8 |
3.8 |
France |
1.9 |
2.7 |
1.9 |
2.0 |
1.0 |
-0.2 |
1.7 |
Germany |
NA |
2.2 |
NA |
2.0 |
0.9 |
-2.2 |
1.0 |
Ireland |
NA |
NA |
3.9 |
5.6 |
2.0 |
4.0 |
-3.9 |
Italy |
NA |
NA |
2.1 |
0.9 |
-0.0 |
-2.0 |
1.7 |
Netherlands |
1.3 |
1.6 |
0.9 |
1.8 |
1.1 |
-2.3 |
2.2 |
Norway |
2.0 |
2.4 |
3.3 |
2.3 |
0.7 |
0.1 |
-0.2 |
Spain |
1.7 |
2.9 |
2.1 |
0.2 |
1.1 |
2.7 |
1.6 |
Sweden |
NA |
NA |
2.1 |
2.7 |
1.6 |
-2.5 |
3.1 |
United Kingdom |
2.0 |
2.1 |
2.7 |
2.5 |
1.2 |
-2.0 |
0.9 |
|||||||||
|
NA = Not available.
Note: Data for Germany for years before 1991 pertain to the former West Germany.
Percent changes were calculated using the compound rate method.
|
Back to Top
Real GDP, by country, 1960–2010
Table 4a. Converted to U.S. dollars using 2010 PPPs (millions of 2010 U.S. dollars)
Country |
1960 |
1979 |
1990 |
1995 |
2000 |
2005 |
2009 |
2010 |
United States |
3,139,380 |
6,493,084 |
8,909,357 |
10,084,641 |
12,449,193 |
14,010,392 |
14,099,296 |
14,526,500 |
Canada |
258,139 |
616,240 |
830,800 |
904,785 |
1,107,825 |
1,256,096 |
1,292,249 |
1,333,793 |
Australia |
153,023 |
324,983 |
463,313 |
530,867 |
653,145 |
770,114 |
859,134 |
881,924 |
Japan |
558,773 |
2,202,792 |
3,563,003 |
3,820,621 |
4,007,014 |
4,274,953 |
4,135,877 |
4,299,582 |
Republic of Korea |
37,779 |
203,548 |
505,036 |
738,317 |
950,747 |
1,184,267 |
1,343,564 |
1,426,353 |
Singapore |
7,131 |
37,039 |
85,886 |
129,445 |
171,695 |
216,913 |
258,291 |
295,669 |
Austria |
79,910 |
177,548 |
223,831 |
247,925 |
287,220 |
310,811 |
328,011 |
334,991 |
Belgium |
104,722 |
223,390 |
284,335 |
307,402 |
353,878 |
382,613 |
397,222 |
405,870 |
Czech Republic |
NA |
NA |
NA |
186,058 |
200,282 |
240,637 |
267,901 |
274,113 |
Denmark |
64,278 |
127,603 |
156,131 |
175,257 |
201,749 |
214,732 |
211,390 |
215,081 |
Finland |
NA |
93,572 |
133,323 |
129,287 |
163,465 |
186,130 |
189,715 |
196,628 |
France |
515,712 |
1,267,000 |
1,629,043 |
1,731,174 |
1,979,366 |
2,143,406 |
2,183,384 |
2,215,697 |
Germany |
720,769 |
1,458,975 |
1,862,430 |
2,581,959 |
2,851,733 |
2,937,570 |
2,999,453 |
3,108,389 |
Ireland |
NA |
51,156 |
69,759 |
87,203 |
138,663 |
180,812 |
179,306 |
177,440 |
Italy |
518,053 |
1,267,310 |
1,662,750 |
1,771,169 |
1,946,051 |
2,033,832 |
1,969,709 |
1,995,233 |
Netherlands |
159,037 |
348,906 |
440,796 |
493,716 |
602,008 |
642,801 |
678,269 |
689,729 |
Norway |
53,595 |
121,795 |
163,185 |
195,950 |
234,784 |
261,989 |
272,548 |
273,494 |
Spain |
NA |
686,660 |
929,820 |
1,001,999 |
1,225,294 |
1,438,844 |
1,505,288 |
1,503,121 |
Sweden |
103,345 |
194,160 |
245,371 |
254,073 |
301,992 |
344,740 |
349,566 |
369,561 |
United Kingdom |
712,794 |
1,167,144 |
1,499,824 |
1,627,017 |
1,926,510 |
2,179,409 |
2,186,752 |
2,216,359 |
|||||||||
|
NA = Not available.
Note: Data for Germany for years before 1991 pertain to the former West Germany.
PPPs = purchasing power parities.
|
Table 4b. Average annual rates of change
Country |
1979–2010 |
1979–90 |
1990–95 |
1995–2000 |
2000–10 |
2008–09 |
2009–10 |
United States |
2.6 |
2.9 |
2.5 |
4.3 |
1.6 |
-3.5 |
3.0 |
Canada |
2.5 |
2.8 |
1.7 |
4.1 |
1.9 |
-2.8 |
3.2 |
Australia |
3.3 |
3.3 |
2.8 |
4.2 |
3.0 |
1.3 |
2.7 |
Japan |
2.2 |
4.5 |
1.4 |
1.0 |
0.7 |
-6.3 |
4.0 |
Republic of Korea |
6.5 |
8.6 |
7.9 |
5.2 |
4.1 |
0.3 |
6.2 |
Singapore |
6.9 |
7.9 |
8.6 |
5.8 |
5.6 |
-0.8 |
14.5 |
Austria |
2.1 |
2.1 |
2.1 |
3.0 |
1.6 |
-3.9 |
2.1 |
Belgium |
1.9 |
2.2 |
1.6 |
2.9 |
1.4 |
-2.8 |
2.2 |
Czech Republic |
NA |
NA |
NA |
1.5 |
3.2 |
-4.1 |
2.3 |
Denmark |
1.7 |
1.9 |
2.3 |
2.9 |
0.6 |
-5.2 |
1.7 |
Finland |
2.4 |
3.3 |
-0.6 |
4.8 |
1.9 |
-8.2 |
3.6 |
France |
1.8 |
2.3 |
1.2 |
2.7 |
1.1 |
-2.7 |
1.5 |
Germany |
NA |
2.2 |
NA |
2.0 |
0.9 |
-4.7 |
3.6 |
Ireland |
4.1 |
2.9 |
4.6 |
9.7 |
2.5 |
-7.6 |
-1.0 |
Italy |
1.5 |
2.5 |
1.3 |
1.9 |
0.2 |
-5.2 |
1.3 |
Netherlands |
2.2 |
2.1 |
2.3 |
4.0 |
1.4 |
-3.5 |
1.7 |
Norway |
2.6 |
2.7 |
3.7 |
3.7 |
1.5 |
-1.7 |
0.3 |
Spain |
2.6 |
2.8 |
1.5 |
4.1 |
2.1 |
-3.7 |
-0.1 |
Sweden |
2.1 |
2.2 |
0.7 |
3.5 |
2.0 |
-5.3 |
5.7 |
United Kingdom |
2.1 |
2.3 |
1.6 |
3.4 |
1.4 |
-4.9 |
1.4 |
|||||||||
|
NA = Not available.
Note: Data for Germany for years before 1991 pertain to the former West Germany.
Percent changes were calculated using the compound rate method.
|
Back to Top
Population, by country, 1960–2010
Table 5a. Millions of persons
Country |
1960 |
1979 |
1990 |
1995 |
2000 |
2005 |
2009 |
2010 |
United States |
180.76 |
225.11 |
250.18 |
266.59 |
282.42 |
296.23 |
307.48 |
310.11 |
Canada |
17.88 |
24.17 |
27.66 |
29.26 |
30.64 |
32.25 |
33.72 |
34.11 |
Australia |
10.28 |
14.52 |
17.07 |
18.07 |
19.15 |
20.39 |
21.95 |
22.33 |
Japan |
94.10 |
115.91 |
123.51 |
125.49 |
126.86 |
127.77 |
127.56 |
127.92 |
Republic of Korea |
25.01 |
37.53 |
42.87 |
45.09 |
47.01 |
48.14 |
48.75 |
48.87 |
Singapore |
1.65 |
2.38 |
3.05 |
3.52 |
4.03 |
4.27 |
4.99 |
5.08 |
Austria |
7.05 |
7.55 |
7.68 |
7.95 |
8.01 |
8.23 |
8.36 |
8.39 |
Belgium |
9.15 |
9.85 |
9.97 |
10.14 |
10.25 |
10.48 |
10.80 |
10.85 |
Czech Republic |
NA |
NA |
NA |
10.33 |
10.27 |
10.23 |
10.49 |
10.52 |
Denmark |
4.56 |
5.12 |
5.14 |
5.23 |
5.34 |
5.42 |
5.52 |
5.55 |
Finland |
4.43 |
4.76 |
4.99 |
5.11 |
5.18 |
5.25 |
5.34 |
5.36 |
France |
46.62 |
54.83 |
58.17 |
59.42 |
60.72 |
62.96 |
64.50 |
64.85 |
Germany |
55.43 |
61.36 |
63.25 |
81.66 |
82.19 |
82.46 |
81.88 |
81.76 |
Ireland |
2.83 |
3.38 |
3.51 |
3.61 |
3.80 |
4.16 |
4.46 |
4.47 |
Italy |
50.20 |
56.32 |
56.72 |
56.84 |
56.94 |
58.61 |
60.19 |
60.47 |
Netherlands |
11.48 |
14.03 |
14.95 |
15.46 |
15.92 |
16.32 |
16.53 |
16.62 |
Norway |
3.58 |
4.07 |
4.24 |
4.36 |
4.49 |
4.62 |
4.83 |
4.89 |
Spain |
30.26 |
37.29 |
38.85 |
39.39 |
40.26 |
43.40 |
45.93 |
46.07 |
Sweden |
7.49 |
8.29 |
8.56 |
8.83 |
8.87 |
9.03 |
9.30 |
9.38 |
United Kingdom |
52.37 |
56.24 |
57.24 |
58.03 |
58.89 |
60.24 |
61.79 |
62.22 |
|||||||||
|
NA = Not available.
Note: Data for Germany for years before 1991 pertain to the former West Germany.
|
Table 5b. Average annual rates of change
Country |
1979–2010 |
1979–90 |
1990–95 |
1995–2000 |
2000–10 |
2008–09 |
2009–10 |
United States |
1.0 |
1.0 |
1.3 |
1.2 |
0.9 |
0.9 |
0.9 |
Canada |
1.1 |
1.2 |
1.1 |
0.9 |
1.1 |
1.2 |
1.2 |
Australia |
1.4 |
1.5 |
1.2 |
1.2 |
1.5 |
2.1 |
1.7 |
Japan |
0.3 |
0.6 |
0.3 |
0.2 |
0.1 |
-0.1 |
0.3 |
Republic of Korea |
0.9 |
1.2 |
1.0 |
0.8 |
0.4 |
0.3 |
0.3 |
Singapore |
2.5 |
2.3 |
3.0 |
2.7 |
2.3 |
3.1 |
1.8 |
Austria |
0.3 |
0.2 |
0.7 |
0.2 |
0.5 |
0.3 |
0.3 |
Belgium |
0.3 |
0.1 |
0.3 |
0.2 |
0.6 |
0.8 |
0.5 |
Czech Republic |
NA |
NA |
NA |
-0.1 |
0.2 |
0.6 |
0.2 |
Denmark |
0.3 |
0.0 |
0.3 |
0.4 |
0.4 |
0.5 |
0.4 |
Finland |
0.4 |
0.4 |
0.5 |
0.3 |
0.4 |
0.5 |
0.5 |
France |
0.5 |
0.5 |
0.4 |
0.4 |
0.7 |
0.6 |
0.5 |
Germany |
NA |
0.3 |
NA |
0.1 |
-0.1 |
-0.3 |
-0.1 |
Ireland |
0.9 |
0.4 |
0.5 |
1.1 |
1.6 |
0.7 |
0.3 |
Italy |
0.2 |
0.1 |
0.0 |
0.0 |
0.6 |
0.6 |
0.5 |
Netherlands |
0.5 |
0.6 |
0.7 |
0.6 |
0.4 |
0.5 |
0.5 |
Norway |
0.6 |
0.4 |
0.5 |
0.6 |
0.9 |
1.3 |
1.3 |
Spain |
0.7 |
0.4 |
0.3 |
0.4 |
1.4 |
0.7 |
0.3 |
Sweden |
0.4 |
0.3 |
0.6 |
0.1 |
0.6 |
0.9 |
0.9 |
United Kingdom |
0.3 |
0.2 |
0.3 |
0.3 |
0.6 |
0.6 |
0.7 |
|||||||||
|
NA = Not available.
Note: Data for Germany for years before 1991 pertain to the former West Germany.
Percent changes were calculated using the compound rate method.
|
Back to Top
Employment, by country, 1960–2010
Table 6a. Millions of persons
Country |
1960 |
1979 |
1990 |
1995 |
2000 |
2005 |
2009 |
2010 |
United States |
68.29 |
100.91 |
120.96 |
126.52 |
138.32 |
143.37 |
141.52 |
140.72 |
Canada |
6.21 |
10.69 |
13.11 |
13.30 |
14.76 |
16.16 |
16.88 |
17.11 |
Australia |
4.16 |
6.18 |
7.93 |
8.29 |
9.04 |
10.05 |
11.01 |
11.30 |
Japan |
47.41 |
58.26 |
64.27 |
66.86 |
65.26 |
63.92 |
63.28 |
63.01 |
Republic of Korea |
NA |
13.60 |
18.09 |
20.41 |
21.16 |
22.86 |
23.51 |
23.83 |
Singapore |
NA |
1.15 |
1.60 |
1.77 |
2.12 |
2.26 |
2.97 |
3.05 |
Austria |
3.44 |
3.47 |
3.58 |
3.62 |
3.79 |
3.92 |
4.08 |
4.08 |
Belgium |
3.50 |
3.78 |
3.85 |
3.87 |
4.11 |
4.26 |
4.44 |
4.47 |
Czech Republic |
NA |
NA |
NA |
5.15 |
4.94 |
4.99 |
5.23 |
5.19 |
Denmark |
2.12 |
2.54 |
2.61 |
2.55 |
2.71 |
2.73 |
2.82 |
2.76 |
Finland |
NA |
2.29 |
2.48 |
2.05 |
2.29 |
2.39 |
2.46 |
2.43 |
France |
19.98 |
22.53 |
23.59 |
23.49 |
25.39 |
26.15 |
26.63 |
26.68 |
Germany |
26.09 |
26.97 |
30.41 |
37.60 |
39.14 |
38.84 |
40.27 |
40.49 |
Ireland |
1.07 |
1.18 |
1.18 |
1.28 |
1.70 |
1.96 |
1.93 |
1.85 |
Italy |
20.92 |
21.07 |
22.61 |
21.84 |
22.93 |
24.40 |
24.84 |
24.66 |
Netherlands |
4.23 |
4.93 |
6.36 |
6.89 |
7.87 |
8.11 |
8.60 |
8.37 |
Norway |
1.53 |
1.90 |
2.06 |
2.12 |
2.32 |
2.35 |
2.61 |
2.60 |
Spain |
NA |
13.80 |
15.02 |
14.77 |
17.18 |
20.12 |
20.08 |
19.61 |
Sweden |
3.66 |
4.23 |
4.60 |
4.13 |
4.30 |
4.35 |
4.47 |
4.52 |
United Kingdom |
23.87 |
25.20 |
26.87 |
25.82 |
27.48 |
28.77 |
28.96 |
29.04 |
|||||||||
|
NA = Not available.
Note: Data for Germany for years before 1991 pertain to the former West Germany.
|
Table 6b. Average annual rates of change
Country |
1979–2010 |
1979–90 |
1990–95 |
1995–2000 |
2000–10 |
2008–09 |
2009–10 |
United States |
1.1 |
1.7 |
0.9 |
1.8 |
0.2 |
-3.7 |
-0.6 |
Canada |
1.5 |
1.9 |
0.3 |
2.1 |
1.5 |
-1.6 |
1.4 |
Australia |
2.0 |
2.3 |
0.9 |
1.7 |
2.3 |
0.7 |
2.7 |
Japan |
0.3 |
0.9 |
0.8 |
-0.5 |
-0.3 |
-1.5 |
-0.4 |
Republic of Korea |
1.8 |
2.6 |
2.5 |
0.7 |
1.2 |
-0.3 |
1.4 |
Singapore |
3.2 |
3.1 |
2.1 |
3.7 |
3.7 |
4.6 |
2.6 |
Austria |
0.5 |
0.3 |
0.2 |
0.9 |
0.7 |
-0.9 |
0.0 |
Belgium |
0.5 |
0.2 |
0.1 |
1.2 |
0.8 |
-0.4 |
0.7 |
Czech Republic |
NA |
NA |
NA |
-0.8 |
0.5 |
-1.2 |
-0.8 |
Denmark |
0.3 |
0.2 |
-0.4 |
1.2 |
0.2 |
-2.9 |
-2.1 |
Finland |
0.2 |
0.7 |
-3.7 |
2.2 |
0.6 |
-3.5 |
-1.4 |
France |
0.5 |
0.4 |
-0.1 |
1.6 |
0.5 |
-1.2 |
0.2 |
Germany |
NA |
1.1 |
NA |
0.8 |
0.3 |
-0.0 |
0.5 |
Ireland |
1.4 |
-0.1 |
1.8 |
5.7 |
0.9 |
-8.2 |
-4.1 |
Italy |
0.5 |
0.6 |
-0.7 |
1.0 |
0.7 |
-1.7 |
-0.7 |
Netherlands |
1.7 |
2.3 |
1.6 |
2.7 |
0.6 |
0.0 |
-2.6 |
Norway |
1.0 |
0.7 |
0.6 |
1.8 |
1.1 |
-0.5 |
-0.2 |
Spain |
1.1 |
0.8 |
-0.3 |
3.1 |
1.3 |
-6.6 |
-2.4 |
Sweden |
0.2 |
0.8 |
-2.1 |
0.8 |
0.5 |
-2.0 |
1.1 |
United Kingdom |
0.5 |
0.6 |
-0.8 |
1.3 |
0.6 |
-1.6 |
0.3 |
|||||||||
|
NA = Not available.
Note: Data for Germany for years before 1991 pertain to the former West Germany.
Percent changes were calculated using the compound rate method.
|
Back to Top
Average annual hours worked per employed person, by country, 1960–2010
Table 7a. Hours
Country |
1960 |
1979 |
1990 |
1995 |
2000 |
2005 |
2009 |
2010 |
United States |
NA |
1,829 |
1,809 |
1,846 |
1,857 |
1,784 |
1,732 |
1,741 |
Canada |
NA |
1,832 |
1,805 |
1,812 |
1,803 |
1,770 |
1,717 |
1,727 |
Australia |
NA |
1,859 |
1,792 |
1,805 |
1,799 |
1,754 |
1,711 |
1,707 |
Japan |
NA |
2,132 |
2,062 |
1,911 |
1,857 |
1,814 |
1,745 |
1,752 |
Republic of Korea |
NA |
NA |
2,805 |
2,738 |
2,638 |
2,508 |
2,393 |
2,352 |
Singapore |
NA |
2,388 |
2,425 |
2,456 |
2,451 |
2,425 |
2,399 |
2,409 |
Austria |
NA |
NA |
NA |
1,699 |
1,721 |
1,699 |
1,634 |
1,634 |
Belgium |
NA |
1,721 |
1,658 |
1,580 |
1,545 |
1,565 |
1,550 |
1,552 |
Czech Republic |
NA |
NA |
NA |
2,017 |
2,056 |
1,965 |
1,891 |
1,907 |
Denmark |
NA |
1,647 |
1,546 |
1,546 |
1,585 |
1,579 |
1,559 |
1,561 |
Finland |
NA |
1,869 |
1,769 |
1,776 |
1,751 |
1,716 |
1,669 |
1,690 |
France |
NA |
1,753 |
1,602 |
1,552 |
1,489 |
1,463 |
1,444 |
1,439 |
Germany |
NA |
1,770 |
1,578 |
1,534 |
1,473 |
1,434 |
1,390 |
1,419 |
Ireland |
NA |
NA |
1,988 |
1,875 |
1,719 |
1,654 |
1,549 |
1,664 |
Italy |
NA |
NA |
1,867 |
1,859 |
1,861 |
1,819 |
1,772 |
1,778 |
Netherlands |
NA |
1,855 |
1,528 |
1,512 |
1,480 |
1,417 |
1,396 |
1,426 |
Norway |
NA |
1,580 |
1,503 |
1,488 |
1,455 |
1,420 |
1,403 |
1,414 |
Spain |
NA |
1,766 |
1,608 |
1,592 |
1,653 |
1,597 |
1,579 |
1,590 |
Sweden |
NA |
NA |
1,575 |
1,640 |
1,642 |
1,605 |
1,602 |
1,624 |
United Kingdom |
NA |
1,820 |
1,751 |
1,728 |
1,698 |
1,673 |
1,643 |
1,647 |
|||||||||
|
NA = Not available.
Note: Data for Germany for years before 1991 pertain to the former West Germany.
|
Table 7b. Average annual rates of change
Country |
1979–2010 |
1979–90 |
1990–95 |
1995–2000 |
2000–10 |
2008–09 |
2009–10 |
United States |
-0.2 |
-0.1 |
0.4 |
0.1 |
-0.6 |
-1.9 |
0.5 |
Canada |
-0.2 |
-0.1 |
0.1 |
-0.1 |
-0.4 |
-1.8 |
0.5 |
Australia |
-0.3 |
-0.3 |
0.1 |
-0.1 |
-0.5 |
-2.2 |
-0.2 |
Japan |
-0.6 |
-0.3 |
-1.5 |
-0.6 |
-0.6 |
-2.8 |
0.4 |
Republic of Korea |
NA |
NA |
-0.5 |
-0.7 |
-1.1 |
-0.2 |
-1.7 |
Singapore |
0.0 |
0.1 |
0.3 |
-0.0 |
-0.2 |
-0.6 |
0.4 |
Austria |
NA |
NA |
NA |
0.3 |
-0.5 |
-2.3 |
0.0 |
Belgium |
-0.3 |
-0.3 |
-1.0 |
-0.4 |
0.0 |
-1.1 |
0.1 |
Czech Republic |
NA |
NA |
NA |
0.4 |
-0.7 |
-3.6 |
0.9 |
Denmark |
-0.2 |
-0.6 |
0.0 |
0.5 |
-0.2 |
-0.7 |
0.1 |
Finland |
-0.3 |
-0.5 |
0.1 |
-0.3 |
-0.4 |
-1.1 |
1.2 |
France |
-0.6 |
-0.8 |
-0.6 |
-0.8 |
-0.3 |
-1.4 |
-0.4 |
Germany |
NA |
-1.0 |
NA |
-0.8 |
-0.4 |
-2.5 |
2.1 |
Ireland |
NA |
NA |
-1.2 |
-1.7 |
-0.3 |
-3.2 |
7.4 |
Italy |
NA |
NA |
-0.1 |
0.0 |
-0.5 |
-1.7 |
0.3 |
Netherlands |
-0.8 |
-1.7 |
-0.2 |
-0.4 |
-0.4 |
-1.3 |
2.2 |
Norway |
-0.4 |
-0.5 |
-0.2 |
-0.4 |
-0.3 |
-1.4 |
0.8 |
Spain |
-0.3 |
-0.8 |
-0.2 |
0.8 |
-0.4 |
0.3 |
0.7 |
Sweden |
NA |
NA |
0.8 |
0.0 |
-0.1 |
-0.9 |
1.4 |
United Kingdom |
-0.3 |
-0.4 |
-0.3 |
-0.3 |
-0.3 |
-1.3 |
0.2 |
|||||||||
|
NA = Not available.
Note: Data for Germany for years before 1991 pertain to the former West Germany.
Percent changes were calculated using the compound rate method.
|
Back to Top
Employment as percentage of population, by country, 1960–2010
Table 8.
Country |
1960 |
1979 |
1990 |
1995 |
2000 |
2005 |
2009 |
2010 |
United States |
37.78 |
44.83 |
48.35 |
47.46 |
48.98 |
48.40 |
46.03 |
45.38 |
Canada |
34.72 |
44.25 |
47.39 |
45.47 |
48.16 |
50.11 |
50.07 |
50.17 |
Australia |
40.45 |
42.58 |
46.45 |
45.89 |
47.20 |
49.27 |
50.14 |
50.61 |
Japan |
50.38 |
50.26 |
52.04 |
53.28 |
51.44 |
50.02 |
49.61 |
49.26 |
Republic of Korea |
NA |
36.24 |
42.19 |
45.27 |
45.00 |
47.48 |
48.22 |
48.76 |
Singapore |
NA |
48.09 |
52.42 |
50.18 |
52.55 |
53.06 |
59.57 |
60.04 |
Austria |
48.81 |
46.03 |
46.58 |
45.53 |
47.29 |
47.65 |
48.79 |
48.65 |
Belgium |
38.19 |
38.38 |
38.58 |
38.15 |
40.08 |
40.64 |
41.11 |
41.18 |
Czech Republic |
NA |
NA |
NA |
49.83 |
48.09 |
48.77 |
49.81 |
49.30 |
Denmark |
46.56 |
49.60 |
50.75 |
48.81 |
50.81 |
50.33 |
51.14 |
49.83 |
Finland |
NA |
48.02 |
49.75 |
40.19 |
44.31 |
45.54 |
46.09 |
45.23 |
France |
42.86 |
41.09 |
40.55 |
39.54 |
41.81 |
41.53 |
41.30 |
41.14 |
Germany |
47.07 |
43.95 |
48.07 |
46.05 |
47.63 |
47.09 |
49.19 |
49.53 |
Ireland |
37.81 |
35.03 |
33.48 |
35.61 |
44.57 |
47.17 |
43.18 |
41.29 |
Italy |
41.68 |
37.41 |
39.86 |
38.42 |
40.27 |
41.63 |
41.27 |
40.78 |
Netherlands |
36.80 |
35.11 |
42.52 |
44.55 |
49.43 |
49.71 |
52.00 |
50.38 |
Norway |
42.71 |
46.72 |
48.54 |
48.63 |
51.65 |
50.87 |
53.97 |
53.17 |
Spain |
NA |
37.00 |
38.66 |
37.50 |
42.67 |
46.35 |
43.71 |
42.55 |
Sweden |
48.83 |
51.04 |
53.74 |
46.78 |
48.47 |
48.16 |
48.11 |
48.25 |
United Kingdom |
45.58 |
44.80 |
46.95 |
44.49 |
46.67 |
47.76 |
46.87 |
46.66 |
|||||||||
|
NA = Not available.
Note: Data for Germany for years before 1991 pertain to the former West Germany.
|
Back to Top
Purchasing power parities (PPPs), exchange rates, and relative prices, by country, 2010
Table 9.
Country |
PPPs for GDP (U.S.=1.00) |
Exchange rates |
Relative Prices 1 |
United States |
1.00 |
1.00 |
1.00 |
Canada |
1.22 |
1.03 |
1.18 |
Australia |
1.52 |
1.09 |
1.40 |
Japan |
111.45 |
87.78 |
1.27 |
Republic of Korea |
822.24 |
1155.74 |
0.71 |
Singapore |
1.03 |
1.36 |
0.75 |
Austria |
0.85 |
0.75 |
1.13 |
Belgium |
0.87 |
0.75 |
1.15 |
Czech Republic |
13.39 |
19.11 |
0.70 |
Denmark |
8.10 |
5.63 |
1.44 |
Finland |
0.92 |
0.75 |
1.22 |
France |
0.87 |
0.75 |
1.16 |
Germany |
0.80 |
0.75 |
1.07 |
Ireland |
0.88 |
0.75 |
1.17 |
Italy |
0.78 |
0.75 |
1.03 |
Netherlands |
0.85 |
0.75 |
1.13 |
Norway |
9.13 |
6.05 |
1.51 |
Spain |
0.71 |
0.75 |
0.94 |
Sweden |
8.95 |
7.21 |
1.24 |
United Kingdom |
0.66 |
0.65 |
1.01 |
|||||||||
Back to Top
Technical Notes
This report updates the international comparisons report on GDP per capita and related measures produced annually by the Bureau of Labor Statistics (BLS). The estimates shown in this report are based on data available as of August 2010. Data are available for all countries through 2010.
These technical notes provide definitions, sources, and methods for the basic time series and indicators included in this report.
Gross domestic product
Gross domestic product (GDP) is the market value of goods and services produced by labor and capital in a country, regardless of nationality (see table 4). As such, it is the most comprehensive measure of a country's economic output that is generally estimated by statistical agencies.
The GDP measures in this report were obtained from the national accounts programs of their respective national statistical agencies. For all countries in this comparison, data for more recent years have been produced using chain linked real output measures as recommended in the 1993 United Nations System of National Accounts (SNA93). For several countries, however, older data were produced on a 1968 United Nations System of National Accounts (SNA68). Data produced on an SNA68 basis used fixed base-year deflators that were typically updated only every 5 years. In order to construct one continuous GDP series, BLS links several time series, each of which has its own set of base-year price weights.
The U.S. GDP series are produced by the Bureau of Economic Analysis (BEA) and are based on the system of national income and product accounts (NIPAs), which are also prepared in accordance with SNA93.
GDP per capita
GDP per capita is calculated as GDP divided by population and is a rough measure of a population's economic well being. (See table 1.) However, this measure may have the following limitations: The total production of a country consists of many things that are not included in its GDP, and some items included may not contribute to a country's well-being. In addition, some countries experience significant in- and out-flows of income because of foreign investment, which may affect a country's prosperity.
GDP per hour worked and GDP per employed person
GDP per hour worked is one measure of labor productivity. (See table 3.) Although it relates output to labor hours involved in its production by all persons in a country, it does not measure the specific contribution of labor or any other factor of production. Rather, it reflects the joint effects of many influences, including changes in technology; capital investment; utilization of capacity, energy, and materials; the use of purchased services inputs, including contract employment services; the organization of production; and managerial skill; in addition to the characteristics and effort of the workforce.
In addition to GDP per hour worked, this report also provides GDP per employed person. (See table 2.) GDP per employed person is a less precise measure of labor productivity in that it does not take into account the often substantial differences in working hours among countries; however, data on GDP per employed person are available for longer time periods and are thus useful as a rough indicator of labor productivity for years in which GDP per hour data are not available.
Comparative levels of time series with real output using purchasing power parities (PPPs)
In order to make international comparisons of levels of GDP, GDP per capita, GDP per hour worked, and GDP per employed person, it is necessary to express output in a common currency unit. In this report, BLS converted the output measures from national currency units to U.S. dollars through the use of purchasing power parities (PPPs). PPPs are currency conversion rates that allow output in different currency units to be expressed in a common unit of value - in this case, U.S. dollars.
There are two primary reasons for using PPPs rather than market exchange rates to convert GDP into a common currency. First, PPPs reflect the relative purchasing powers of different currencies. By contrast, market exchange rates represent at best relative prices of goods and services that are traded internationally, not the relative value of total domestic output, which also consists of goods, and particularly services, that are not traded internationally. Second, PPPs are more stable than market exchange rates, which can vary frequently and abruptly. Often these changes in market exchange rates are due to currency speculation or interest rates changes. Thus if GDP is converted into a common currency using exchange rates, the output of a country's economy could appear to vary for reasons that are unrelated to the country's economic activity.
The levels of GDP in this report were derived as follows. First, real GDP series from each country was expressed in constant prices of the national currency in 2010. Next, each country's constant GDP series was divided by the country's PPP for 2010 as calculated by the OECD-Eurostat PPP Program1 or the International Monetary Fund (IMF)2, thereby converting the series into constant 2010 U.S. dollars. Finally, the time series of GDP per capita, per employed person, and per hour were estimated by dividing each country's GDP in 2010 dollars by its population, employment, and hours, respectively.
PPPs are an effective tool for international comparisons of output levels, but they should be used and interpreted with caution, as the accuracy of PPPs may be limited by several factors; for example, goods and services included in the calculation of PPPs may not be representative of the entire economy or comparable across countries, countries may use different price aggregation methods, and the statistical capabilities among countries may differ. Although comparative estimates like GDP per capita are useful for grouping countries, changes in country rankings can occur as a result of relatively minor adjustments to PPP estimates. Thus, small differences between countries are not, in general, economically significant, and a strict ranking order interpretation should be avoided.
Currency exchange rates and relative prices
The currency exchange rate is the rate at which one currency may be converted into the currency of another country for commercial purposes, such as international trade. The market exchange rates in this report are based on reports by the U.S. Federal Reserve Board. (See table 9.)
The relationship between PPPs and market exchange rates can be used to estimate comparative prices in different countries. This report calculates relative prices in 2010 by dividing a country's PPP by its market exchange rate. (See table 9.) The resulting values indicate the domestic price, expressed in U.S. dollars, of a basket of goods that would cost exactly one dollar in the United States. Consequently, values less than 1.00 indicate that prices in that country are relatively low compared with the United States. Values greater than 1.00 indicate that prices in a particular country are relatively high compared with the United States.
Population and employment
The population data in this report represent the total average resident population, which refers to the civilian population and the armed forces residing within a country. (See table 5.) The data are derived from national statistical agencies and international organizations.
The employment data in this report represent the number of persons employed, which consists of the sum of civilian employment and armed forces. (See table 6.) Most of the data are obtained from the countries' national accounts, where the data series have been developed from various surveys and other sources, including labor force (household) and establishment surveys. In some cases, the data have been supplemented with data obtained from other series published by national statistical or international organizations.
The employment-population ratio measures the participation of the population in the production process. (See table 8.) In this report, the population and employment figures include the Armed Forces. This inclusion is a conceptual difference to the population and employment figures published in the BLS report International comparisons of annual labor force statistics, 10 countries3, which exclude the Armed Forces.
Hours worked
The hours worked data in this report represent hours actually worked, including regular work time, overtime, preparing the work place, waiting for supplies, and short rests. Hours worked exclude vacation, sick leave, lunch breaks, and commuting to and from work.
Hours worked may not be fully comparable across countries because national statistical offices may use different concepts, data sources, and estimation techniques to calculate total hours worked; for example, the employment series may refer to the number of persons or the number of jobs, hours worked may be estimated from hours paid, and different establishment and household surveys may be used to cover all employees, self-employed, and Armed Forces. These differences may affect the comparability of hours worked data among different countries4.
For most countries, the hours data used in this report are obtained from the countries' national accounts, where the data series have been developed from various surveys and other sources. For some countries, the data are based on other series published by national statistical or international organizations.
Data limitations
BLS prepares the data in this report with the utmost attention to comparability across countries. However, there are several issues that limit the comparability, including the following:
• Different national methodologies: The measures in this report were calculated from data that were obtained from national statistical agencies and international organizations. While these data are generally comparable, some differences remain in the statistical methodologies used by these organizations.
• Missing data for recent years: In some cases, when data for the most recent year(s) are not available, BLS may estimate the missing data using alternative data series.
• Different historical methodologies: National statistical agencies change their methodology periodically. As a result, continuous time series from 1960 forward are generally not available. In order to construct longer time series, BLS often links several shorter series that may have used different methodologies.
1. OECD and Eurostat, Purchasing Power Parities and Real Expenditures. 2005 Benchmark Year, 2007 Edition.
2. International Monetary Fund, World Economic Outlook Database, October 2010.
3. This report is available on the Internet at http://www.bls.gov/fls/flscomparelf.htm.
4. Some of these differences are addressed by Susan Fleck in "International comparisons of hours worked: an assessment of the statistics," Monthly Labor Review, May 2009, pp. 3-31.
Back to Top
Last Modified Date: August 15, 2011
|