Printer-friendly version
Assaults and Violent Acts in the Private Retail Trade Sector, 2003—2008
by Joyce Northwood
Bureau of Labor Statistics
Originally Posted: December 7, 2011
From 2003 to 2008, there were 944 homicides and 8,700 nonfatal assaults by persons in the retail trade sector. During this period, homicides were the leading cause of work-related deaths in the sector. Nearly two-thirds of these homicides occurred in two types of retail establishments: food and beverage stores and gasoline stations. The majority of the victims in these cases were foreign born, and 77 percent of the assailants were robbers. This article examines safety and health statistics in the retail trade sector—covering both fatal and nonfatal workplace injuries—and focuses particularly on injuries resulting from violent acts.
The retail trade sector is a relatively safe industry in which to work, accounting for only 6 percent of total fatal occupational injuries and 14 percent of nonfatal injuries and illnesses in 2008. However, certain characteristics of the industry—such as direct contact with the public and the exchange of money—make these workers vulnerable to injury from criminal activity. In 2008, there were 117 homicides and 980 nonfatal assaults in the private retail trade sector.
This article examines some of the characteristics of the retail trade sector1 of the U.S. economy. It uses data from the BLS Injuries, Illnesses, and Fatalities program—both the Census of Fatal Occupational Injuries (CFOI) and the Survey of Occupational Injuries and Illnesses (SOII)—to analyze the sector’s safety and health record, in terms of fatal and nonfatal workplace injuries. The article focuses particularly on injuries resulting from violent acts.
The industry at a glance
The retail trade sector comprises establishments engaged in purchasing items from suppliers or wholesalers and reselling them to the public for a profit. In 2008, retail sales in the United States were almost $4.4 trillion,2 accounting for approximately 6 percent of domestic value added in the economy.3 There were over 16.5 million people employed in retail trade, or 11 percent of the workforce.4 In 2007, there were over 1.1 million retail establishments,5 and 84 percent of these were small businesses with fewer than 20 employees.6 These smallest establishments employed approximately 33 percent of all workers in the sector.
Retail workers face several risk factors associated with their jobs, including contact with the public, the exchange of money, delivery of goods and services, working alone or in small numbers, and working late at night or during the early morning hours.7 Most retail salespersons and cashiers work at cash registers and take payments from customers. Those retail employees who work for the smallest establishments are the most likely to work alone or with a few coworkers. In 2005, over three-fifths of all establishments with 10 or fewer workers in the retail trade sector reported that their employees worked in small numbers.8
Five percent of all retail establishments reported an incident of criminal violence in 2005, compared with 2 percent for all industries combined.9 In 2008, almost 36,000 robberies occurred at gasoline stations and convenience stores alone.10 In addition, organized crime is a growing problem for retailers, with 85 percent of all retailers reporting having been victimized in 2008.11 These crimes involve large quantities of goods being stolen from retail establishments and resold through flea markets, pawn shops, Internet sites, and swap meets.
Fatal occupational injuries
Fatal injuries: counts and rates. During the years 2003 through 2008, there was a combined total of 2,129 fatal work injuries in the private retail trade industry. The year with the highest number was 2005, with 400 fatal injuries, and the year with the lowest was 2008, with 301. Although the sector accounted for 12 percent of all U.S. employment during that period, it accounted for only 6 percent of all fatal injuries. This industry has a low rate of fatal occupational injury compared with many other industries.12 For all private industries in 2008, the rate was 3.7 per 100,000 full time equivalent workers. As can be seen in table 1, the overall rate for service-providing industries is less than half the rate for goods-producing industries (2.8 versus 7.6). For the private retail trade industry, the fatal injury rate (2.0) is lower than the rate for all service industries combined (2.8). However, for several types of stores within the retail sector, the rate is much higher. For example, gasoline stations have a fatal injury rate that is almost 4 times greater (7.7).
Table 1. Fatal occupational injury rates, selected industries, 2006—2008
| Industry |
2006 |
2007 |
2008 |
Total |
4.2 |
4.0 |
3.7 |
Private industry |
4.5 |
4.3 |
4.0 |
Goods producing |
8.2 |
7.7 |
7.6 |
Service providing |
3.2 |
3.1 |
2.8 |
Retail trade |
2.4 |
2.4 |
2.0 |
Automobile dealers |
2.8 |
1.9 |
2.2 |
Auto parts, accessories, and tire stores |
3.7 |
5.5 |
4.1 |
Grocery stores |
2.6 |
3.3 |
2.1 |
Gasoline stations |
10.4 |
9.2 |
7.7 |
|
NOTE: Data for all years are revised and final.
SOURCE: U.S. Bureau of Labor Statistics, Census of Fatal Occupational Injuries
|
Fatal injuries by event. As shown in table 2, for the years 2003 to 2008 combined, more than half (51 percent) of all fatal occupational injuries in retail trade were the result of assaults and violent acts, and most of those (87 percent) were homicides. More than a third of all fatal injuries in retail resulted from a shooting. The next most frequent types of fatal events were transportation incidents (28 percent), falls (9 percent), and contact with objects and equipment (7 percent).
Table 2. Fatal occupational injuries by event for private retail trade and all other industries, 2003—2008
| Event |
Retail trade |
All other industries |
| 2003—2008 |
Percent |
2003—2008 |
Percent |
All events |
2,129 |
100.0 |
28,459 |
100.0 |
Assaults and violent acts |
1,087 |
51.1 |
3,196 |
11.2 |
Transportation incidents |
588 |
27.6 |
11,975 |
42.1 |
Falls |
187 |
8.8 |
4,254 |
14.9 |
Contact with objects and equipment |
149 |
7.0 |
5,413 |
19.0 |
Exposure to harmful substances or environments |
70 |
3.3 |
2,665 |
9.4 |
Fires and explosions |
39 |
1.8 |
880 |
3.1 |
Other events or exposures |
9 |
|
76 |
|
| Addendum: assaults and violent acts |
Homicides |
944 |
44.3 |
2,043 |
7.2 |
Shooting |
779 |
36.6 |
1,541 |
5.4 |
Stabbing |
78 |
3.7 |
211 |
0.7 |
Hitting, kicking, beating |
55 |
2.6 |
159 |
0.6 |
All other |
32 |
1.5 |
132 |
|
Suicide, self-inflicted injury |
142 |
6.7 |
922 |
3.2 |
|
NOTE: Data for all years are revised and final. As a result of rounding, components may not add to exactly 100 percent.
SOURCE: U.S. Bureau of Labor Statistics, Census of Fatal Occupational Injuries
|
In contrast, for all other industries in the private sector, transportation accidents were the most frequent fatal injury event, accounting for 42 percent of the total. In addition, assaults and violent acts represented only 11 percent of the fatal injuries, with homicides accounting for 7 percent.13
Homicides by occupation. First-line supervisors and managers of sales workers accounted for 45 percent of fatalities in retail trade. Of the 421 managers killed by homicide, the majority (318) were self-employed. Cashiers accounted for 28 percent of homicides, followed by retail salespeople (11 percent), and transportation and material moving occupations (5 percent). For sales and related occupations, homicides were the leading cause of death on the job. For retail cashiers, homicides represent 91 percent of work-related fatal injuries; for first-line supervisors, the comparable figure is 65 percent, and for retail salespeople, 45 percent. (See table 3.)
Table 3. Fatal occupational injuries in private retail trade, by occupation, 2003—2008
| Occupation |
Homicide |
All other events |
Percent homicides |
| Number |
Share |
Number |
Share |
All occupations |
944 |
100.0 |
1,185 |
100.0 |
44.3 |
Sales and related occupations |
810 |
85.8 |
447 |
37.7 |
64.4 |
First-line supervisors/managers, sales workers |
421 |
44.6 |
231 |
19.5 |
64.6 |
Cashiers |
264 |
28.0 |
25 |
2.1 |
91.3 |
Retail salespersons |
105 |
11.1 |
127 |
10.7 |
45.3 |
Transportation and material moving occupations |
49 |
5.2 |
383 |
32.3 |
11.3 |
Office and administrative support occupations |
31 |
3.3 |
63 |
5.3 |
33.0 |
Installation, maintenance and repair occupations |
8 |
0.8 |
131 |
11.1 |
5.8 |
All other occupations |
46 |
4.9 |
161 |
13.6 |
22.2 |
| Addendum: |
| First-line supervisors/managers, sales workers |
Self-employed |
318 |
33.7 |
123 |
10.4 |
72.1 |
|
NOTE: Data for all years are revised and final.
SOURCE: U.S. Bureau of Labor Statistics, Census of Fatal Occupational Injuries
|
Homicides by demographic group. A disproportionate share of fatal injuries occurred in the retail sector among several demographic groups: the self-employed, women, and the foreign born. Approximately 5 percent of retail workers were self-employed in 2008,14 but self-employed workers made up 27 percent of all fatally injured workers in the sector and almost two-fifths of all retail homicides during the 2003—2008 period. Homicide is the leading cause of job-related deaths for self-employed retail trade workers. (See table 4.)
Table 4. Fatal occupational injuries in private retail trade, by selected demographics, 2003—2008
| Characteristic |
All events |
Homicide |
Percent homicides |
| Number |
Share |
Number |
Share |
All workers |
2,129 |
100.0 |
944 |
100.0 |
44.3 |
| Employee status |
Wage and salary workers |
1,561 |
73.3 |
577 |
61.1 |
37.0 |
Self-employed |
568 |
26.7 |
367 |
38.9 |
64.6 |
| Sex |
Men |
1,849 |
86.8 |
779 |
82.5 |
42.1 |
Women |
280 |
13.2 |
165 |
17.5 |
58.9 |
| Native origin |
Native born |
1,523 |
71.5 |
482 |
51.1 |
31.6 |
Foreign born |
606 |
28.5 |
462 |
48.9 |
76.2 |
|
NOTE: Data for all years are revised and final.
SOURCE: U.S. Bureau of Labor Statistics, Census of Fatal Occupational Injuries
|
Women were almost half of the retail labor force, but they accounted for a much smaller percent of those killed on the job (13 percent). However, this is almost double the share for all industries combined, in which women accounted for only 7 percent of total fatal injuries during the 2003—2008 period. Fifty-nine percent of all female retail workers killed on the job died as a result of a homicide.
Foreign-born workers accounted for almost 30 percent of the workplace fatalities in retail, compared with 17 percent for all industries. Foreign-born workers in retail accounted for almost half (462) of all workplace homicides (944), and over three-fourths of all foreign-born workers that were killed on the job died as a result of homicide.
Among the foreign born, those from India represented the largest proportion (15 percent) of workers who were killed on the job in the retail sector. Within this group, 9 in 10 work-related deaths were a result of homicide. In contrast, Mexican retail workers were the second largest group of foreign-born workers killed on the job, but less than half were killed as a result of homicide. (See table 5.)
Table 5. Fatalities among foreign-born workers in private retail trade, by place of birth, 2003—2008
| Place of birth |
All events |
Homicide |
Percent homicides |
| Number |
Share |
Number |
Share |
All countries |
606 |
100.0 |
462 |
100.0 |
76.2 |
India |
93 |
15.3 |
84 |
18.2 |
90.3 |
Mexico |
74 |
12.2 |
36 |
7.8 |
48.6 |
Korea |
42 |
6.9 |
34 |
7.4 |
81.0 |
Pakistan |
41 |
6.8 |
39 |
8.4 |
95.1 |
Vietnam |
25 |
4.1 |
21 |
4.5 |
84.0 |
Yemen |
25 |
4.1 |
24 |
5.2 |
96.0 |
Dominican Republic |
19 |
3.1 |
16 |
3.5 |
84.2 |
Bangladesh |
18 |
3.0 |
17 |
3.7 |
94.4 |
Israel |
16 |
2.6 |
15 |
3.2 |
93.8 |
Jordan |
15 |
2.5 |
14 |
3.0 |
93.3 |
All other countries |
238 |
39.3 |
162 |
35.1 |
68.1 |
|
NOTE: Data for all years are revised and final.
SOURCE: U.S. Bureau of Labor Statistics, Census of Fatal Occupational Injuries
|
Homicides by type of retail establishment. As previously mentioned, several risk factors are associated with occupational violence in retail trade, including exchanging money with the public, working during the evening hours, and working alone or in small numbers. Not surprisingly, a substantial share of all homicides in the sector during the 2003—2008 period occurred in two types of retail establishments, where these risk factors may be higher: food and beverage stores (41 percent) and gasoline stations (22 percent). These two types of stores accounted for nearly two-thirds of all homicides in the retail sector, or 599 workers. And while these two store types employed less than 3 percent of the U.S. workforce in 2008,15 they accounted for 17 percent of all occupational homicides that occurred from 2003 to 2008. (See table 6.)
Table 6. Fatal occupational injuries in private retail trade, by event, 2003—2008
| Industry |
Homicide |
All other events |
Percent homicides |
| Number |
Share |
Number |
Share |
All retail sales |
944 |
100.0 |
1,185 |
100.0 |
44.3 |
Food and beverage stores |
391 |
41.4 |
126 |
10.6 |
75.6 |
Motor vehicle and parts dealers |
79 |
8.4 |
330 |
27.8 |
19.3 |
Gasoline stations |
208 |
22.0 |
70 |
5.9 |
74.8 |
Building material and garden equipment and supplies dealers |
21 |
2.2 |
212 |
17.9 |
9.0 |
Miscellaneous stores |
43 |
4.6 |
89 |
7.5 |
32.6 |
General merchandise stores |
46 |
4.9 |
78 |
6.6 |
37.1 |
Nonstore retailers |
13 |
1.4 |
111 |
9.4 |
10.5 |
Clothing and clothing accessories stores |
64 |
6.8 |
24 |
2.0 |
72.7 |
Furniture and home furnishings stores |
14 |
1.5 |
46 |
3.9 |
23.3 |
Sporting goods, hobby, book, and music stores |
28 |
3.0 |
28 |
2.4 |
50.0 |
Health and personal care stores |
19 |
2.0 |
34 |
2.9 |
35.8 |
Electronics and appliance stores |
15 |
1.6 |
27 |
2.3 |
35.7 |
All other |
3 |
|
10 |
0.8 |
23.1 |
| Addendum: |
| Food and beverage stores |
|
|
|
|
|
Grocery stores |
322 |
34.1 |
92 |
7.8 |
77.8 |
Convenience stores |
212 |
22.5 |
13 |
1.1 |
94.2 |
Supermarkets and other grocery (exc. convenience) stores |
94 |
10.0 |
77 |
6.5 |
55.0 |
Beer, wine, and liquor stores |
43 |
4.6 |
9 |
0.8 |
82.7 |
|
NOTE: Data for all years are revised and final.
SOURCE: U.S. Bureau of Labor Statistics, Census of Fatal Occupational Injuries
|
Grocery stores, which are part of the food and beverage stores subsector, accounted for 34 percent of all homicides in retail trade, with 22 percent occurring in convenience stores. Ninety-four percent of convenience store employees who were killed on the job died as a result of a homicide. Homicides also accounted for more than four-fifths of fatal occupational injuries in beer, wine and liquor stores, and three-fourths of all cases that occurred at gasoline stations.
The majority of foreign-born victims of homicide in retail trade (80 percent) worked in either food and beverage stores or gasoline stations. Of the 391 homicides in food and beverage stores, two-thirds were foreign born. Among the 208 homicides in gasoline stations, more than half were foreign born. (See table 7.)
Table 7. Homicides of native- and foreign-born retail workers, by type of store, 2003—2008
|
All workers |
Foreign born |
Native born |
| Number |
Share |
Number |
Share |
Number |
Share |
All retail |
944 |
100.0 |
462 |
100.0 |
482 |
100.0 |
Food and beverage stores |
391 |
41.4 |
259 |
56.1 |
132 |
27.4 |
Gasoline stations |
208 |
22.0 |
109 |
23.6 |
99 |
20.5 |
All other retail |
345 |
36.5 |
94 |
20.3 |
251 |
52.1 |
|
NOTE: Data for all years are revised and final.
SOURCE: U.S. Bureau of Labor Statistics, Census of Fatal Occupational Injuries
|
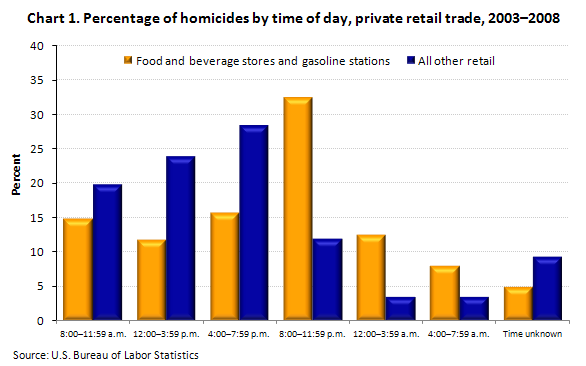
As noted previously, food and beverage stores and gasoline stations have greater risk factors than other types of retail establishments because their employees are more likely to work late at night or in the early morning. More than half (53 percent), of the homicides in food and beverage stores and in gasoline stations over the 2003—2008 period occurred between the hours of 8:00 p.m. and 8:00 a.m. For all other types of retail establishments, only 19 percent occurred during those hours, and more than half occurred between noon and 8:00 p.m. (See chart 1.)
People who work in food and beverage stores and in gasoline stations were more likely than other victims of occupational homicide to be killed by a robber. For all private industries combined, 43 percent of homicides involved robberies. The share is larger in the private retail trade sector, where more than two-thirds of the homicides resulted from robberies. In food and beverage stores and gasoline stations, 77 percent of the workplace homicides occurred during a robbery. (See table 8.)
Table 8. Homicides in private retail trade, by type of assailant, 2003—2008
| Type of assailant |
All industries |
All retail trade |
Food and beverage stores and gasoline stations |
| Number |
Share |
Number |
Share |
Number |
Share |
All |
2,987 |
100.0 |
944 |
100.0 |
599 |
100.0 |
Robbers |
1,293 |
43.3 |
642 |
68.0 |
461 |
77.0 |
Coworker, former coworker |
348 |
11.7 |
44 |
4.7 |
16 |
2.7 |
All other |
1,346 |
45.1 |
258 |
27.3 |
122 |
20.4 |
|
NOTE: Data for all years are revised and final.
SOURCE: U.S. Bureau of Labor Statistics, Census of Fatal Occupational Injuries
|
Nonfatal occupational injuries
Nonfatal injuries: counts and rates. During the 2003—2008 period, there was an annual average of 593,100 total recordable nonfatal workplace illnesses and injuries in the private retail trade sector, with approximately 169,000 injuries and illnesses resulting in days away from work.16
The rate of nonfatal occupational injuries and illnesses requiring days away from work is slightly higher in retail trade than in all industries combined.17 For all private industries in 2008, the rate was 113.3 per 10,000 full-time workers, compared with 120.0 for retail trade. The rate for all service-providing industries (105.1) was lower than the rate for goods-producing industries (140.0). Still, the rate is quite high for certain types of stores within the retail sector, such as grocery stores, with a rate of 174.0, and general merchandise stores, with a rate of 152.6. (See table 9.)
Table 9. Incidence rates for nonfatal occupational injuries and illnesses involving days away from work per 10,000 full-time workers, by selected industries, 2008
|
All events |
Assaults by person |
Private industry |
113.3 |
1.7 |
Goods producing |
140.0 |
0.2 |
Service providing |
105.1 |
2.2 |
Retail trade |
120.0 |
0.8 |
Auto parts, accessories, and tire stores |
141.9 |
1.2 |
Grocery stores |
174.0 |
1.2 |
Gasoline stations |
91.9 |
2.4 |
Clothing stores |
66.3 |
1.9 |
General merchandise stores |
152.6 |
1.2 |
|
SOURCE: U.S. Bureau of Labor Statistics, Survey of Occupational Injuries and Illnesses
|
Although the incidence rate for nonfatal occupational injuries and illnesses requiring days away from work is relatively high in retail trade compared with other service-providing industries, the rate for nonfatal assaults is much lower in retail trade (0.8) than it is in private industry as a whole (1.7). Again, though, for certain types of retail stores, such as gasoline stations (2.4), the rates are considerably higher than the sector average.
For those cases in which the time of day is reported, more than 40 percent of nonfatal assaults and violent acts occurred between 8:00 p.m. and 8:00 a.m.
Nonfatal injuries by event. Over the period from 2003 to 2008, a total of 8,700 retail workers were injured as a result of an assault. Although assaults are the most common event that causes fatal injuries in retail, they represented only 1 percent of nonfatal injuries and illnesses requiring days away from work in 2008. (See table 10.) The most frequent events requiring days away from work in retail trade were bodily reaction and exertion (41 percent), contact with objects and equipment (29 percent), and falls (22 percent).18
Table 10. Number of nonfatal occupational injuries and illnesses involving days away from work for private retail trade and all other industries, by events or exposures, 2008
| Event |
Retail trade |
All other industries |
| Number |
Percent |
Number |
Percent |
All events |
146,320 |
100.0 |
931,820 |
100.0 |
Bodily reaction and exertion |
59,310 |
40.5 |
356,380 |
38.2 |
Contact with objects and equipment |
43,000 |
29.4 |
248,880 |
26.7 |
Falls |
31,680 |
21.7 |
203,160 |
21.8 |
Transportation incidents |
4,250 |
2.9 |
44,360 |
4.8 |
Exposure to harmful substances or environments |
3,650 |
2.5 |
41,830 |
4.5 |
Assaults and violent acts |
1,510 |
1.0 |
21,180 |
2.3 |
Other events or exposures |
2,920 |
2.0 |
16,030 |
1.7 |
| Addendum: Assaults and violent acts |
Assaults by person |
980 |
0.7 |
15,350 |
1.6 |
Hitting, kicking, beating |
320 |
|
6,120 |
0.7 |
Squeezing, pinching, scratching, twisting |
40 |
|
1,110 |
|
All other |
620 |
|
8,120 |
0.9 |
Assaults by animals |
500 |
|
5,620 |
0.6 |
|
NOTE: Because of rounding and data exclusion of nonclassifiable responses, data may not sum to the total.
SOURCE: U.S. Bureau of Labor Statistics, Survey of Occupational Injuries and Illnesses
|
Assaults by person by type of retail establishment. In 2008, there were 980 assaults in retail trade that required days away from work. (See table 11.) As with fatal injuries, workers in food and beverage stores and gasoline stations together made up a substantial share of these injuries from assaults (40 percent). Other types of stores with high shares were general merchandise stores (29 percent), motor vehicle and parts dealers (13 percent), and clothing and clothing accessories stores (13 percent).
Table 11. Nonfatal occupational injuries and illnesses involving days away from work in private retail trade, by type, 2008
| Industry |
All events |
Assaults by person |
Assaults as percentage of all nonfatal injuries and illnesses |
| Number |
Share |
Number |
Share |
All retail sales |
146,320 |
100.0 |
980 |
100.0 |
0.7 |
Food and beverage stores |
36,070 |
24.7 |
230 |
23.5 |
|
General merchandise stores |
34,650 |
23.7 |
280 |
28.6 |
0.8 |
Motor vehicle and parts dealers |
20,720 |
14.2 |
130 |
13.3 |
0.6 |
Building material and garden equipment and supplies dealers |
16,860 |
11.5 |
20 |
2.0 |
|
Gasoline stations |
6,330 |
4.3 |
160 |
16.3 |
2.5 |
Clothing and clothing accessories stores |
5,590 |
3.8 |
130 |
13.3 |
2.3 |
Sporting goods, hobby, book, and music stores |
2,690 |
1.8 |
20 |
2.0 |
0.7 |
All other |
23,410 |
16.0 |
10 |
1.0 |
|
|
NOTE: Because of rounding and data exclusion of nonclassifiable responses, data may not sum to the total.
SOURCE: U.S. Bureau of Labor Statistics, Survey of Occupational Injuries and Illnesses
|
Conclusion
Over the period from 2003 to 2008, there were 944 homicides and 8,700 nonfatal assaults by persons resulting in days away from work in the private retail sector. During this period, homicides were the leading cause of work-related death. Of these homicides, 63 percent were committed against workers in two types of establishments: food and beverage stores and gasoline stations. The majority of the victims of homicides in these establishments were foreign born, and 77 percent of the assailants were robbers. More than half of the homicides and more than 40 percent of nonfatal assaults occurred between the hours of 8:00 p.m. and 8:00 a.m. Of the nonfatal injuries and illnesses in 2008, approximately 40 percent occurred in food and beverage stores and gasoline stations.
There is some evidence that a relationship exists between occupational homicides and unemployment rates,19 suggesting that when unemployment rates are high occupational assaults and homicides will increase. As a result, during periods of high unemployment, retail establishments should consider taking additional steps to keep workers safe from crime.
Joyce Northwood
Economist, Census of Fatal Occupational Injuries, Office of Safety, Health, and Working Conditions, Bureau of Labor Statistics.
Telephone: (202) 691-6216; E-mail: Northwood.Joyce@bls.gov.
Notes
1 In the 2002 North American Industry Classification System (NAICS), retail trade includes industry sectors 44 and 45. See U.S. Census Bureau, North American Industry Classification System, 2002 NAICS, http://www.census.gov/cgi-bin/sssd/naics/naicsrch?chart=2002.
2 U.S. Census Bureau, “2008 Annual Retail Trade Survey tables,” Annual Retail Trade Survey Historical Data, last modified March 31, 2011, http://www2.census.gov/retail/releases/historical/arts/2008_ARTS.pdf.
3 U.S. Department of Commerce, Bureau of Economic Analysis, “Gross Domestic Product by Industry Data,” ReadMe for file GDPbyInd_VA_NAICS_1998-2010, last modified June 2, 2011 http://www.bea.gov/industry/gdpbyind_data.htm.
4 U.S. Bureau of Labor Statistics, Labor Force Statistics from the Current Population Survey, 2008 Annual Averages—Household Data—Tables from Employment and Earnings, table 18, “Employed persons by detailed industry, sex, race, and Hispanic or Latino ethnicity,” ftp://ftp.bls.gov/pub/special.requests/lf/aa2008/pdf/cpsaat18.pdf.
5 U.S. Census Bureau, The 2010 Statistical Abstract: National Data Book, table 1008, “Wholesale and Retail Trade—Establishments, Sales, Payroll, and Employees: 2002 and 2007,” http://www.census.gov/compendia/statab/2010/tables/10s1008.pdf.
6 U.S. Census Bureau, 2007 Economic Census, Retail Trade, “Sector 44: Retail Trade: Subject Series—Estab & Firm Size: Summary Statistics by Employment Size of Establishments for the United States: 2007,” http://factfinder.census.gov/servlet/IBQTable?_bm=y&-geo_id=&-fds_name=EC0700A1&-ds_name=EC0744SSSZ2&-_lang=en.
7 Centers for Disease Control and Prevention, National Institute of Occupational Safety and Health, “Violence in the Workplace: Risk Factors and Prevention Strategies,” last modified July 16, 1996, http://www.cdc.gov/niosh/violrisk.html.
8 U.S. Bureau of Labor Statistics, Survey of Workplace Violence Prevention, table 4, “Percent of establishments by selected potentially hazardous work environment characteristics, industry, and size class, 2005,” last modified October 27, 2006, http://www.bls.gov/iif/oshwc/ostb1632.pdf.
9 Ibid, table 1, http://www.bls.gov/iif/oshwc/ostb1629.pdf.
10 Federal Bureau of Investigation, Uniform Crime Reports: 2007 Crime in the United States, table 7, “Offense Analysis: United States, 2004—2008,” http://www.fbi.gov/about-us/cjis/ucr/crime-in-the-u.s/2008.
11 National Retail Federation, 2008 Organized Retail Crime Survey, p. 4, http://www.nrf.com/modules.php?name=News&op=viewlive&sp_id=664&parent_id=950&peer_rev=0&nrf_or=0.
12 The rate represents the number of fatal occupational injuries per 100,000 full-time equivalent workers and is calculated as follows:
(N÷EH) × 200,000,000, where
N = the number of fatal work injuries,
EH = total hours worked by all employees during the calendar year, and
200,000,000 = base for 100,000 equivalent full-time workers working 40 hours per week, 50 weeks per year.
13 For a detailed analysis of transportation fatalities in the mining sector, see Christopher A. Janicak, “Transportation Fatalities in the Mining Sector: 2004-2008,” Compensation and Working Conditions Online, http://www.bls.gov/opub/cwc/sh20110712ar01p1.htm.
14 U.S. Bureau of Labor Statistics, Labor Force Statistics from the Current Population Survey, 2008 Annual Averages—Household Data—Tables from Employment and Earnings, table 16, “Employed persons in nonagricultural industries by sex and class of worker,” ftp://ftp.bls.gov/pub/special.requests/lf/aa2008/pdf/cpsaat16.pdf.
15 U.S. Bureau of Labor Statistics, Labor Force Statistics from the Current Population Survey, 2008 Annual Averages—Household Data—Tables from Employment and Earnings, table 18, “Employed persons by detailed industry, sex, race, and Hispanic or Latino ethnicity,” ftp://ftp.bls.gov/pub/special.requests/lf/aa2008/pdf/cpsaat18.pdf.
16 Days away from work cases include those that resulted in days away from work, some of which also included job transfer or restriction.
17 Incidence rates represent the number of injuries and illnesses per 10,000 full-time workers and are calculated as follows:
(N÷EH) × 20,000, where
N = number of injuries and illnesses,
EH = total hours worked by all employees during the calendar year, and
20,000,000 = base for 10,000 equivalent full-time workers (working 40 hours per week, 50 weeks per year).
18 For a more detailed analysis of the types of injuries and illnesses that occur in grocery stores, see Cynthia M. Clarke, “Workplace Injuries and Illnesses in Grocery Stores,” Compensation and Working Conditions Online, December 19, 2009, http://www.bls.gov/opub/cwc/sh20031216ar01p1.htm.
19 Christopher A. Janicak, “Regional Variations in Workplace Homicide Rates,” Compensation and Working Conditions Online, November 24, 2003, http://www.bls.gov/opub/cwc/sh20031119ar01p1.htm.