You are here

Computing

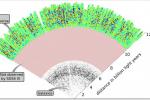
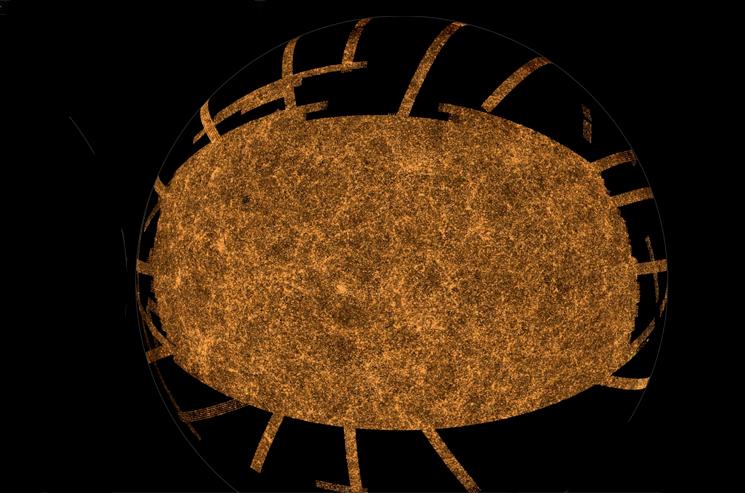
This is an image of one-third of the total area of the sky (14,000 square degrees) including 1.5 million galaxies as recorded by the Sloan Digital Sky Survey. Berkeley Lab’s <a href="http://www.nersc.gov/">National Energy Research Scientific Computing Center</a>, which broke down data collected from a 2.5-meter telescope at Apache Point Observatory in New Mexico and built it up into the most accurate calculation yet made of everything in space and how it sticks together. <a href ="http://energy.gov/articles/new-mariners-and-massive-map-berkeley-computers-calculate-whats-sky">Read more</a>.

This is an image of one-third of the total area of the sky (14,000 square degrees) including 1.5 million galaxies as recorded by the Sloan Digital Sky Survey. Berkeley Lab’s National Energy Research Scientific Computing Center, which broke down data collected from a 2.5-meter telescope at Apache Point Observatory in New Mexico and built it up into the most accurate calculation yet made of everything in space and how it sticks together. Read more.

Frozen Telescope Looks to Ends of the Earth for Answers
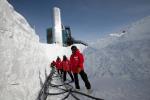
Researchers drilled holes in the ice to a depth of almost 1.5 miles, and lowered 60 basketball-sized detectors called digital optical modules (DOMs) into each of the 86 holes. They then had to pull cables to connect the sensors to IceCube Lab’s servers in order to collect data. | Photo courtesy of the National Science Foundation

Researchers built a telescope at the South Pole, drilling more than a mile into the ice to detect the mysterious high-energy neutrinos.

New Mariners and a Massive Map: Berkeley Computers Calculate What's in the Sky
This is the Southern Galactic Cap view as recorded by the Sloan Digital Sky Survey. A 2.5-meter telescope at Apache Point Observatory in New Mexico took in light from over a third of the total area of the sky (14,000 square degrees) including 1.5 million galaxies. | Photo courtesy of the Sloan Digital Sky Survey.

Berkeley computers helped crunch the data to create the largest 3-D color map of the universe ever made.

Superlative Supercomputers: Argonne’s Mira to Accelerate Scientific Discoveries, Societal Benefits
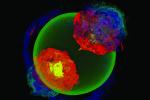
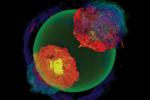
This is a computer simulation of a Class 1a supernova. Argonne National Laboratory's Mira will have enough computing power to help researchers run simulations of exploding stars, specifically, of the turbulent nuclear combustion that sets off type 1a supernovae. | Photo courtesy of Argonne National Laboratory

With 48,000 nodes, 768 cores and 768 terabytes of memory, Mira will scream at some 10 petaflops per second and help scientists unlock the secrets of supernovae.

Supercomputers Crack Sixty-Trillionth Binary Digit of Pi-Squared
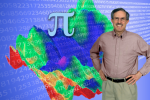
David H. Bailey | Photo Courtesy of Lawrence Berkely National Lab

The calculation would have taken a single computer processor unit (CPU) 1,500 years to calculate -- but it took just a few months using the "BlueGene/P" supercomputer, which is designed to run continuously at one quadrillion calculations per second.

Geek-Up[6.24.11]: The End of Our Solar System is Bubbly
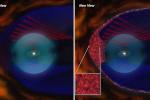
Old and new views of the heliosheath. Red and blue spirals are the gracefully curving magnetic field lines of orthodox models. New data from Voyager add a magnetic froth (inset) to the mix. | Courtesy of NASA

The Cray XT4 supercomputer at the Lawrence Berkeley National Laboratory’s National Energy Research Scientific Computing Center (NERSC) is helping to explain the froth of apparent "bubbles."