
Data Dashboards: Bringing More Market Information to Life
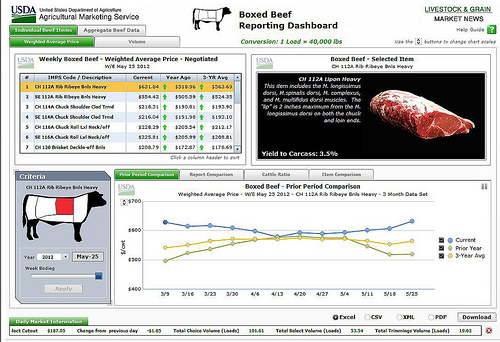
A screenshot of the Boxed Beef Dashboard. The livestock dashboards allow you to see weekly volume and price information presented in graphs and tables that can be customized for viewing and downloaded for use in reports and presentations.
It has been said that the most successful person in life (and in business) is often the one who has the best information. For almost a century USDA Market News has been providing farmers, ranchers and businesses with the best market and pricing information. Our real-time commodity reports, produced by the Agricultural Marketing Service (AMS), provide quick and easy access to volume and price information for boxed beef, cattle, hogs, and sheep.
Over the years, our reports have evolved to better meet the changing demands of the farmers and ranchers who rely on our data to remain competitive. In the summer of 2010, we launched the first of our livestock data dashboards, providing a highly customized experience for our data consumers.
The Boxed Beef Dashboard, the newest addition to the Livestock and Grain Market News dashboards, includes a lot of the same great tools that have made our other dashboards so popular—interactive features for querying and viewing information, like navigation tabs, slide bars, graphs, tables, and daily market tickers.
A unique feature on the new Boxed Beef Dashboard displays a diagram of a steer that dynamically illustrates the area of the animal the cut of meat comes from. It also shows a color photograph and brief description of the wholesale beef cut, providing quick visual cues to help sort and sift the information more quickly.
Like all of our dashboards, it also offers a range of options to download and export custom datasets, giving you only the datapoints that are most meaningful to you. The users’ guide provides a feature-by-feature overview of the dashboard and is a great place to start if you’re new to the datasets.
USDA Market News has been providing market information on cotton, dairy, livestock and grains, poultry and eggs, and fruits and vegetables for over 90 years. By visiting USDA Market News you can view hundreds of pre-made commodity reports—including the livestock dashboards—or create a custom report to see only the information you need.
Get the same insight as other industry insiders—visit the livestock dashboards.
Tags: AMS, Dashboard, Data, Industry Insight, Livestock & Grain, Open Gov, Pricing, USDA Market News