Discovery
Mapping Patterns in Crime With Geography and Math

With support from NSF's SBIR program, Robert Cheetham, founder and president of Azavea, is developing software to sort through crime data and create maps that are useful for police departments
April 21, 2011
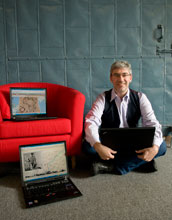
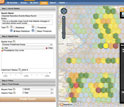
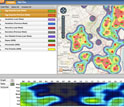
"I was a landscape architect who turned to a life of crime," jokes Robert Cheetham, founder of Azavea, a software development and research firm based in Philadelphia. Fourteen years ago, he was one of two landscape architects who were hired to start a Crime Analysis and Mapping Unit for the Philadelphia Police Department. Today, combining the eye of a designer with statistics and computer science, he is leading an effort to create software that can sift through mountains of crime data to find geographic patterns and then create visually evocative maps for police departments. An early warning system for crime The modern crime analyst uses digital mapping software to identify and display patterns and trends in crime. In a large city, this can mean sorting through millions of records generated by a police department in a given year. While serving as a crime analyst in Philadelphia, Cheetham developed an idea for an automated software system that would mine the data for the information that would enable police officers and detectives to both catch criminals and to more effectively deploy patrols in response to changing patterns in crime. He wrote a brief paper, outlining how such a system might operate, but then went on to found his own company, where he worked on land conservation, stormwater modeling and other geographic data analysis problems. But, meanwhile, the Philadelphia Police Department hadn't forgotten about the idea. In 2004, Deputy Commissioner Charles Brennan approached Cheetham about creating a prototype for a 'Crime Spike Detector' that could serve as an early warning system for crime. That initial prototype focused on searching for patterns in each of several types of crime--robbery, burglary, assault, theft and auto theft. Every night, the system would add the latest crime events to the millions of past events and look for situations where the level of crime had changed in an unexpected way. Working with Tony Smith at the University of Pennsylvania, Cheetham and his colleagues developed a set of mathematical routines for detecting these unexpected changes. When the software detected a "spike" in crime, it would compose an email, determine who was responsible for the particular location and send them a warning. The captains of a police district would receive this email and could then log into a web site where they could see the information on a map and determine how they would respond to the new pattern. The prototype proved so successful that the police captains began requesting additional search patterns that would enable them to monitor other types of crime. They also wanted the flexibility to test their own theories or "hunches" about when and where crimes were occurring in the city. The daily crime forecast Cheetham used the success of this initial prototype to apply for a Small Business Innovation Research (SBIR) grant from the National Science Foundation (NSF) in 2007. This grant enabled Azavea to create a next generation software tool, called HunchLab. The new software supports not only the early warning system capabilities of the original prototype, but can also generate animations and forecasts of projected changes in crime. "This isn't yet 'Minority Report,'" Cheetham said. "We don't know where and when a particular crime will occur, but we can look for patterns in the time-of-day, day-of-week, seasonal changes and locations to create a forecast of the changes in the relative risk of a particular crime occurring." For example, Cheetham's team is working with Professor Jerry Ratcliffe at Temple University to create a daily risk forecast for burglaries, shootings and other crime. Police officers have understood for many decades that, for some crimes, the risk of being a repeat victim is quite high. In other words, if you are a victim of a burglary, there is actually a significant chance you will be a repeat victim in the weeks after the initial crime. But Ratcliffe and his colleagues discovered something equally interesting. Not only is there an elevated risk that someone will be a repeat victim, but that the risk of their neighbors becoming a victim is also higher for a few weeks after the initial crime. The Azavea team has turned this discovery into a daily risk map that precinct commanders can use to make better decisions about where police officers will patrol. "Recent mapping technologies like Google Maps have made it much easier to show dots on a map. But we are interested in going beyond the fact that a crime incident occurred at a location," Cheetham said. "We're combining software, math and geographic information science to discover the patterns that are around us. As our society generates more and more of this type of data, the challenge then becomes how to communicate these patterns in a way that is clear and easy for others to understand." -- Robert Cheetham and Mary L. Johnson, Azavea Inc. This Behind the Scenes article was provided to LiveScience in partnership with the National Science Foundation.
Investigators
Robert Cheetham
Jerry Ratcliffe
Tony Smith
Related Institutions/Organizations
Temple University
University of Pennsylvania
Locations
Pennsylvania
Related Programs
Small Business Innovation Research Program Phase I Solicitation FY-2011 (Release 2)
Opportunities for Small Business Phase II Partnerships with an Engineering Research Center (ERC)
Related Awards
#0750507 SBIR Phase II: Algorithms and Visualization Techniques for the Detection of Geographic Aberrations in Crime (GIS)
#0637589 SBIR Phase I: Algorithms and Visualization Techniques for the Detection of Geographic Aberrations in Crime (GIS)
Total Grants
$799,471
Related Websites
LiveScience.com: Behind the Scenes: Mapping Patterns in Crime With Geography and Math: http://www.livescience.com/13740-mapping-patterns-crime-geography-math-bts-110415.html
Azavea Inc.: http://www.azavea.com/
Robert Cheetham: http://www.azavea.com/about-us/staff-profiles/robert-cheetham/
HunchLab: http://www.azavea.com/products/hunchlab/
|