Climate Change
Sources of Greenhouse Gas Emissions
- Overview
- Electricity
- Transportation
- Industry
-
Commericial
& Residential - Agriculture
-
Land Use
& Forestry
Overview

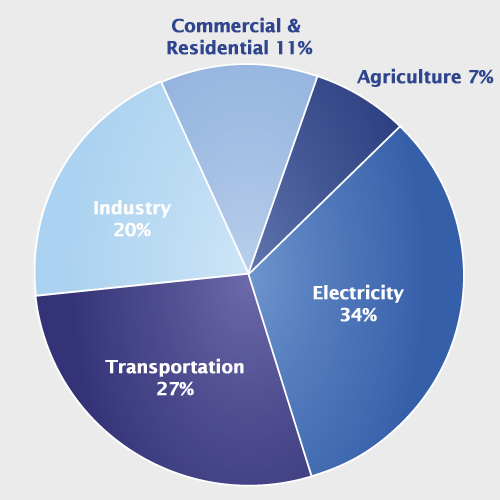
Total U.S. Greenhouse Gas Emissions by Economic Sector in 2010

Total Emissions in 2010 = 6,822 Million Metric Tons of CO2 equivalent
* Land Use, Land-Use Change, and Forestry in the United States is a net sink and offsets approximately 15% of these greenhouse gas emissions.
Greenhouse gases trap heat and make the planet warmer. Human activities are responsible for almost all of the increase in greenhouse gases in the atmosphere over the last 150 years. [1] The largest source of greenhouse gas emissions from human activities in the United States is from burning fossil fuels for electricity, heat, and transportation.
EPA tracks total U.S. emissions by publishing the Inventory of U.S. Greenhouse Gases and Sinks . This annual report estimates the total national greenhouse gas emissions and removals associated with human activities across the United States.
The primary sources of greenhouse gas emissions in the United States are:
- Electricity production (34% of 2010 greenhouse gas emissions) - Electricity production generates the largest share of greenhouse gas emissions. Over 70% of our electricity comes from burning fossil fuels, mostly coal and natural gas. [2]
- Transportation (27% of 2010 greenhouse gas emissions) - Greenhouse gas emissions from transportation primarily come from burning fossil fuel for our cars, trucks, ships, trains, and planes. About 90% of the fuel used for transportation is petroleum based, which includes gasoline and diesel. [3]
- Industry (21% of 2010 greenhouse gas emissions) - Greenhouse gas emissions from industry primarily come from burning fossil fuels for energy as well as greenhouse gas emissions from certain chemical reactions necessary to produce goods from raw materials.
- Commercial and Residential (11% of 2010 greenhouse gas emissions) - Greenhouse gas emissions from businesses and homes arise primarily from fossil fuels burned for heat, the use of certain products that contain greenhouse gases, and the handling of waste.
- Agriculture (7% of 2010 greenhouse gas emissions) - Greenhouse gas emissions from agriculture come from livestock such as cows, agricultural soils, and rice production.
- Land Use and Forestry (offset of 15% of 2010 greenhouse gas emissions) - Land areas can act as a sink (absorbing CO2 from the atmosphere) or a source of greenhouse gas emissions. In the United States, since 1990, managed forests and other lands have absorbed more CO2 from the atmosphere than they emit.
Emissions and Trends
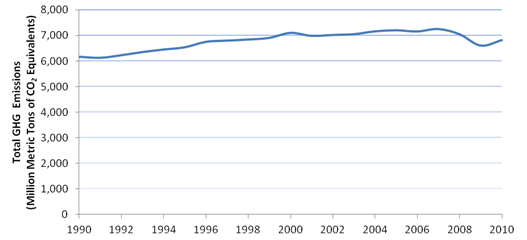
Since 1990, U.S. greenhouse gas emissions have increased by about 10%. From year to year, emissions can rise and fall due to changes in the economy, the price of fuel, and other factors. In 2010, U.S. greenhouse gas emissions increased compared to the 2009 levels. This increase was primarily due to an increase in economic output that increased energy consumption across all sectors. In addition, much warmer summer conditions resulted in an increase in electricity demand for air conditioning that was generated primarily by combusting coal and natural gas.
Total U.S. Greenhouse Gas Emissions, 1990-2010

All emission estimates from the Inventory of U.S. Greenhouse Gas Emissions and Sinks: 1990-2010 .
To learn about projected greenhouse gas emissions to 2020, visit the U.S. Climate Action Report 2010 .
References
-
IPCC (2007). Summary for Policymakers. In: Climate Change 2007: The Physical Science Basis
.
 Contribution of Working Group I to the Fourth Assessment Report of the Intergovernmental Panel on Climate Change [Solomon, S., D. Qin, M. Manning, Z. Chen, M. Marquis, K.B. Averyt, M. Tignor and H.L. Miller (eds.)]. Cambridge University Press, Cambridge, United Kingdom and New York, NY, USA.
 - U.S. Energy Information Administration (2011). Electricity Explained - Basics .
-
Kahn Ribeiro, S., S. Kobayashi, M. Beuthe, J. Gasca, D. Greene, D. S. Lee, Y. Muromachi, P. J. Newton, S. Plotkin, D. Sperling, R. Wit, P. J. Zhou (2007). Transport and its infrastructure. In Climate Change 2007: Mitigation
.
 Contribution of Working Group III to the Fourth Assessment Report of the Intergovernmental Panel on Climate Change [B. Metz, O.R. Davidson, P.R. Bosch, R. Dave, L.A. Meyer (eds.)], Cambridge University Press, Cambridge, United Kingdom.
Global Warming Potential Describes Impact of Each Gas
Certain greenhouse gases (GHGs) are more effective at warming Earth ("thickening the blanket") than others.The two most important characteristics of a GHG in terms of climate impact are how well the gas absorbs energy (preventing it from immediately escaping to space), and how long the gas stays in the atmosphere.
The Global Warming Potential (GWP) for a gas is a measure of the total energy that a gas absorbs over a particular period of time (usually 100 years), compared to carbon dioxide.[1] The larger the GWP, the more warming the gas causes. For example, methane's 100-year GWP is 21, which means that methane will cause 21 times as much warming as an equivalent mass of carbon dioxide over a 100-year time period.[2]

- Carbon dioxide (CO2) has a GWP of 1 and serves as a baseline for other GWP values. CO2 remains in the atmosphere for a very long time - changes in atmospheric CO2 concentrations persist for thousands of years.
- Methane (CH4) has a GWP more than 20 times higher than CO2 for a 100-year time scale. CH4 emitted today lasts for only about a decade in the atmosphere, on average.[3] However, on a pound-for-pound basis, CH4 absorbs more energy than CO2, making its GWP higher.
- Nitrous Oxide (N2O) has a GWP 300 times that of CO2 for a 100-year timescale. N2O emitted today remains in the atmosphere for more than 100 years, on average.[3]
Chlorofluorocarbons (CFCs), hydrofluorocarbons (HFCs), hydrochlorofluorocarbons (HCFCs), perfluorocarbons (PFCs), and sulfur hexafluoride (SF6) are sometimes called high-GWP gases because, for a given amount of mass, they trap substantially more heat than CO2.
[1]
Solomon, S., D. Qin, M. Manning, R.B. Alley, T. Berntsen, N.L. Bindoff, Z. Chen, A. Chidthaisong, J.M. Gregory, G.C. Hegerl, M. Heimann, B. Hewitson, B.J. Hoskins, F. Joos, J. Jouzel, V. Kattsov, U. Lohmann, T. Matsuno, M. Molina, N. Nicholls, J. Overpeck, G. Raga, V. Ramaswamy, J. Ren, M. Rusticucci, R. Somerville, T.F. Stocker, P. Whetton, R.A. Wood and D. Wratt (2007). Technical Summary. In: Climate Change 2007: The Physical Science Basis
.
![]() Contribution of Working Group I to the Fourth Assessment Report of the Intergovernmental Panel on Climate Change [Solomon, S., D. Qin, M. Manning, Z. Chen, M. Marquis, K.B. Averyt, M. Tignor and H.L. Miller (eds.)]. Cambridge University Press, Cambridge, United Kingdom and New York, NY, USA.
Contribution of Working Group I to the Fourth Assessment Report of the Intergovernmental Panel on Climate Change [Solomon, S., D. Qin, M. Manning, Z. Chen, M. Marquis, K.B. Averyt, M. Tignor and H.L. Miller (eds.)]. Cambridge University Press, Cambridge, United Kingdom and New York, NY, USA.
[2]
Forster, P., V. Ramaswamy, P. Artaxo, T. Berntsen, R. Betts, D.W. Fahey, J. Haywood, J. Lean, D.C. Lowe, G. Myhre, J. Nganga, R. Prinn, G. Raga, M. Schulz and R. Van Dorland (2007). Changes in Atmospheric Constituents and in Radiative Forcing. In: Climate Change 2007: The Physical Science Basis
.
![]() Contribution of Working Group I to the Fourth Assessment Report of the Intergovernmental Panel on Climate Change [Solomon, S., D. Qin, M. Manning, Z. Chen, M. Marquis, K.B. Averyt, M. Tignor and H.L. Miller (eds.)]. Cambridge University Press, Cambridge, United Kingdom and New York, NY, USA.
Contribution of Working Group I to the Fourth Assessment Report of the Intergovernmental Panel on Climate Change [Solomon, S., D. Qin, M. Manning, Z. Chen, M. Marquis, K.B. Averyt, M. Tignor and H.L. Miller (eds.)]. Cambridge University Press, Cambridge, United Kingdom and New York, NY, USA.
[3]
NRC (2010). Advancing the Science of Climate Change
.
![]() National Research Council. The National Academies Press, Washington, DC, USA.
National Research Council. The National Academies Press, Washington, DC, USA.
6,633 million metric tons of CO2 equivalent--what does that mean?
An Explanation of Units
A million metric tons is equal to about 2.2 billion pounds, or 1 trillion grams. For comparison, a small car is likely to weigh a little more than 1 metric ton. Thus, a million metric tons is roughly the same mass as 1 million small cars!
The U.S. Inventory uses metric units for consistency and comparability with other countries. For reference, a metric ton is a little bit larger (about 10%) than a U.S. "short" ton.
GHG emissions are often measured in carbon dioxide (CO2) equivalent. To convert emissions of a gas into CO2 equivalent, its emissions are multiplied by the gas's Global Warming Potential (GWP). The GWP takes into account the fact that many gases are more effective at warming Earth than CO2, per unit mass.
The GWP values appearing in the Emissions webpages reflect the values used in the U.S. Inventory, which are drawn from the IPCC's Second Assessment Report (SAR). For further discussion of GWPs and an estimate of GHG emissions using updated GWPs, see Annex 6 of the U.S. Inventory and the IPCC's discussion on GWPs.
![]()
