

4th-Quarter 2010 Domestic Air Fares Rose 5.2% from 4th Quarter 2009; Top 100 Airports: Highest Fare in Newark, Lowest Fare in Atlantic City
|
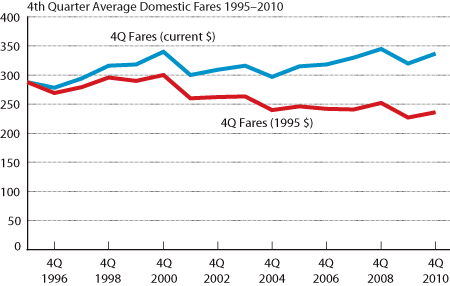
Domestic Air Fares
Table Version | Excel | CSV
Wednesday, May 4, 2011 - Average domestic air fares rose to $337 in the fourth quarter of 2010, up 5.2 percent from the average fare of $320 in the fourth quarter of 2009 (Table 1), the U.S. Department of Transportation's Bureau of Transportation Statistics (BTS) reported today. Newark-Liberty, NJ, had the highest average fare, $461, while Atlantic City, NJ, had the lowest, $156 (Table 3).
Fourth-quarter fares decreased 0.9 percent from the third quarter, the second consecutive quarterly decline after four increases (Table 2).
BTS, a part of the Research and Innovative Technology Administration, reports average fares based on domestic itinerary fares, round-trip or one-way for which no return is purchased. Fares are based on the total ticket value which consists of the price charged by the airlines plus any additional taxes and fees levied by an outside entity at the time of purchase. Fares include only the price paid at the time of the ticket purchase and do not include other fees, such as baggage fees, paid at the airport or onboard the aircraft. Averages do not include frequent-flyer or "zero fares" or a few abnormally high reported fares.
Not inflation-adjusted, the $337 fourth-quarter 2010 average fares were down 6.2 percent from the all-time high of $359 in the third quarter of 2008. Fourth-quarter 2010 average fares were up 13.2 percent from the post-9/11 fourth-quarter low of $297 in 2004, not adjusted for inflation. Adjusted for inflation, fourth-quarter 2010 fares in 1995 dollars were $236, down 21.4 percent from the average fare of $300 in the fourth quarter of 2000, the inflation-adjusted high for any fourth quarter since 1995 (Table 1). BTS air fare records reach back to 1995. See BTS Air Fare web page for historic data.
Average fares for the full year 2010 were $337, up 8.4 percent from 2009 but down 2.8 percent from 2008, which at $346 was the highest year on record since 1995, not adjusted for inflation. Adjusting for inflation in 1995 dollars, fares in 2010 averaged $235 up 6.7 percent from 2009 but down 21.6 percent from the inflation-adjusted high of $300 in 2000. See Annual Fares.
Passenger airlines collected 71.1 percent of their total revenue from passenger fares during the first nine months of 2010 (Table 1A). Full year 2010 numbers will be issued later this month.
Air fares in the fourth quarter of 2010 decreased 1.0 percent from the fourth quarter of 2000, compared to an overall increase in consumer prices of 26.0 percent during that period (Table 6). In the 15 years from 1995, the first year of BTS air fare records, air fares rose 17.0 percent compared to a 42.8 percent inflation rate. In 1995 dollars, the average air fare in the fourth quarter of 2010 was $236, compared to $288 in 1995 and $300 in 2000 (Table 1).
See tables below for the following information about the top 100 airports based on 2009 originating passengers.
Table 3: Five highest and five lowest average fares in the fourth quarter: Newark-Liberty had the highest average fare, $461, while Atlantic City had the lowest, $156. For the Top 100 Airports, see Table 8 on the BTS website.
Table 4: Five largest increases and five largest decreases from the fourth quarter of 2009 to the fourth quarter of 2010: El Paso, TX, had the largest increase, 19.9 percent, and Atlantic City, NJ, had the largest decrease, 18.2 percent. For the Top 100 Airports, see Table 9 on the BTS website.
Table 5: Five largest increases and five largest decreases from the fourth quarter of 2000 to the fourth quarter of 2010: Burbank/Glendale/Pasadena, CA had the largest increase, 42.2 percent, and White Plains, NY, had the largest decrease, 44.0 percent. For the Top 100 Airports, see Table 10 on the BTS website.
See the BTS Air Fare web page for average fares for the top 100 airports. Rankings can also be found on the BTS website. Fares for Alaska, Hawaii and Puerto Rico airports, which are not included in rankings, are available on the web page. Average fares for all airports are also available. Since average fares are based on the Origin and Destination Survey 10 percent ticket sample, averages for airports with smaller samples may be less reliable.
First-quarter 2011 average fare data will be released on July 27.
Table 1: 4th Quarter Average Fares 1995-2010 Compared to Inflation Rate
Fares based on domestic itinerary fares, round-trip or one-way for which no return is purchased. Fares are based on the total ticket value which consists of the price charged by the airlines plus any additional taxes and fees levied by an outside entity at the time of purchase. Fares include only the price paid at the time of the ticket purchase and do not include other fees, such as baggage fees, paid at the airport or onboard the aircraft. Averages do not include frequent-flyer or "zero fares" or a few abnormally high reported fares.
Averages do not include frequent flyer fares.
| Average Domestic 4Q Fares ($) | Percent change from previous year | Percent change from 1995 | ||||
|---|---|---|---|---|---|---|
| Average Fares (4Q to 4Q) | Inflation (Dec from previous Dec)* | Cumulative Average Fares (4Q 1995 to 4Q of each year) | Cumulative inflation rate (Dec of each year from Dec 1995)* | Average Fare in 1995 dollars | ||
| 1995 | 288 | 288 | ||||
| 1996 | 278 | -3.3 | 3.3 | -3.3 | 3.3 | 269 |
| 1997 | 294 | 5.5 | 1.7 | 2.0 | 5.1 | 279 |
| 1998 | 316 | 7.7 | 1.6 | 9.9 | 6.8 | 296 |
| 1999 | 318 | 0.6 | 2.7 | 10.5 | 9.6 | 290 |
| 2000 | 340 | 7.0 | 3.4 | 18.2 | 13.4 | 300 |
| 2001 | 300 | -11.8 | 1.6 | 4.2 | 15.1 | 260 |
| 2002 | 309 | 3.0 | 2.4 | 7.3 | 17.9 | 262 |
| 2003 | 316 | 2.2 | 1.9 | 9.7 | 20.1 | 263 |
| 2004 | 297 | -5.9 | 3.3 | 3.3 | 24.0 | 240 |
| 2005 | 315 | 5.9 | 3.4 | 9.4 | 28.2 | 246 |
| 2006 | 318 | 1.1 | 2.5 | 10.6 | 31.5 | 242 |
| 2007 | 330 | 3.6 | 4.1 | 14.6 | 36.8 | 241 |
| 2008 | 345 | 4.7 | 0.1 | 20.0 | 37.0 | 252 |
| 2009 | 320 | -7.4 | 2.7 | 11.1 | 40.7 | 227 |
| 2010 | 337 | 5.2 | 1.5 | 17.0 | 42.8 | 236 |
Source: Bureau of Transportation Statistics
* Rate calculated using Bureau of Labor Statistics Consumer Price Index.
Note: Percent change based on unrounded numbers
Table 1A Passenger Airline Revenue from Fares 1990-2010 (through September)
Revenue from Passenger Fares as Percent of Scheduled Passenger Airline Total Revenue*
| Year | Revenue from Passenger Fares as Percent of Total Scheduled Passenger Airline Revenue* (%) |
|---|---|
| 1990 | 87.6 |
| 1995 | 85.6 |
| 2000 | 84.1 |
| 2001 | 82.7 |
| 2002 | 82.3 |
| 2003 | 79.5 |
| 2004 | 76.6 |
| 2005 | 75.0 |
| 2006 | 74.4 |
| 2007 | 74.3 |
| 2008 | 72.9 |
| 2009 | 70.2 |
| 2010 ( thru 3Q) | 71.1 |
Source: Bureau of Transportation Statistics, P-12
* Scheduled passenger airline total revenue is the sum of the following Schedule P12 accounts with account numbers: Reservation cancellation fees (3919.1), Baggage fees (3906.2), Miscellaneous Operating Revenue (3919.2), Transport-Related Revenue (4898) and Passenger Revenue (Fares) (3901).
Table 2: Quarterly Change in Average Domestic Airline Fares
Percent Change by Quarter
Fares based on domestic itinerary fares, round-trip or one-way for which no return is purchased. Fares are based on the total ticket value which consists of the price charged by the airlines plus any additional taxes and fees levied by an outside entity at the time of purchase. Fares include only the price paid at the time of the ticket purchase and do not include other fees, such as baggage fees, paid at the airport or onboard the aircraft. Averages do not include frequent-flyer or "zero fares" or a few abnormally high reported fares.
| Average Domestic Fares | ||
|---|---|---|
| Avg Fare ($) | Pct. Change from Previous Quarter | |
| 1Q 2009 | 314 | -9.1 |
| 2Q 2009 | 302 | -3.8 |
| 3Q 2009 | 307 | 1.7 |
| 4Q 2009 | 320 | 4.2 |
| 1Q 2010 | 328 | 2.6 |
| 2Q 2010 | 341 | 3.8 |
| 3Q 2010 | 340 | -0.3 |
| 4Q 2010 | 337 | -0.9 |
Source: Bureau of Transportation Statistics
Note: Percent change based on unrounded numbers
Note: Quarter-to-quarter changes may be affected by seasonal factors.
Table 3: Highest and Lowest U.S. Domestic Average Itinerary Fares 4th Quarter 2010
Top 100 Airports* Based on 2009 U.S. Originating Domestic Passengers
Fares based on domestic itinerary fares, round-trip or one-way for which no return is purchased. Fares are based on the total ticket value which consists of the price charged by the airlines plus any additional taxes and fees levied by an outside entity at the time of purchase. Fares include only the price paid at the time of the ticket purchase and do not include other fees, such as baggage fees, paid at the airport or onboard the aircraft. Averages do not include frequent-flyer or "zero fares" or a few abnormally high reported fares.
| Rank | Origin | 4th Quarter 2010 ($) |
|---|---|---|
| Highest Average Fares | ||
| 1 | Newark-Liberty, NJ | 461 |
| 2 | Charleston, SC | 454 |
| 3 | Fresno, CA | 440 |
| 4 | Des Moines, IA | 436 |
| 5 | Cincinnati, OH | 430 |
| Average Fare at All Airports | 337 | |
| Lowest Average Fares | ||
| 1 | Atlantic City, NJ | 156 |
| 2 | Orlando, FL | 243 |
| 3 | Ft. Lauderdale, FL | 244 |
| 4 | Ft. Myers, FL | 247 |
| 5 | Long Beach, CA | 252 |
Source: Bureau of Transportation Statistics
* Not including Alaska, Hawaii or Puerto Rico
Note: Percent change based on unrounded numbers
Table 4: Top 5 Increases/Smallest Decreases and Top 5 Decreases in U.S. Domestic Average Itinerary Fare, 2009 – 2010
Top 100 Airports* Based on 2009 U.S. Originating Domestic Passengers
Fares based on domestic itinerary fares, round-trip or one-way for which no return is purchased. Fares are based on the total ticket value which consists of the price charged by the airlines plus any additional taxes and fees levied by an outside entity at the time of purchase. Fares include only the price paid at the time of the ticket purchase and do not include other fees, such as baggage fees, paid at the airport or onboard the aircraft. Averages do not include frequent-flyer or "zero fares" or a few abnormally high reported fares.
| Rank | Origin | 4th Quarter 2009 ($) | 4th Quarter 2010 ($) | Percent Change |
|---|---|---|---|---|
| Largest Increases | ||||
| 1 | El Paso, TX | 305 | 365 | 19.9 |
| 2 | Charleston, SC | 383 | 454 | 18.4 |
| 3 | Fresno, CA | 378 | 440 | 16.4 |
| 4 | Santa Ana (Orange County), CA | 286 | 330 | 15.4 |
| 5 | Newark-Liberty, NJ | 406 | 461 | 13.5 |
| Average Fare at All Airports | 320 | 337 | 5.2 | |
| Largest Decreases | ||||
| 1 | Atlantic City, NJ | 190 | 156 | -18.2 |
| 2 | Huntsville, AL | 490 | 424 | -13.3 |
| 3 | Grand Rapids, MI | 412 | 360 | -12.6 |
| 4 | Pensacola, FL | 392 | 364 | -7.1 |
| 5 | Greensboro/High Point, NC | 364 | 351 | -3.6 |
Source: Bureau of Transportation Statistics
* Not including Alaska, Hawaii or Puerto Rico
Note: Percent change based on unrounded numbers
Table 5: Top 5 U.S. Domestic Average Itinerary Fare Increases and Decreases, 2000-2010
Top 100 Airports* Based on 2009 U.S. Originating Domestic Passengers
Fares based on domestic itinerary fares, round-trip or one-way for which no return is purchased. Fares are based on the total ticket value which consists of the price charged by the airlines plus any additional taxes and fees levied by an outside entity at the time of purchase. Fares include only the price paid at the time of the ticket purchase and do not include other fees, such as baggage fees, paid at the airport or onboard the aircraft. Averages do not include frequent-flyer or "zero fares" or a few abnormally high reported fares.
| Rank | Origin | 4th Quarter 2000 ($) | 4th Quarter 2010 ($) | Percent Change |
|---|---|---|---|---|
| Largest Increases | ||||
| 1 | Burbank/Glendale/Pasadena, CA | 188 | 267 | 42.2 |
| 2 | El Paso, TX | 258 | 365 | 41.6 |
| 3 | Lubbock, TX | 230 | 314 | 36.3 |
| 4 | Reno, NV | 221 | 294 | 33.2 |
| 5 | Dallas Love, TX | 198 | 255 | 28.9 |
| Average Fare at All Airports | 340 | 337 | -1.0 | |
| Largest Decreases | ||||
| 1 | White Plains, NY | 552 | 309 | -44.0 |
| 2 | Atlantic City, NJ | 227 | 156 | -31.5 |
| 3 | Milwaukee, WI | 363 | 259 | -28.7 |
| 4 | Pittsburgh, PA | 422 | 302 | -28.5 |
| 5 | Denver, CO | 419 | 299 | -28.5 |
Source: Bureau of Transportation Statistics
* Not including Alaska, Hawaii or Puerto Rico
Note: Percent change based on unrounded numbers
Table 6: Percent Changes to 2010 in Domestic Average Itinerary Fares and the Inflation Rate* by Year Since 1995
(3rd Quarter to 3rd Quarter for fares; September to September for inflation)
Fares based on domestic itinerary fares, round-trip or one-way for which no return is purchased. Fares are based on the total ticket value which consists of the price charged by the airlines plus any additional taxes and fees levied by an outside entity at the time of purchase. Fares include only the price paid at the time of the ticket purchase and do not include other fees, such as baggage fees, paid at the airport or onboard the aircraft. Averages do not include frequent-flyer or "zero fares" or a few abnormally high reported fares.
| Since 4th Quarter... | Duration in Years | Average 4Q Itinerary Fare ($) | Percent Change in Average Fare to 4th Quarter 2010 | Inflation Rate to Dec 2010 |
|---|---|---|---|---|
| 2010 | - | 337 | 0.0 | |
| 2009 | 1 | 320 | 5.2 | 1.5 |
| 2008 | 2 | 345 | -2.6 | 4.3 |
| 2007 | 3 | 330 | 2.1 | 4.4 |
| 2006 | 4 | 318 | 5.8 | 8.6 |
| 2005 | 5 | 315 | 6.9 | 11.4 |
| 2004 | 6 | 297 | 13.2 | 15.2 |
| 2003 | 7 | 316 | 6.6 | 18.9 |
| 2002 | 8 | 309 | 9.0 | 21.2 |
| 2001 | 9 | 300 | 12.3 | 24.0 |
| 2000 | 10 | 340 | -1.0 | 26.0 |
| 1999 | 11 | 318 | 5.9 | 30.2 |
| 1998 | 12 | 316 | 6.4 | 33.7 |
| 1997 | 13 | 294 | 14.7 | 35.9 |
| 1996 | 14 | 278 | 20.9 | 38.2 |
| 1995 | 15 | 288 | 17.0 | 42.8 |
Source: Bureau of Transportation Statistics
* Rate calculated using Bureau of Labor Statistics Consumer Price Index
Note: Percent change based on unrounded numbers
For air fares for the following airports, go to http://www.bts.gov/xml/atpi/src/index.xml.
Multiple airport areas for which a single average fare calculation is available are: Boston, Chicago, Dallas-Fort Worth, Houston, Los Angeles, New York, San Francisco and Washington, DC.
Airports covered by average fare calculations are:
Alabama: Birmingham, Huntsville
Arizona: Phoenix, Tucson
Arkansas: Little Rock
California: Burbank, Fresno, Long Beach, Los Angeles
Intl, Oakland, Ontario/San Bernardino, Sacramento, San Diego, San Francisco, San Jose, Santa Ana
( Orange County)
Colorado: Colorado Springs, Denver
Connecticut : Hartford
District of
Columbia: Dulles, Reagan National
Florida: Ft. Lauderdale, Ft. Myers, Jacksonville, Miami, Orlando, Pensacola, Tampa, West Palm Beach
Georgia: Atlanta
Idaho: Boise
Illinois: Chicago Midway, Chicago
O'Hare, Moline
Indiana: Indianapolis
Iowa: Des Moines
Kansas: Wichita
Kentucky: Louisville
Louisiana: New Orleans
Maine: Portland
Maryland: Baltimore
Massachusetts: Boston
Michigan: Detroit, Flint, Grand Rapids
Minnesota: Minneapolis/St. Paul
Mississippi: Jackson/Vicksburg
Missouri: Kansas City, St. Louis
Nebraska: Omaha
Nevada: Las Vegas, Reno
New Hampshire: Manchester
New Jersey: Atlantic City, Newark
New Mexico: Albuquerque
New York: Albany, Buffalo, Islip, New York JFK, New York LaGuardia,
Rochester, Syracuse, White Plains
North
Carolina: Charlotte, Greensboro,
Raleigh/Durham
Ohio: Akron/Canton, Cincinnati, Cleveland, Columbus, Dayton
Oklahoma: Oklahoma City, Tulsa
Oregon: Portland
Pennsylvania: Harrisburg, Philadelphia, Pittsburgh
Rhode Island: Providence
South
Carolina: Charleston
Tennessee: Knoxville, Memphis, Nashville
Texas: Austin, Dallas
Love, Dallas/Ft. Worth, El Paso, Houston Bush, Houston Hobby, Lubbock, San
Antonio
Utah: Salt Lake City
Vermont: Burlington
Virginia: Newport News/Williamsburg, Norfolk, Richmond
Washington: Seattle, Spokane
Wisconsin: Madison, Milwaukee