

Highlights of the 2008 National Census of Ferry Operators
by Bruce Goldberg, Theresa Firestine, and Kenneth Steve
 Bruce Goldberg |
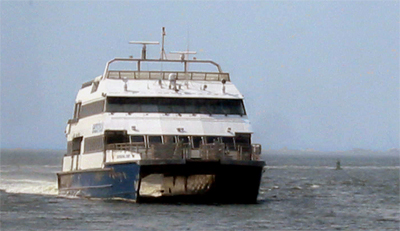
| A fleet of 669 active vessels, including this high-speed, twin-hull passenger ferry, operated on nearly 350 routes in 2007. |
In 2007, 190 ferry operators across the Nation provided service to an estimated 106 million passengers through nearly 500 terminals in 37 States and 3 U.S. Territories, using a fleet of almost 700 active vessels with capacity to carry as many as 6,000 passengers at a time, or as few as 2. Service was provided on nearly 350 different route segments, covering 7,877 route miles.
While the ferry network was somewhat smaller than 2 years earlier, it continued to play an important role providing commuter services in major metropolitan areas on both coasts, offering a vital intercity transportation link between coastal Alaska communities and the lower 48 States, and linking roadways and communities separated by various bodies of water. These are among the findings of the biennial 2008 National Census of Ferry Operators (NCFO), which collects self-reported data from operators of itinerant, regular route ferry services in the United States and its Territories.1 The NCFO collects data on operations during the previous year; thus references in this report to 2007, 2005, and 1999 data refer to the NCFOs conducted in 2008, 2006, and 2000.
The U.S. Ferry System
In addition to serving 37 States and 3 U.S. Territories, ferries in 2007 operated from the United States and its Territories to 3 Canadian provinces, 1 Mexican state, and 3 other international destinations. The 349 route segments with regular service2 covered 7,877 statute miles, or 6,844 nautical route-miles.3 The average segment was 22.6 statute miles (19.6 nautical miles).4 However, the median segment length is only 6 miles because a small number of long-distance routes skew the average segment length upward. The longest segment is 685 statute miles (595 nautical miles) from Ketchikan, AL, to Bellingham, WA.
Of the 349 segments with service, 280 were intrastate (within a single State or U.S. Territory), 51 interstate (between 2 States or U.S. Territories), and 17 segments were international. These route segments served a total of 508 ferry terminals, including 485 in the United States and 11 in U.S. Territories.5
The largest concentration of routes is in major metropolitan areas on both coasts where ferries provide an alternative access mode to the central city from outlying areas. The New York, Boston/Southern New England, San Francisco, and Seattle areas all have a significant number of ferry routes as part of the local transit infrastructure. The most significant long distance ferry routes are those operated by the Alaska State Ferries linking the coastal cities and towns in Alaska with each other, and with the lower 48 States at Bellingham, WA.
The number of ferry operators with regular route ferry service has declined since the first NCFO in 2000. In the 2000 NCFO, 224 operators provided service. There were 211 operators responding in 2006 and 190 in 2008.6 The number of route miles has also declined since the first NCFO. Table 1 shows key data about the extent of the ferry system as revealed by all three NCFO surveys.7
The Fleet
The U.S. ferry fleet, as reported by respondents to the NCFO, totaled 709 vessels. In addition, 12 foreign-based vessels provided service on international ferry routes serving the United States. Of the 709 vessels in the domestic fleet, 669 were in service during the survey year, 36 were not in service, and the service status of 4 vessels was not reported.
More ferries, 75, were based in New York than in any other State. Massachusetts had 67 vessels, California 65, and Washington 55.8 These four States accounted for 37 percent of all the ferry vessels in the United States and its territories. All four States have significant commuter ferry operations in major metropolitan areas.
Among the 709 vessels in the U.S. fleet, census respondents reported 627 as passenger carrying. Over 40 percent of the passenger carrying vessels (263) also carried vehicles. Operators reported 17 ferries as carrying vehicles only. (Table 2)
The average "typical speed" for the domestically based ferries is 16.2 miles per hour (14.1 knots per hour), while the average top speed is 19.9 mph (17.3 knots).9
The ferry fleet vessels cover a wide range of sizes. The median capacity for the fleet is 149 passengers. The largest ferries, operated by the New York City Department of Transportation Ferry Division between Manhattan and Staten Island, carry up to 6,000 passengers. The smallest ferries in the Nation's ferry fleet carry two passengers. The most predominant vessel size was the 100–199 passenger ferry. The distribution of vessel sizes is shown in figure 1.
Diesel is the predominant fuel for the ferry fleet, with 96.2 percent of the vessels using diesel fuel.10 The average age of the ferry fleet in 2007 was approximately 26 years. The oldest vessel in service was built in 1913 and operates between the States of New York and Vermont across Lake Champlain.
Terminals
In 2007, there were 485 active ferry terminals in the United States, 11 in U.S. territories, with international ferry routes from U.S. ports serving 12 international terminals outside of the United States. The 8 states that have 25 or more ferry terminals account for 270 of the 496 U.S. facilities in the database (54 percent). Table 3 shows the number of ferry facilities in each State.
Nearly 90 percent of ferry terminals are accessible by automobile. Of the 485 terminals for which auto access data were provided, 52 could not be accessed by road. In most cases the nonauto accessible terminals were either on islands (16 of the 52 are on Fire Island, NY) or were recreational area destination terminals. Slightly more than half of all terminals were reported to have auto parking available on site, and two-thirds of the terminals have some type of parking within a quarter-mile of the terminal.
Ferry passengers were able to make connections with other modes, on site, at about one in five ferry terminals. Additionally, the ferry operators responding to the NCFO report that intermodal connections with bus and rail service is available within a quarter-mile walk at nearly half of all terminals. The most prevalent connecting mode is the transit (local) bus, which is on-site at 16 percent of the terminals and within a quarter-mile of another 14 percent. Intercity bus is at or near 8 percent of the terminals, rail transit (subway, light rail, etc.) at or near 6 percent, and Amtrak and commuter rail at or near 4 percent. Connectivity details are shown in table 4.
Passenger Ferry Boardings
The total number of ferry passenger trips in 2007 was estimated at 106 million, as compared to an estimated 108 million in 2005. Imputation of ferry traffic was necessary because passenger boarding data were not available for ferry operators that did not respond to the Census, did not have access to the traffic data, refused to report the data, or required BTS to keep the data confidential. One-fifth of the passenger boarding values were imputed. The "nearest neighbor" imputation methodology11 was used to impute these missing values.
Comparison With Previous Reports
Care should be taken when making comparisons between the 2008 NCFO and prior year data. Some inconsistencies may appear in year-to-year comparisons due to changes in the way certain data have been tabulated in the 2008 NCFO. These include:
- variations in the number of responding carriers in 2008, 2006, and 2000;
- the right of carriers to request confidentiality for certain data they submit; and
- changes in survey questions and passenger boarding imputation methods.
In the case of data concerning the number of operators and terminals, data used in this report for previous years has been adjusted to be consistent with the 2008 NCFO data.
For example, in previous years, data was included on carriers that did not necessarily operate any qualifying service. As a result, the numbers shown for 2006 for operators and terminals in this report will differ from the numbers reported in the report on the 2006 NCFO.12 In regard to the extent of the ferry system, the loss of only two long route segments (706 and 1,480 miles) results in a large decline in the average segment length. These types of differences should be kept in mind when making comparisons across NCFO surveys
1 The National Census of Ferry Operators was first conducted in 2000 and resumed in 2006 on a biennial basis as mandated in the Safe, Accountable, Flexible, Efficient Transportation Equity Act: A Legacy for Users (SAFETEA-LU) in 2005.
2 A route segment is a route between two specific terminals. Therefore, a ferry that starts at one terminal (a), stops at another (b), and then ends its trip at a third terminal (c), would serve two route segments: a-b and b-c. a-c would not show in the database as a route segment since it was not served on a nonstop basis.
3 Route segment distances are reported in nautical miles. One nautical mile equals 1.15077945 statute miles.
4 When different operators on the same segment reported different segment lengths, this report used the average reported length. However, the average did not include reported segment lengths that had significant errors.
5 U.S. territories with ferry service were Puerto Rico, the U.S. Virgin Islands, and the Northern Marianas Islands.
6 The BTS Special Report, Highlights of the 2006 National Census of Ferry Operators, August 2008, available at www.bts.gov, reports the number of ferry operators in that census as 230. That figure, however, included all respondents to the survey, even if they were not operating any qualifying route service. There were 213 respondents to the NCFO in 2008, with 208 stating that they operated service during the year. However, only 190 operated regular route service. This report includes only those operators providing regular route service.
7 See the section on Comparison with Previous Reports at the end of this paper in regard to making comparisons across the three surveys.
8 The Massachusetts numbers do not include the vessels of The Steamship Authority, which operates a fleet of nine vessels according to its website, as of Dec. 9, 2009. The Steamship Authority did not respond to the National Census of Ferry Operators.
9 Respondents to the NCFO report vessel speed in knots. One knot (based on nautical miles) is equal to about 1.15 mph (based on statute miles).
10 Fuel type data was available for 654 of the 709 U.S. ferries in the fleet.
11 The passenger capacity of the vessel most commonly used for each operator & segment combination was most highly correlated with the reported passenger boardings; thus, it was used as the covariate for determining the nearest neighbor. Where this covariate was also missing, the average passenger capacity for all vessels in the operator fleet was substituted. Any remaining missing values of passenger capacity were set to zero.
12 U.S. Department of Transportation, Research and Innovative Technology Administration, Bureau of Transportation Statistics, Special Report—Highlights of the 2006 National Census of Ferry Operators, August 2008, Washington, DC, available at www.bts.gov.
About this Report This report was prepared by Bruce Goldberg, Transportation Specialist; Theresa Firestine, Economist; and Kenneth Steve, Survey Statistician in the Bureau of Transportation Statistics (BTS). BTS is a component of U.S. Department of Transportation's Research and Innovative Technology Administration. This report presents findings from the 2008 National Census of Ferry Operators (NCFO), which is administered by BTS. A similar census was conducted by BTS in 2006 and by the Federal Highway Administration (FHWA) in 2000. A total of 213 operators responded to the 2008 NCFO, although only 190 provided itinerant, fixed route, common carrier passenger, or vehicle ferry services. Operations that are exclusively nonitinerant, such as excursion services or long distance passenger only cruise ship services, are not covered in the NCFO. The NCFO requested data on operations as they were structured in 2007. The operator-provided data was supplemented, as needed, by other available sources such as the U.S. Coast Guard and Army Corps of Engineers data. The database contains information on ferry systems, route segments served, operators, vessels, passenger and vehicle boardings, peak travel times, and ferry terminals. For related BTS data and publications For copies of the BTS Special Report or questions about this or other BTS reports, call 1-800-853-1351, email answers@bts.gov, or visit www.bts.gov. Data on the BTS website—
Related BTS Publications—
|