Advance GDP by Industry Statistics for 2011
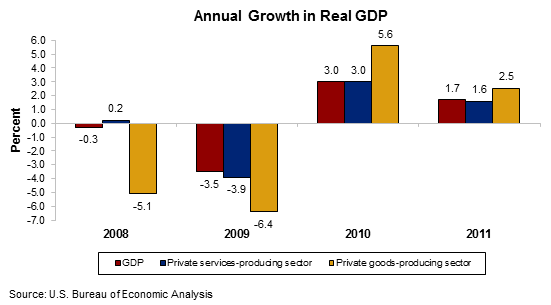
Durable-goods manufacturing, professional, scientific, and technical services, and information services were the leading contributors to U.S. economic growth in 2011, according to advance statistics on the breakout of real gross domestic product (GDP) by industry from the Bureau of Economic Analysis. Overall, 15 of 22 industry groups contributed to the 1.7 percent increase in real GDP.
- Real manufacturing value added—a measure of an industry’s contribution to GDP—rose 4.3 percent in 2011, after increasing 11.2 percent in 2010. Durable-goods manufacturing, the largest contributor to overall growth, increased 7.9 percent, after increasing 17.0 percent in 2010. Nondurable-goods manufacturing rose 0.3 percent in 2011, after increasing 5.1 percent in 2010.
- Professional, scientific, and technical services increased 4.9 percent in 2011, matching the 2010 growth rate.
- Information services, which includes publishing and telecommunications, accelerated in 2011, increasing 5.1 percent after increasing 3.0 percent in 2010.
Prices:
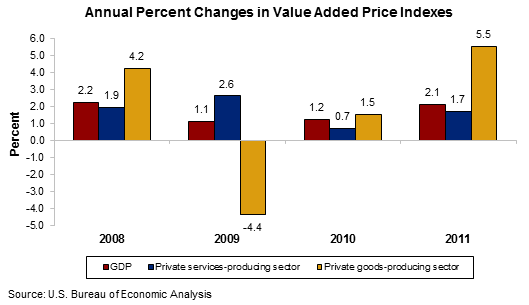
Value added prices accelerated in 2011, increasing 2.1 percent after increasing 1.2 percent in 2010. Retail trade and nondurable-goods were among the largest contributors to the acceleration in the GDP price index for 2011. Value added prices measure changes in an industry’s unit costs of capital and labor inputs, as well as the profits per unit of output, and reflect the productivity of capital and labor used by the industry.
- Value added prices for the goods-producing sector accelerated in 2011, increasing 5.5 percent after increasing 1.5 percent in 2010. Value added prices for the services-producing sector also accelerated in 2011, increasing 1.7 percent after increasing 0.7 percent in 2010.
- Value added prices for retail trade turned up in 2011, increasing 1.6 percent after decreasing 4.0 percent in 2010.
- Value added prices for real estate and rental and leasing turned up in 2011, increasing 1.9 percent in 2011, after decreasing 1.0 percent in 2010.
Other highlights:
- Manufacturing’s current-dollar share of GDP increased for the second consecutive year, to 12.2 percent, its highest share since 2006, and reflected increases in both durable and nondurable-goods manufacturing.
- Mining value added turned up in 2011, increasing 6.4 percent after decreasing 6.1 percent in 2010.
- Real value added for the utilities sector turned down in 2011, decreasing 6.2 percent after increasing 3.3 percent in 2010.
BEA’s national, international, regional, and industry estimates; the Survey of Current Business; and BEA news releases are available without charge on BEA’s Web site at www.bea.gov. By visiting the site, you can also subscribe to receive free e-mail summaries of BEA releases and announcements.